 2016, Vol. 59


2. 云南省地震局, 昆明 650224;
3. 安徽省地震局, 合肥 230031
2. Earthquake Administration of Yunnan Province, Kunming 650224, China;
3. Earthquake Administration of Anhui Province, Hefei 230031, China
地磁场是基本地球物理场之一,准确描述地磁场的空间分布及时间变化是地磁学家的主要研究内容与重点关注对象.通过实际地磁观测数据建立的准确地磁场模型被广泛用于矿产、能源、航空航天、通信导航、地质构造、地震预测、地球深部研究、空间天气与空间电磁环境研究等诸多科学领域,与国民经济、国防建设与社会公益事业有着十分密切的相 关性(付承义等,1985;Campbell,2003;徐文耀,2003;康国发等,2008,2010;徐如刚等,2014).
尽管已有若干全球地磁场模型对全球磁场进行高分辨率描述,但由于数据来源和研究区域等因素的影响,全球地磁场模型存在数百纳特的差异(王亶文,2003;陈斌等,2012;刘元元等,2013),因此开展研究区域一定时间-空间密度的地磁测量、获取地磁场的局部时-空数据、选取合适的地磁场建模方法、分析地磁场的区域时空分布形态、提取地磁场的区域时空变化特征、建立研究区域的区域地磁场模型是解决问题的常用思路.
选取合适的区域地磁场分析方法,从中国大陆地区高时-空分辨率的地磁数据中分析地磁场的时间-空间分布形态,提取区域地磁场的时空变化特征,并建立高精度的中国及邻近区域磁场模型,以期为诸多科学领域和民用领域提供基础的、准确的、可信的中国地区地磁数据,是本文的主要研究目的及意义.
球谐分析是地磁场常规建模方法中应用最为普遍的一种,在这一方法下衍生了各种不同空间分辨率、时间分辨率及物理内涵的全球地磁场模型,如国 际地磁参考场(International Geomagnetic Reference Field,IGRF)、世界磁场模型(World Magnetic Model,WMM)、增强的磁场模型(Enhanced Magnetic Model,EMM)、 综合模型(Comprehensive Model,CM)等(Olsen et al.,2000,2006; Maus et al.,2005,2006,2007,2008,2009a,2009b; Sabaka et al.,2002,2004; Hamoudi et al.2007; Purucker,2007; Finlay et al.,2010).
以IGRF为代表的全球地磁场模型,是描述全球地磁场的.然而,地磁场具有区域特征,全球地磁场模型不能准确反映地磁场的区域特征,而需要区域地磁模型.各国学者利用本国的地磁观测数据,应用各种数学方法对区域地磁场进行描述,建立了各自的区域地磁场模型、分析了区域地磁场,研究了区 域地磁模型(Alldredge,1982,1987; Ates et al.,1999; Barton,1988; Burdelnaya et al.,1999; Büyüksaraş et al.,2005; Geese et al.,2010; Verbanac,2007; Ji et al.,2006; Korte and Haak,2000; 徐文耀等,2011;狄传芝等,2011;陈斌等,2014).
中国学者也应用多种方法,建立了不同年代的中国及邻近地区的地磁模型,以分析研究地磁场及其长期变化的时空分布特征,取得一系列重要科研成果(安振昌,2002).Chen(1948)应用泰勒多项式方法描述了四川北碚地区的地磁场分布.安振昌、徐文耀、夏国辉等计算并分析研究了中国及邻近地区地磁场泰勒多项式模型(安振昌等,1995;Xu et al.,2003;夏国辉等,1988;徐元芳等,1994;陈化然和蒋邦本,1997;冯彦等,2010).An等(2004)、高金田等(2006)、陈斌等(2010)应用曲面样条方法,分析与研究了中国及邻近地区的地磁场及其长期变化的曲面样条模型.徐文耀和朱岗昆(1984)、王月华等(1999)对中国及邻近地区的地磁场进行了矩谐分析.安振昌、顾左文等研究了球冠谐分析方法,获得了中国及邻近地区地磁场及其长期变化的球冠谐模型(安振昌,1993,2003;安振昌等,1998;顾左文等,2004,2006;高金田等,2005;Gu et al.,2006a).王月华(2002)、顾左文等(2009)应用自然正交分量(NOC)方法,建立了中国及邻近地区地磁时空变化的NOC模型.冯丽丽(2015)综合应用地面观测的地磁资料与卫星磁测资料,建立了中国及其周边地区的谐和样条地磁模型.
2008年至2009年,在中国大陆地区进行了一轮新的地磁测量工作,着重缩短了青藏、新疆等中国西部地区的测量点位间距.数据的空间分辨率仅次于1970年代获取的地磁数据.本文将依托这一数据对中国及邻近地区的地磁场特征进行描述和分析.
2 数据来源及处理2008年至2009年期间,在中国大陆地区共进行了851个测点的地磁矢量测量工作,测点的空间分布如图 1所示.在南北地震带、华北及周边地区及新疆等地区的平均测点间距约为70 km,在其他地区的平均测点间距约为150 km.特别提出的是,在南海海域的西沙和南沙的岛礁上各执行了一个测点的测量.这些地磁观测数据是本文进行地磁场分析的主要数据来源.
 | 图 1 2010.0年代中国地磁图测点空间分布 Fig. 1 Survey sites for China geomagnetic chart in 2010.0 epoch |
图 1中紫红色表示的431个测点是观测于2002年至2004年期间的地磁数据.这部分数据也被收集整理并参与了本文的建模与分析.
除上述两类测点的地磁观测数据外,还有23个近邻海岛测点的测量数据、菲律宾82个测点的历史地磁观测数据、其他周边国家85个测点的历史地磁观测数据、中国国内32个地磁台站观测地磁场数据和周边国家11个地磁台站观测地磁数据参与了本文的建模和分析.所有的测点,在中国中西部地区和新疆大部分地区的平均间距为70 km,在东北、青藏和新疆沙漠地带的平均间距为150 km.图 1展示了全部测点的空间分布.
将全部测点的地磁观测数据进行日变通化和长期变化改正后,统一归算到2010年1月1日北京时00—03时的地磁场均值.日变化改正所使用的参考数据为距离测点最近的地磁台站连续观测分均值数据,长期变化的参考数据则是根据“1995年1月1日至2013年2月18日中国地区地磁场长期变化6阶NOC模型”的计算值,该模型能描述地磁场95% 的变化能量(顾左文等,2009;陈斌等,2010),用于地磁场长期变化模型计算的基础数据为上述地磁台站1995年1月1日至2013年2月18日的连续时均值数据.
由于地磁测点主要分布的区域,选择覆盖中国及邻近地区的模型计算区域为18°N—54°N,73°E—136°E.为弥补中国疆域外测点缺失,同时为降低边界畸变,在计算区域边缘处均匀选取36个补充点,根据IGRF11(Finlay et al.,2010)计算出这36个补充点的地磁场值作为强化约束条件.
3 球冠谐和分析计算结果球冠谐和理论用(1)式描述地磁异常场的空间分布:
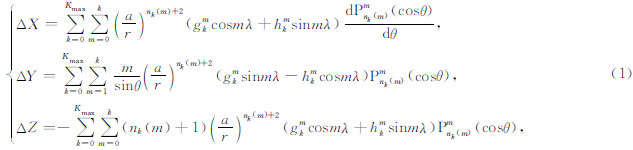
依据原始数据的区域范围,选定的计算区域为18°N—54°N,73°E—136°E,依此选定球冠极点为36°N,104.5°E,球冠半角为30°.
在进行地磁场球冠谐和模型计算时,面临的主要技术问题是截断阶数的确定.一般是试算若干截断阶数的模型,根据对各模型计算值和实际观测值的最小二乘残差及相应的边界畸变的综合评价,最终确定采用的球冠谐和截断阶数.试算1~11阶的“2010.0年代中国地区地磁场球冠谐和模型”,残差分布如图 2所示.随着截断阶数Kmax的增加,各分量残差逐步减小,但减小幅度均较小,当Kmax≥8时,减小的幅度已趋于平稳.但随着Kmax的继续增大,计算区域边界处出现明显的越来越严重的畸变,综合考虑最终确定截断阶数为8阶.
 | 图 2 试算的1~11阶球冠谐和模型残差 Fig. 2 RMS of SCH model on 1~11 order |
用球冠谐和方法建立地磁场模型时,如能获得完备的边界条件,则可获得相应的解析解.但现实是,观测数据是有限的,因此只能求取数值解.由于地磁X和Z分量可比地磁Y分量大百倍,球冠谐和方法选用地磁异常场数据拟合模型系数,即需选用1个正常场参考模型,从观测数据减去该参考模型的理论计算值,所剩余的差值用于球冠谐和模型计算.这样,各分量数量级近似,最终求解方程组才能获得稳定数值解.在此,选用了13阶的IGRF11作为正常场参考模型.所获得的8阶球冠谐和模型即为异常场模型,该模型与IGRF11之和为“2010.0年代中国地区地磁场8阶球冠谐和模型”.图 3是上述模型各地磁要素的等值线图.
 | 图 3 球冠谐和方法描述的2010.0地磁场与地磁异常场空间分布 Fig. 3 Spatial distributions of geomagnetic normal and abnormal fields in China in 2010.0 epoch by SCH method |
| | 表 1 2010.0年代中国地区地磁场8阶球冠谐和模型系数 Table 1 Coefficients of 8-order SCH model for China geomagnetic field in 2010.0 epoch |
图 3表明,“2010.0年代中国地区地磁场8阶球冠谐和模型”与IGRF11所描述的地磁场空间分布虽然大体趋势一致,但局部存在5′(D、I)、 100 nT(F、H、X、Z)或50 nT(Y)的地磁异常场分布.
“2005.0年代中国地区地磁场8阶球冠谐和模型”(陈斌等,2011)与“2010.0年代中国地区地磁场8阶球冠谐和模型”两个不同年代的地磁场模型描述的地磁各要素的空间分布较为相似,但局部略有变化.各地磁要素空间分布的特点为:
(1)磁偏角D和东向分量Y的空间分布大致可理解为负值区域增加,如新疆北部地区由正异常区转为负异常区,西藏东部正异常的减弱,内蒙中部负异常区的出现和西南局部(云南、贵州、广西)负异常的增强.
(2)磁倾角I在我国华北、华南和东北大部大面积正异常区消失了,但在我国西北部大面积的负异常区仍然维持.在新疆西北部和内蒙中北部的正异常区似乎呈现一种向西北方向漂移的过程,在东北东部和华南局部(江西、湖南)的负异常则扩大至中国东部地区.
(3)总强度F和垂直分量Z在我国整体的负异常分布仍然维持,新疆西部局部地区和东南沿海地区局部的正异常分布则略有变化.
(4)水平分量H和北向分量X在2005.0年代呈现大范围的负值分布,仅在局部地区(新疆局部地区和东北东部局部)呈现正值分布.但在2010.0年代,东南地区出现了大范围的正值区,而且在中国北部出现了一条东西条带状的正值区.似乎可以认为是2005.0年代存在于太平洋的正异常区向西移动扩大的结果(魏自刚和徐文耀,2005).
发生上述现象的主要原因如下:
(1)地磁场的长期变化是稳定、缓慢、规律的(Finlay et al.,2010).因此同地区相隔5年重复观测获取的地磁场空间分布不应有显著的不同,而应具有相似性和传承性.因此,同一模型计算方法和计算条件得到的“2005.0年代中国地区地磁场8阶球冠谐和模型”和“2010.0年代中国地区地磁场8阶球冠谐和模型”描述的各地磁要素正常场和异常场的空间分布应大致相同.
(2)较之于2005.0年代中国地磁场球冠谐和模型计算时的原始数据,2010.0年代应用了较多的国外地磁数据作为边界约束参与计算,但由于对境外数据的观测质量、处理过程等方面缺乏了解,其地磁数据整体的准确可靠性可能比2005.0年代的低些.这可能是导致2010.0年代的球冠谐和模型均方误差较高的原因.
4 曲面样条分析计算结果曲面样条的拟合公式为:
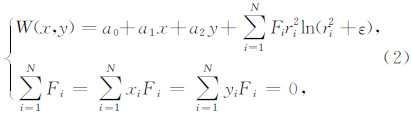
图 4表明,“2010.0年代中国地区地磁场曲面样条模型”与IGRF11所描述的地磁场空间分布大体趋势一致,但地磁场要素等值线在局部出现曲折的形态变化,说明局部存在地磁场差异,等值线较为弯曲的地方对应地磁异常区域.
 | 图 4 曲面样条(SP)方法与IGRF描述的2010.0地磁场空间分布 Fig. 4 Spatial distributions of geomagnetic fields in China in 2010.0 epoch described by SP and IGRF |
相对于IGRF11、“2010.0年代中国地区地磁场球冠谐和模型”,“2010.0年代中国地区地磁场曲面样条模型”描述的各地磁要素的空间分布均较为曲折.最为显著的异常位于蒙古境内,导致零偏线产生了较为明显和较大幅度的转折.推测这一异常可能是由于收集的蒙古境内地磁数据质量不佳导致的,但检查复核该异常周边若干测点的观测数据均支持该异常的存在,因此在模型计算时予以保留.其次,各地磁要素在滇东北地区、东北及华北大部、新疆等地区均存在大范围的地磁场等值线扭曲,而在华南、甘肃、青海、四川等地区则表现为较为平滑的形态.
5 结论与讨论本文利用在2008年至2009年期间在中国地区开展的大量地磁矢量测量获取的地磁数据,结合之前观测以及收集整理的地磁数据,形成了覆盖中国及邻近地区的地磁数据点阵.该数据点阵在中国中东部的点间距达到70 km左右,在中国西部达到150 km左右.分别用球冠谐和方法和曲面样条方法建立中国及邻近地区的参考模型,并与IGRF11、“2005.0中国地磁参考场球冠谐和模型”和“2005.0中国地磁参考场曲面样条模型”比较,得到的主要结论如下:
(1)“2005.0中国地磁参考场球冠谐和模型”和“2010.0中国地磁参考场球冠谐和模型”描述的各地磁要素的空间分布较为相似,局部略有变化的地区似乎可以理解为地磁场局部异常的向西漂移,能反映和表述地磁场变化的稳定、规律和缓慢.因此,尽管两个年代的地磁测点空间分布形态存在局部的调整,但球冠谐和方法仍能较为理想地描述各年代地磁场各要素的空间分布的异同.
(2)由于测点布设时遵循了“准均匀”且避开浅表磁异常区的布设原则,曲面样条方法能更“如实”地描绘所观测到的地磁场各要素的空间分布,并较为直接地给出地磁要素等值线空间分布特征,是一种需要关注空间细节时较好的数值拟合方法.
(3)由于西部地区原始观测数据较为稀疏,因此依据曲面样条方法绘制的西部的地磁要素的空间分布等值线也较为平直.因此考虑地磁场各要素的空间分布特征时应考虑原始观测数据空间分布的密度、均匀性.同时,数据的观测质量是描述地磁场异常的基础,恰当的模型计算方法仅是描述磁场空间异常的表述方式.
(4)相对于国际地磁参考场的计算结果,磁倾角I、垂直分量Z、总强度F在我国的大部分地区表现为负异常.磁偏角D和东向分量Y在我国的东部表现为正异常,西部表现为负异常.水平分量H和北向分量X在2005.0年代至2010.0年代的变化最为显著,在2005.0年代表现为大范围的负异常,而在2010.0年代出现了正负异常交错的条带状分布.
(5)中国大陆地区的主要地磁异常区位于滇东北地区、黑龙江及内蒙古东部、新疆西北部、华北地区等.由于原始测点布设时参考了航磁异常资料,尽量避开了某些磁异常区,因此对于上述磁异常区的认识可能需要空间密度更高的地磁数据的支持与参与.
(6)对于蒙古境内的巨大磁异常,需依赖新获取的数据进行检验和修正,这一问题将另文讨论.
致谢 国家地磁台网中心为本文数据处理提供地磁台站观测数据支持,安徽省地震局、云南省地震局、甘肃省地震局、河北省地震局、新疆维吾尔自治区地震局、黑龙江省地震局部分人员为本论文的撰写提 供了野外工作和台站数据支持.国际地磁学与高空 物理学协会(International Association of Geomagnetism and Aeronomy,IAGA),国际地磁实时观测网(International Real-time Magnetic Observatory Network,INTERMAGNET),英国地质调查局(British Geological Survey,BGS),美国国家海洋和大气管理局国家地球物理数据中心(National Geophysical Data Center,National Oceanic and Atmospheric Administration,NGDC-NOAA)提供数据及模型支持.| [1] | Alldredge L R. 1982. Geomagnetic local and regional harmonic analysis. J. Geophys. Res., 87(B3): 1921-1926. |
| [2] | Alldredge L R. 1987. On regional magnetic charts. J. Geomag. Geoelectr., 39(12): 723-738. |
| [3] | An Z C. 1993. Spherical cap harmonic analysis of geomagnetic field for China. Chinese J. Geophys. (Acta Geophysica Sinica) (in Chinese), 36(6): 753-764. |
| [4] | An Z C, Tan D H, Golovkov V P, et al. 1995. Legendre polymial models of the geomagnetic field over eastern Asia at epoch 1980.0. Chinese J. Geophys. (Acta Geophysica Sinica) (in Chinese), 38(2): 227-233. |
| [5] | An Z C, Tan D H, Rotanova N M, et al. 1998. Spherical cap harmonic analysis of MAGSAT magnetic anomalies over Asia. Chinese J. Geophys. (Acta Geophysica Sinica) (in Chinese), 41(2): 168-173. |
| [6] | An Z C. 2002. Review of geomagnetic surveys, geomagnetic charts and geomagnetic field models in China. Chinese J. Geophys. (in Chinese), 45(Suppl.): 189-196. |
| [7] | An Z C. 2003. Spherical cap harmonic analysis of the geomagnetic field and its secular variation in China for 2000. Chinese J. Geophys. (in Chinese), 46(1): 68-77. |
| [8] | An Z C, Gu Z W, Xia G H, et al. 2004. Surface Spline applied to the geomagnetic field and its anomaly field in China for 1970. //Zhang Z J eds. Research on Deep Earth Structure and Dynamics of China Continental. Beijing: Science Press. 896-907. |
| [9] | Ates A, Kearey P, Tufan S. 1999. New gravity and magnetic anomaly maps of Turkey. Geophys. J. Int., 136(2): 499-502. |
| [10] | Barton C E. 1988. Global and regional geomagnetic reference fields. Exploration Geophysics, 19(3): 401-416. |
| [11] | Burdelnaya I A, Filippov S V, Golovkov V P, et al. 1999. Regional orthogonal models of the geomagnetic field changes over the Far East. Earth, Planets and Space, 51(4): 287-296. |
| [12] | Büyüksaraş A, Jordanova D, Ate A, et al. 2005. Interpretation of the gravity and magnetic anomalies of the Cappadocia region, central Turkey. Pure Appl. Geophys., 162(11): 2197-2213. |
| [13] | Campbell W H. 2003. Introduction to Geomagnetic Fields. 2nd ed. New York: Cambridge University Press. |
| [14] | Chen B, Gu Z W, Gao J T, et al. 2010. Study of geomagnetic secular variation in China. Chinese J. Geophys. (in Chinese), 53(9): 2144-2154, doi: 10.3969/j.issn.0001-5733.2010.09.014. |
| [15] | Chen B, Gu Z W, Gao J T, et al. 2011. Analyses of geomagnetic field and its secular variation over China for 2005.0 epoch using Spherical Cap Harmonic method. Chinese J. Geophys. (in Chinese), 54(3):771-779, doi:10.3969/j.issn.0001-5733.2011.03.017. |
| [16] | Chen B, Gu Z W, Gao J T, et al. 2012. Geomagnetic secular Variation in China during 2005—2010 described by IGRF-11 and its error analysis. Progress in Geophysics (in Chinese), 27(2): 512-521, doi: 10.6038/j.issn.1004-2903.2012.02.014. |
| [17] | Chen B, Yuan J H, Wang L, et al. 2014. Geomagnetic field over Mongolia for 2010.0 epoch using Spherical Cap Harmonic method. Earth Science—Journal of China University of Geosciences (in Chinese), 39(12): 1927-1932. |
| [18] | Chen H R, Jiang B B. 1997. On the method of establishing basic geomagnetic field of China. Crust Deformation and Earthquake (in Chinese), 17(2): 75-81. |
| [19] | Chen P C. 1948. A detailed geomagnetic survey of Pehpei district, Szechuan, China. Chinese J. Geophys. (Acta Geophysica Sinica), 1(2): 177-186. |
| [20] | Di C Z, Gu Z W, Soriano B M, et al. 2011. The study of magnetic field models for Philippines and its neighboring regions. Chinese J. Geophys. (in Chinese), 54(8): 2085-2092, doi: 10.3969/j.issn.0001-5733.2011.08.015. |
| [21] | Feng L L. 2015. Harmonic spline modeling of regional geomagnetic field [Ph. D. Thesis](in Chinese). Beijing: Institute of Geophysics, China Earthquake Administration. |
| [22] | Feng Y, An Z C, Sun H, et al. 2010. A study on model of geomagnetic normal field of China region. Advances in Earth Science (in Chinese), 25(7): 723-729. |
| [23] | Finlay C C, Maus S, Beggan C D, et al. 2010. International geomagnetic reference field: the eleventh generation. Geophys. J. Int., 183(3): 1216-1230. |
| [24] | Fu C Y, Chen Y T, Qi G Z. 1985. Introduction to Geophysics (in Chinese). Beijing: Science Press. |
| [25] | Gao J T, An Z C, Gu Z W, et al. 2005. Selections of the geomagnetic normal field and calculations of the geomagnetic anomalous field. Chinese J. Geophys. (in Chinese), 48(1): 56-62. |
| [26] | Gao J T, An Z C, Gu Z W, et al. 2006. Distributions of the geomagnetic field and its secular variations expressed by the surface spline method in China (a part) for 1900—1936. Chinese J. Geophys. (in Chinese), 49(2): 398-407. |
| [27] | Geese A, Mandea M, Lesur V, et al. 2010. Regional modelling of the Southern African geomagnetic field using harmonic splines. Geophys. J. Int., 181(3): 1329-1342. |
| [28] | Gu Z W, An Z C, Gao J T, et al. 2004. Spherical cap harmonic analysis of the geomagnetic field in the Beijing-Tianjin-Hebei region. Chinese J. Geophys. (in Chinese), 47(6): 1003-1008. |
| [29] | Gu Z W, Zhan Z J, Gao J T, et al. 2006a. Geomagnetic survey and geomagnetic model research in China. Earth Planets Space, 58(6): 741-750. |
| [30] | Gu Z W, An Z C, Gao J T, et al. 2006. Computation and analysis of the geomagnetic field model in China and its adjacent area for 2003. Acta Seismologica Sinica (in Chinese), 28(2): 141-149. |
| [31] | Gu Z W, Chen B, Gao J T, et al. 2009. Research of geomagnetic spatial-temporal variations in China by the NOC method. Chinese J. Geophys. (in Chinese), 52(10): 2602-2612, doi: 10.3969/j.issn.0001-5733.2009.10.020. |
| [32] | Hamoudi M, Thébault E, Lesur V, et al. 2007. GeoForschungsZentrum anomaly magnetic map (GAMMA): a candidate model for the world digital magnetic anomaly map. Geophys. Geochem. Geosyst., 8(6): Q06023, doi: 10.1029/2007GC001638. |
| [33] | Ji X L, Utsugi M, Shirai H, et al. 2006. Modelling of spatial-temporal changes of the geomagnetic field in Japan. Earth Planets Space, 58(6): 757-763. |
| [34] | Kang G F, Bai C H, Gao G M. 2008. Periodical characteristics of the geomagnetic secular variation and length-of-day variation. Chinese J. Geophys. (in Chinese), 52(2): 369-375. |
| [35] | Kang G F, Gao G M, Bai C H, et al. 2010. Distribution of the magnetic anomaly for the CHAMP satellite in China and adjacent areas. Chinese J. Geophys. (in Chinese), 53(4): 895-903, doi: 10.3969/j.issn.0001-5733.2010.04.014. |
| [36] | Korte M, Haak V. 2000. Modelling European magnetic repeat station and survey data by SCHA in search of time-varying anomalies. Physics of the Earth and Planetary Interiors, 122(3-4): 205-220. |
| [37] | Liu Y Y, Wang S C, Zhang J S, et al. 2013. Research on the eleventh generation IGRF. Acta Seismologica Sinica (in Chinese), 35(1): 125-134. |
| [38] | Maus S, Macmillan S, Chernova T, et al. 2005. The 10th-generation international geomagnetic reference field. Geophys. J. Int., 161(3): 561-565. |
| [39] | Maus S, Rother M, Stolle C, et al. 2006. Third generation of the Potsdam magnetic model of the Earth (POMME). Geochem. Geophys. Geosyst., 7(7): Q07008, doi: 10.1029/2006GC001269. |
| [40] | Maus S, Lühr H, Rother M, et al. 2007. Fifth-generation lithospheric magnetic field model from CHAMP satellite measurements. Geochem. Geophys. Geosyst., 8(6): Q05013, doi: 10.1029/2006GC001521. |
| [41] | Maus S, Yin F, Lühr H, et al. 2008. Resolution of direction of oceanic magnetic lineations by the sixth-generation lithospheric magnetic field model from CHAMP satellite magnetic measurements. Geochem. Geophys. Geosyst., 9, doi: 10.1029/2008GC001949. |
| [42] | Maus S, Macmillan S, Mclean S, et al. 2009a. The US/UK World Magnetic Model for 2010—2015. NOAA Technical Report NESDIS/NDGC. |
| [43] | Maus S, Barckhausen U, Berkenbosch H, et al. 2009b. EMAG2: A 2-arc min resolution Earth Magnetic Anomaly Grid compiled from satellite, airborne, and marine magnetic measurements. Geochem. Geophys. Geosyst., 10: Q08005, doi: 10.1029/2009GC002471. |
| [44] | Olsen N, Holme R, Hulot G, et al. 2000. Ørsted initial field model. Geophys. Res. Lett., 27(22): 3607-3610. |
| [45] | Olsen N, Lühr H, Sabaka T J, et al. 2006. CHAOS-a model of the Earth's magnetic field derived from CHAMP, Ørsted, and SAC-C magnetic satellite data. Geophys. J. Int., 166(1): 67-75. |
| [46] | Purucker M E. 2007. Magnetic anomaly map of the world. EOS Trans. AGU, 88(25): 263. |
| [47] | Sabaka T J, Olsen N, Langel R A. 2002. A comprehensive model of the quiet-time, near-Earth magnetic field: phase 3. Geophys. J. Int., 151(1): 32-68. |
| [48] | Sabaka T J, Olsen N, Purucker M E. 2004. Extending comprehensive models of the Earth's magnetic field with Orsted and Champ data. Geophys. J. Int., 159(2): 521-547. |
| [49] | Verbanac G. 2007. On regional modeling of the main geomagnetic field. Geofizika, 24(1): 1-27. |
| [50] | Wang D W. 2003. Analysis of the international geomagnetic reference field error in the China continent. Chinese J. Geophys. (in Chinese), 46(2): 171-174. |
| [51] | Wang Y H, An Z C, Golovkov V P, et al. 1999. Theoretical analysis of geomagnetic field over East Asia and rectangular harmonic model. Chinese J. Geophys. (in Chinese), 42(5): 640-647. |
| [52] | Wang Y H. 2002. Regional orthogonal model of secular variation of the geomagnetic field in China during 1985—1997. Chinese J. Geophys. (in Chinese), 45(5): 624-630. |
| [53] | Wei Z G, Xu W Y. 2005. Dispersion of the westward drift rate in the non-dipole geomagnetic field. Chinese J. Geophys. (in Chinese), 48(6): 1276-1281. |
| [54] | Xia G H, Cheng S L, Wu L L, et al. 1988. The geomagnetic field chart of China in 1980.0 and the geomagnetic model. Chinese J. Geophys. (Acta Geophysica Sinica) (in Chinese), 31(1): 82-89. |
| [55] | Xu R G, Gu Z W, Li Z J, et al. 2014. Application of Chinese geomagnetic survey and geomagnetic model for 2005—2010. Progress in Geophysics (in Chinese), 29(5): 2092-2099, doi: 10.6038/pg20140515. |
| [56] | Xu W Y, Tschu K K. 1984. A study of the RHA for the geomagnetic field of China and neighbouring region. Chinese J. Geophys. (Acta Geophysica Sinica) (in Chinese), 27(6): 511-522. |
| [57] | Xu W Y. 2003. Geomagnetism (in Chinese). Beijing: Seismological Press. |
| [58] | Xu W Y, Xia G H, An Z C, et al. 2003. Magnetic survey and ChinaGRF 2000. Earth Planet Space, 55(4): 215-217. |
| [59] | Xu W Y, Qu J M, Du A M. 2011. Geomagnetic field modelling for the globe and a limited region. Progress in Geophysics (Chinese), 26(2): 398-415. |
| [60] | Xu Y F, An Z C, Golovkov P V, et al. 1994. Analysis of the geomagnetic secular variation in eastern Asia during the last 30 years. Chinese J. Geophys. (Acta Geophysica Sinica) (in Chinese), 37(S2): 287-295. |
| [61] | 安振昌. 1993. 中国地区地磁场的球冠谐和分析. 地球物理学报, 36(6): 753-764. |
| [62] | 安振昌, 谭东海, Golovkov V P等. 1995. 1980.0年东亚地区地磁场的勒让德多项式模型. 地球物理学报, 38(2): 227-233. |
| [63] | 安振昌, 谭东海, Rotanova N M等. 1998. 亚洲MAGSAT卫星磁异常冠谐分析. 地球物理学报, 41(2): 168-173. |
| [64] | 安振昌. 2002. 中国地磁测量、地磁图和地磁场模型的回顾. 地球物理学报, 45(Suppl.): 189-196. |
| [65] | 安振昌. 2003. 2000年中国地磁场及其长期变化冠谐分析. 地球物理学报, 46(1): 68-77. |
| [66] | 陈斌, 顾左文, 高金田等. 2010. 中国地区地磁长期变化研究. 地球物理学报, 53(9): 2144-2154, doi: 10.3969/j.issn.0001-5733.2010.09.014. |
| [67] | 陈斌,顾左文,高金田等. 2011. 2005.0年代中国地区地磁场及其长期变化球冠谐和分析. 地球物理学报,54(3):771-779,doi:10.3969/j.issn.0001-5733.2011.03.017. |
| [68] | 陈斌, 顾左文, 高金田等. 2012. IGRF-11描述的2005—2010年中国地区地磁长期变化及其误差分析. 地球物理学进展, 27(2): 512-521, doi: 10.6038/j.issn.1004-2903.2012.02.014. |
| [69] | 陈斌, 袁洁浩, 王雷等. 2014. 2010.0年代蒙古地区地磁场曲面样条. 地球科学——中国地质大学学报, 39(12): 1927-1932. |
| [70] | 陈化然, 蒋邦本. 1997. 中国地磁基本场模式建立方法探讨. 地壳形变与地震, 17(2): 75-81. |
| [71] | 狄传芝, 顾左文, Soriano B M等. 2011. 菲律宾及其邻近地区的地磁场模型研究. 地球物理学报, 54(8): 2085-2092, doi: 10.3969/j.issn.0001-5733.2011.08.015. |
| [72] | 冯丽丽. 2015. 区域地磁场谐和样条模型研究. 北京: 中国地震局地球物理研究所. |
| [73] | 冯彦, 安振昌, 孙涵等. 2010. 中国地区地磁正常场模型研究. 地球科学进展, 25(7): 723-729. |
| [74] | 付承义, 陈运泰, 祁贵仲. 1985. 地球物理学基础. 北京: 科学出版社. |
| [75] | 高金田, 安振昌, 顾左文等. 2005. 地磁正常场的选取与地磁异常场的计算. 地球物理学报, 48(1): 56-62. |
| [76] | 高金田, 安振昌, 顾左文等. 2006. 用曲面Spline方法表示1900—1936年中国(部分地区)地磁场及其长期变化的分布. 地球物理学报, 49(2): 398-407. |
| [77] | 顾左文, 安振昌, 高金田等. 2004. 京津冀地区地磁场球冠谐分析. 地球物理学报, 47(6): 1003-1008. |
| [78] | 顾左文, 安振昌, 高金田等. 2006. 2003年中国及邻区地磁场模型的计算与分析. 地震学报, 28(2): 141-149. |
| [79] | 顾左文, 陈斌, 高金田等. 2009. 应用NOC方法研究中国地区地磁时空变化. 地球物理学报, 52(10): 2602-2612, doi: 10.3969/j.issn.0001-5733.2009.10.020. |
| [80] | 康国发, 白春华, 高国明. 2008. 地磁场长期变化和日长十年尺度变化的周期特征. 地球物理学报, 51(2): 369-375. |
| [81] | 康国发, 高国明, 白春华等. 2010. 中国及邻近地区CHAMP卫星磁异常的分布特征. 地球物理学报, 53(4): 895-903, doi: 10.3969/j.issn.0001-5733.2010.04.014. |
| [82] | 刘元元, 王仕成, 张金生等. 2013. 最新国际地磁参考场模型IGRF11研究. 地震学报, 35(1): 125-134. |
| [83] | 王亶文. 2003. 国际地磁参考场在中国大陆地区的误差分析. 地球物理学报, 46(2): 171-174. |
| [84] | 王月华, 安振昌, Golovkov V P等. 1999. 东亚地区地磁场的理论分析与矩谐模型. 地球物理学报, 42(5): 640-647. |
| [85] | 王月华. 2002. 1985—1997年中国地磁场长期变化的正交模型. 地球物理学报, 45(5): 624-630. |
| [86] | 魏自刚, 徐文耀. 2005. 非偶极子磁场西向漂移的频散特征. 地球物理学报, 48(6): 1276-1281. |
| [87] | 夏国辉, 郑双良, 吴莉兰等. 1988. 1980年代中国地磁正常场图及其数学模式. 地球物理学报, 31(1): 82-89. |
| [88] | 徐如刚, 顾左文, 黎哲君等. 2014. 2005—2010年中国地磁测量与地磁场模型的应用. 地球物理学进展, 29(5): 2092-2099, doi: 10.6038/pg20140515. |
| [89] | 徐文耀, 朱岗昆. 1984. 我国及邻近地区地磁场的矩谐分析. 地球物理学报, 27(6): 511-522. |
| [90] | 徐文耀. 2003. 地磁学. 北京: 地震出版社. |
| [91] | 徐文耀, 区加明, 杜爱民. 2011. 地磁场全球建模和局域建模. 地球物理学进展, 26(2): 398-415. |
| [92] | 徐元芳, 安振昌, Golovkov P V等. 1994. 近30年来东亚地区地磁长期变化分析. 地球物理学报, 37(增刊): 287-295. |