2. 中国科学院大学地球科学学院, 北京 100049
2. College of Earth Science, University of Chinese Academy of Sciences, Beijing 100049, China
俯冲板块将地球表面的水带入地球深部,深刻地影响着地球表层和地球内部动力学过程(汪品先,2009; Faccenda,2014).俯冲板块直接进入下地幔或者平卧的滞留体坍塌进入下地幔,均可能在下地幔的温压环境中脱水(Ohtani,2005).在下地幔顶部,水可由超水相B(Mg10Si3O14(OH)4)的分解而产生(Ohtani et al.,2001);在下地幔深部,水则可由存储于俯冲板块或滞留体中的水相D(MgSi2O4(OH)2)分解而产生(Ohtani et al.,1997; Yuen et al.,2007; Faccenda,2014).前人对俯冲和滞留板块脱水研究主要侧重于板块上方的脱水作用,一般认为与大地幔楔(big mantle wedge)的成因有关(如,Stern,2012; Zhao et al.,2012; Lei et al.,2013),而对于板块下方的脱水及其影响的研究则不多见.
在西北太平洋地区,俯冲的海洋岩石圈在地幔转换带底部近水平停滞于660 km间断面(以下简称660)附近,形成了滞留板块(Fukao et al.,1992,2009).Lawrence和Wysession(2006)基于地震波衰减成像发现东亚地区660~1400 km深度存在低S波品质因子(Qμ)异常,认为与俯冲板块通过水相D分解而产生的水有关.区域地震层析成像揭示了滞留板块在中国东部及周边地区地幔转换带内是普遍存在的(Li and van der Hilst,2010),部分板块因重力不稳定性而崩塌进入下地幔(Zhao et al.,2011);在部分区域滞留板块下方存在一定的低速异常(Huang and Zhao,2006; Li et al.,2008).Tang等(2014)发现长白山火山可能源自俯冲滞留板块下方的拆沉物质.对俯冲和滞留板块脱水所对应的低速异常区域的地震学精细探测有助于深入理解相关的地球动力学过程.
基于高密度地震台网资料的三重震相分析可有效应用于地球内部地震波速精细结构探测(Tajima and Grand,1995; Song et al.,2004; Chen and Tseng,2007; Chu et al.,2012).前人利用P波或S波三重震相获得了较多东北亚地区地幔转换带的速度结构.Tajima和Grand(1995,1998)通过P波三重震相研究得出了M3.11模型,显示西北太平洋地区660下沉了30 km,其上方存在与俯冲板块相关的高速层.Wang等(2006)通过SH波研究表明东北亚地区660下沉至730 km,下沉幅度达到了70 km.Wang和Chen(2009)通过P波和SH波分析显示日本俯冲带在660之上存在与俯冲板块相关的高速异常,南千岛下方660至760 km存在可能与下地幔上升热柱有关的低速异常.Zhang等(2012)通过SH波分析得出朝鲜半岛下方660下沉约15~20 km,且在地幔转换带下部存在S波高速异常.Wang和Niu(2010)通过P波分析,提出中国东北地区660为30~70 km厚的梯度层,可能与橄榄石和石榴子石组分分解相关的多重相变有关.P波和SH波联合约束显示中国东北地区660为35 km厚的梯度层(NEChina-P、NEChina-S模型),且地幔转换带内含有约0.2~0.3 wt%的水(Ye et al.,2011; 叶玲玲和李娟,2012; Li et al.,2013).前人对西太平洋地区地幔转换带研究所得出的速度模型存在一定差异,这与因所用地震事件或台站的不同,相应的射线路径存在差异有关.
合适震级的地震可以提供相对简单的震源时间函数和足够高的信噪比;而密集且相对均匀分布的地震台可以提供高质量的地震波形资料,为研究地球深部精细结构横向变化提供数据支持.本文基于中国数字地震台网(CDSN,China Digital Seismograph Network)(郑秀芬等,2009)记录的中国东北与俄罗斯交界地区发生于2011年5月10日的Mb5.4深源地震的宽频带波形资料(图 1),利用P波三重震相方法研究了华北克拉通东部660附近的P波速度结构,并以此探讨了可能与之相关的地球动力学过程.
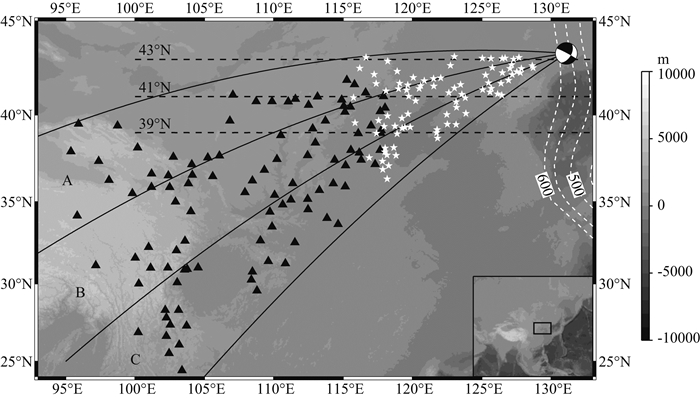 | 图 1 本文所用地震位置和台站分布图震源球标出了震中位置,黑色三角形表示地震台站,A—C为基于方位角12°间隔所划分的三个子区域.白色五角星为P波拐点在地表的投影. A子区域拐点的深度范围为553~821 km,B子区域为552~833 km,C子区域为552~845 km. 白色虚线为和达-贝尼奥夫带等深线(Gudmundsson and Sambridge,1998).黑色虚线标出了Huang和Zhao(2006)一文中3条层析成像剖面(43°N、41°N及39°N)的位置. Fig. 1 Map showing locations of earthquake(beach ball)and stations(black triangles)used in the studyA—C denote three sub-regions divided by the azimuth interval of 12°. White stars represent surface projections of P-wave turning points. Depths of turning points range 553~821 km in sub-region A,552~833 km in sub-region B and 552~845 km in sub-region C. Contours shown in white dashed lines indicate the Wadati-Benioff zone(Gudmundsson and Sambridge,1998). Black dashed lines indicate the location of three tomography profiles(43°N,41°N and 39°N)in Huang and Zhao(2006). |
地震波在经过地球内部速度间断面时,由于上下速度的跳变,地震射线会出现与间断面相关的三重震相(图 2a).660附近的三重震相包括间断面上方的回折P波(AB)、间断面上的反射P波(BC)及间断面下方的回折P波(CD).三重震相通过射线拐点1)对径向速度结构进行采样,其采样区域和拐点深度依赖于震源深度及震中距的变化(Tajima et al.,2009; 眭怡和周元泽,2015).对单个台站记录的三重震相而言,射线路径在地表浅层和岩石圈大致相同,主要路径差别集中在间断面附近,多重P波受台站下方横向不均匀性的干扰较小(Wang and Niu,2010).在一定程度上,台阵或者密集台网提供的波形资料可降低浅层横向不均匀性的影响(Tseng and Chen,2007; Zhang et al.,2012).如图 2b所示,在震中距10°~30°范围内三重震相的理论走时曲线AB、BC和CD呈回折形态,其相对到时和波形振幅变化能有效约束间断面附近的速度结构(叶玲玲和李娟,2012; 李国辉等,2014).
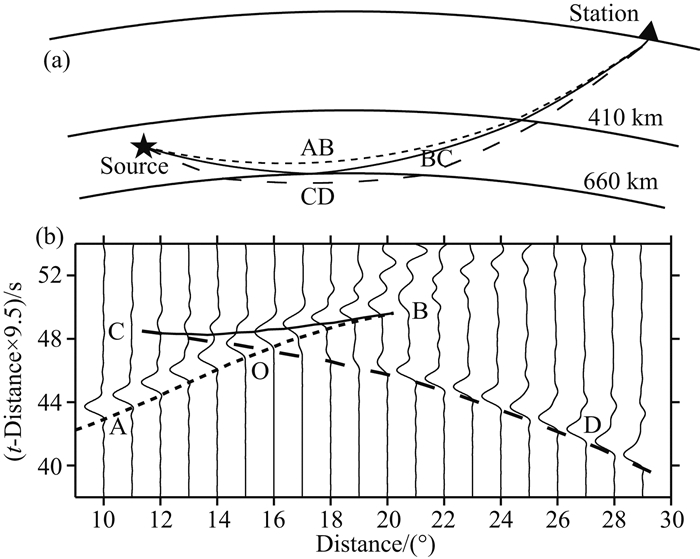 | 图 2 660附近P波三重震相的射线路径图(a)和理论走时、波形图(b) 理论模型为IASP91(Kennett and Engdahl,1991),震源深度为552.0 km.660上方的回折波(AB), 660之上的反射波(BC)及660下方的回折波(CD)分别用点线、实线和虚线表示. Fig. 2 Ray paths (a) and theoretical travel times, synthetic waveforms (b) of P-wave triplication near the 660 km discontinuity A deep source with focal depth of 552.0 km and the IASP91 model (Kennett and Engdahl,1991) are used in the calculation. The turning wave above the 660 km discontinuity (AB) (hereafter as 660), the reflection on the 660 (BC) and the turning wave below the 660 (CD) are shown in dotted, solid and dashed lines, respectively. |
1)地震射线路径的最低点定义为拐点,在拐点处射线方向是水平的且射线的入射角为90°(Shearer,2009).
本文使用动态射线追踪法(Tian et al.,2007)计算不同速度模型的理论走时曲线,并基于反射率法(Wang,1999)合成理论地震图,通过试错法(trial and error method)得到各子区域拟合效果最优的速度模型.
2.2 数据收集及处理为避免410 km间断面三重震相的干扰,本文所选地震的震源深度大于410 km,震级为Mb5.4,震源参数(表 1)引自国际地震中心目录(International Seismological Centre,2012),震源机制解引自Global CMT(Centroid-Moment-Tensor)质心矩张量解1)(Dziewonski et al.,1981; Ekström et al.,2012).
| | 表 1 地震震源参数表 Table 1 Source parameters of the earthquake |
震源深度的误差会影响三重震相走时的形态(Wang and Niu,2010),因此对震源深度需要进行重新定位或检验.国际地震中心(ISC)目录提供了基于pP震相定位的震源深度,范围为545~560 km,最新定位的深度为554.9 km.我们从美国地震学研究联合会2)获取了30°~95°震中距内的全球地震台网(GSN,Global Seismographic Network)波形资料(图 3a),手动读取震相而获得了pP-P走时差;基于IASP91(Kennett and Engdahl,1991)及CRUST 2.0模型(Bassin et al.,2000),扰动震源深度使得pP-P的理论走时差与观测走时差的均方根最小(图 3b),重定位后震源深度为552.0 km.该地震的P波信噪比较高,P波三重震相较清晰,而S波信噪比相对较低,因此本文仅采用P波三重震相进行研究.
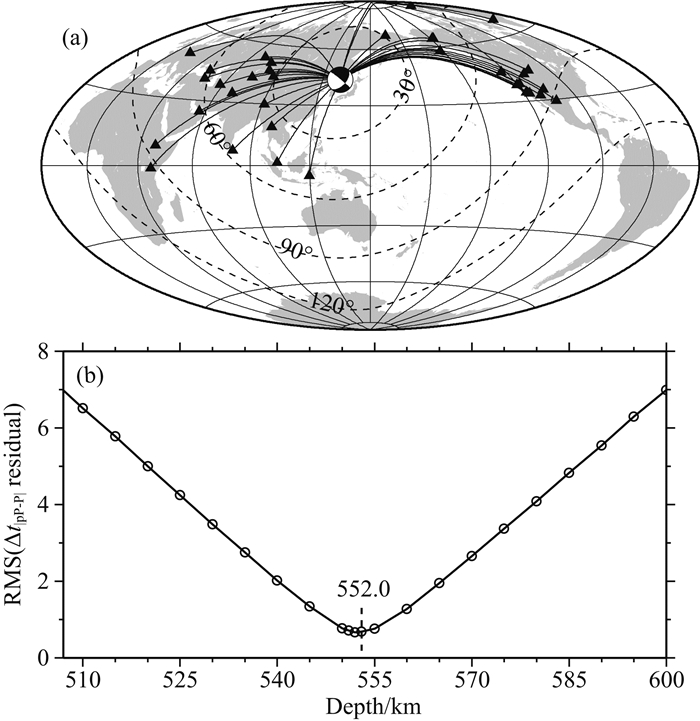 | 图 3 地震震源深度重定位 (a) 中震源球标出了震中位置,黑色三角形是重定位所用台站,黑色实线为P波射线路径在地表的投影. (b) 中X轴为震源扰动深度, Y轴为相对于IASP91模型的pP-P相对时差的残差均方根. Fig. 3 Focal depth relocation of the earthquake (a) Beach ball represents the epicenter location, black triangles represent the stations used in the relocation, and the black lines are the surface projection of P-wave ray paths. (b) X axis is the perturbation of the focal depth; Y axis is the RMS of the time residuals of pP-P relative intervals relative to the IASP91 model. |
我们对中国数字地震台网记录的原始地震资料进行了去均值、去线性趋势处理,去除仪器响应后进行0.05~1.0 Hz的带通滤波,最后将速度记录积分成为位移记录.该地震与660相关的三重震相出现在10°~30°震中距范围内,P波射线拐点的投影集中在华北克拉通东部地区(图 1),因此P波三重震相可约束其下方660附近的速度结构.为分析结构的横向变化,本文以12°的方位角间隔将台站划分为A、B和C三个子区域(图 1),各子区域的观测波形见图 4.
 | 图 4 A、B和C三个子区域观测波形图 (a)—(c)中,横轴为折合走时,纵轴为震中距;黑色实线为由IASP91模型计算的P波三重震相的走时,字母A、B、C、D和O是对各震相的标记. Fig. 4 Observed waveforms for sub-regions A, B and C X axis is the reduced travel time, and Y axis is the epicentral distance; The travel times of P-wave triplication calculated with the IASP91 are shown in black lines, and the phases are marked with the symbols A, B, C, D and O. |
基于对观测波形特征的分析(图 4),在IASP91模型基础上构建了三个改进模型进行正演测试(图 5):660上方存在一个高速层(模型Ⅰ)、660下沉至675 km(模型Ⅱ)及660下方存在低速异常(模型Ⅲ).通过改进模型与IASP91模型的走时及波形的对比,得出不同模型下P波三重震相的变化特征,并验证这些特征在观测波形中是否具备.
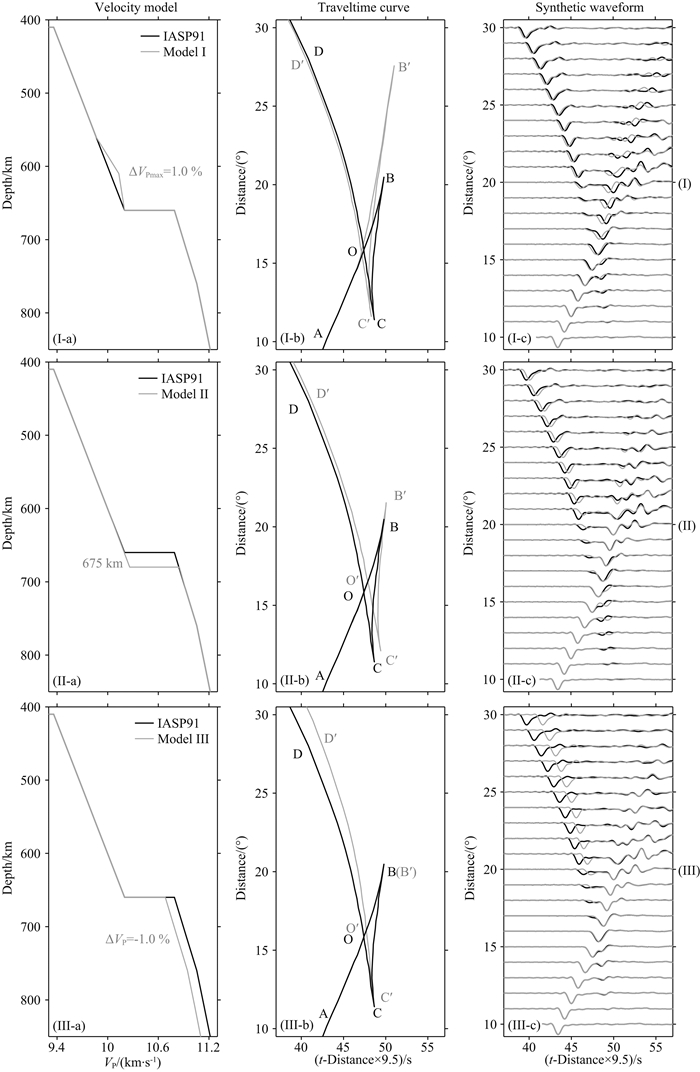 | 图 5 不同速度模型下的走时与理论波形图 模型Ⅰ:660上方存在一个高速层;模型Ⅱ:660下沉至675 km;模型Ⅲ:660下方存在低速异常.正演模拟所用的震源深度为552.0 km. Fig. 5 Travel times and synthetic seismograms for different velocity models Model Ⅰ: A high-velocity layer above the 660; Model Ⅱ: A 15 km depression of the 660; Model Ⅲ: A low-velocity anomaly below the 660. A source with the focal depth of 552.0 km is used in the forward modeling. |
图 5给出了IASP91及3个改进模型的P波走时曲线及合成波形图.对于IASP91模型而言,AB震相终止震中距(尖端B)为20.5°,CD震相起始震中距(尖端C)为11.4°,AB和CD震相在震中距15.7°相交(O点).
当660上方存在一个厚度为100 km的高速层,P波速度最大异常值为1.0%(模型Ⅰ,图 5a)时,尖端B′(27.6°)消失明显晚于尖端B,AB′震相在15.0°~27.6°震中距内斜率大于AB震相;尖端C′(11.6°)稍晚于尖端C,B′C′震相的长度明显大于BC震相;C′D′震相较CD震相提前约0.2 s,AB′与C′D′震相的相对时差小于AB与CD震相的相对时差.
当660下沉至675 km(模型Ⅱ,图 5b)时,交点O′点(16.5°)明显晚于交点O(15.7°);尖端C′(12.1°)晚于尖端C,尖端B′(21.5°)稍晚于尖端B,B′C′震相的长度稍大于BC震相;C′D′震相较CD震相延后约0.6 s;AB′与C′D′震相的相对时差小于AB与CD震相的相对时差.
当660下方存在低速异常,P波速度降低1.0%(模型Ⅲ,图 5c)时,C′D′震相的斜率较CD震相明显变小,且两震相的相对时差随震中距变大而变大;AB′与AB震相基本重合;尖端C′(12.0°)稍晚于尖端C;交点O′(16.1°)稍晚于交点O;AB′与C′D′震相的相对时差小于AB与CD震相的相对时差.
3 结果从A子区域实际观测资料可看出观测三重震相与IASP91模型的理论到时之间没有明显的系统性时间偏差(图 6a),AB′震相的斜率在13°~20°震中距内明显大于IASP91模型的理论AB震相,且尖端B′震中距(25.5°)明显大于IASP91模型的预测值(20.5°),可确定660之上存在一个高速层;交点O′(18.0°)明显大于IASP91模型的预测值(15.7°),且尖端C′震中距(13.0°)稍大于IASP91模型的预测值(11.4°),且AOC′区较AOC区呈加宽形态,这表明660可能出现了下沉;存在速度梯度的间断面可使尖端C′的震中距明显变大,观测波形中尖端C′和尖端C的震中距差较小(1.6°),预示660倾向于一速度跳跃界面.C′D′震相与IASP91模型的预测震相CD的相对时差随震中距变大而变大,且C′D′的斜率小于预测震相CD的斜率,这表明在660之下存在低速异常.通过正演试错测试,我们得到了能很好拟合观测波形的一维P波速度模型ENCC-A(图 6b和6c).该模型表明在660上方存在120 km厚的高速层,P波速度异常最大值为1.5%;660下沉至680 km;660下方存在低速异常,P波速度降低0.9%;660附近的速度跳变为4.73%,小于IASP91模型的5.8%.
 | 图 6 A子区域观测波形(a)与拟合波形(b)及速度模型图(c) (a)和(b)中的黑色和灰色实线分别是由IASP91和ENCC-A模型计算的理论走时; (c)中黑色实线为IASP91速度模型,灰色实线为ENCC-A模型. Fig. 6 Observed waveforms (a), synthetic waveforms (b) and velocity models (c) for sub-region A Black and gray lines in (a) and (b) represent the travel times calculated with the IASP91 and ENCC-A models, respectively. Black and gray lines in (c) indicate the IASP91 and ENCC-A models, respectively. |
B子区域三重震相的形态与A子区域类似(图 7a),C′D′震相与预测震相CD的相对时差较A区稍小.通过类似方法,得到了B子区域最适速度模型ENCC-B(图 7b和7c).该模型表明,660上方存在115 km厚的高速层,P波速度异常最大值为1.5%;660下沉至675 km;660下方存在低速异常,P波速度降低0.6%;660附近的速度跳变为4.93%,小于IASP91模型的5.8%.
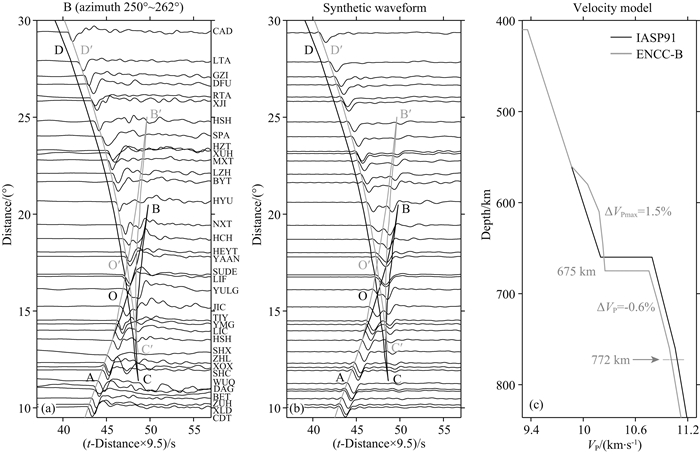 | 图 7 B子区域观测波形(a)与拟合波形(b)及速度模型图(c) (a)和(b)中的黑色和灰色实线分别是由IASP91和ENCC-B模型计算的理论走时.(c)中黑色实线为IASP91速度模型,灰色实线为ENCC-B模型. Fig. 7 Observed waveforms (a), synthetic waveforms (b) and velocity models (c) for the sub-region B Black and gray lines in (a) and (b) represent the travel times calculated with the IASP91 and ENCC-B models, respectively. Black and gray lines in (c) indicate the IASP91 and ENCC-B models, respectively. |
C子区域IASP91模型的预测震相OD与P波初至大致重合(图 8a).通过类似方法,得到了C子区域最适速度模型ENCC-C(图 8b和8c).该模型表明660上方存在120 km厚的高速层,P波速度异常最大值为2.0%;660下沉至680 km;660下方不存在低速异常;660附近的速度跳变量为5.20%,小于IASP91模型的5.8%.
 | 图 8 C子区域观测波形(a)与拟合波形(b)及速度模型图(c) (a)和(b)中的黑色和灰色实线分别是由IASP91和ENCC-C模型计算的理论走时; (c)中黑色实线为IASP91速度模型,灰色实线为ENCC-C模型. Fig. 8 Observed waveforms (a), synthetic waveforms (b) and velocity models (c) for the sub-region C Black and gray lines in (a) and (b) represent the travel times calculated with the IASP91 and ENCC-C models, respectively. Black and gray lines in (c) indicate the IASP91 and ENCC-C models, respectively. |
我们选取了A子区域最适模型ENCC-A与前人的部分研究结果作对比:M3.11模型(Tajima and Grand,1995,1998),NEChina-P模型(Ye et al.,2011; 叶玲玲和李娟,2012; Li et al.,2013)及255-270模型(Wang和Niu(2010)一文中255°~270°方位子区域的模型).由图 9a可见,ENCC-A模型与其他模型在660之上均存在高速异常,但异常的厚度和大小存在一定差异;上述模型的不同之处是ENCC-A在660之下存在低速异常.
由图 9b—9d可见,M3.11模型的AB震相明显早于观测波形,尖端B震中距达29.4°(图 9b),这可能由660上方的高速异常过大引起;OC震相稍滞后于观测P波,反映出间断面下沉幅度稍大.Li等(2013)在对P波到时分析中发现三重震相与参考模型的走时之间存在系统性偏差,而在NEChina-P模型的浅部加入了Fukao(1977)的速度结构以消除偏差,在本文的研究中未观测到系统性偏差(图 4),因此采用了与Tajima和Grand(1998)类似的方法将NEChina-P模型的走时曲线做了平移消除(图 9c).平移后的AB震相与观测波形一致性较好;该模型中660为一梯度层,尖端C(14.7°)震中距明显变大.255-270模型的AB震相滞后于观测波形(图 9d),说明该模型中660之上的高速异常偏小;相比于观测波形,CD震相起始震中距(15.9°)变大,这也与该模型中660为一梯度层有关.M3.11、NEChina-P及255-270模型所对应的OD震相与观测P波初至的相对时差随震中距变大而变大,不能很好地拟合观测波形.ENCC-A模型中660之下存在0.9%的低速异常,其对应的OD震相可大致拟合观测P波.
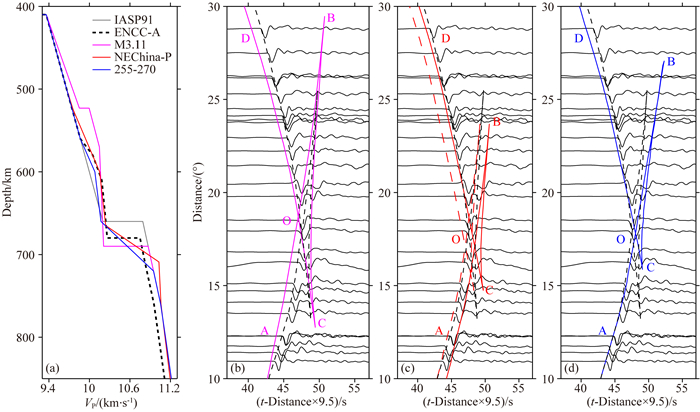 | 图 9 ENCC-A模型与前人部分速度模型的走时对比图 (a)中灰色实线为IASP91模型,黑色虚线为ENCC-A模型,紫色实线为M3.11模型,红色实线为NEChina-P模型,蓝色实线为255-270模型.(b)、(c)和(d)中黑色实线是B子区域观测波形, 黑色虚线为ENCC-A的走时曲线,紫色、红色及蓝色实线分别对应M3.11、NEChina-P、255-270模型的理论走时,红色虚线是将NEChina-P的走时向左平移1.4 s后的走时曲线. Fig. 9 Travel-time comparison of ENCC-A model and velocity models in previous work (a) IASP91, ENCC-A, M3.11, NEChina-P and 255-270 models are shown in gray, black dashed, purple, red and blue lines, respectively; (b), (c) and (d) Black lines represent the observed waveforms of sub-region B, the travel times calculated with ENCC-A, M3.11, NEChina-P and 255-270 models are shown in black dashed, purple, red and blue lines, and the red dashed line represent the travel time of NEChina-P after the left shift of 1.4 s. |
本文研究结果显示华北克拉通东部660之上存在厚度约115~120 km的高速层,P波速度升高1.5%~2.0%.根据前人三重震相的相关研究结果(140±20 km)(Tajima and Grand,1995; Wang and Niu,2010; Zhang et al.,2012; Li et al.,2013),该高速异常应为滞留的太平洋俯冲板块.所探测到的滞留板块厚度明显大于俯冲大洋板块的厚度(76~77 km)(周春银等,2010),滞留板块在地幔转换带内发生折曲(Zou et al.,2008; Tang et al.,2014)和内部变形(Schmid et al.,2002; Fukao et al.,2009)是板块增厚可能的因素.利用660 km深度附近的地幔热膨胀系数∂lnVP/∂T=-6.5×10-5 K-1(Cammarano et al.,2003),转换带内滞留板块的高速异常所引起的理论低温异常为230~300 K;利用负的克拉伯龙斜率-2.8 MPa/K(Hirose,2002)和地幔压力梯度参数35 MPa/km(Fossen,2010),理论低温异常所对应660的下沉幅度约18~24 km.本文所探测到华北克拉通东部地区660下沉约15~20 km,与理论值大致相当.冷的滞留板块导致地幔转换带出现低温环境,从而出现了660的下沉(Lebedev et al.,2002; Tang et al.,2014).
此外,模型ENCC-A和ENCC-B显示该区域660下方存在P波低速异常,P波速度降低0.6%~0.9%;ENCC-C显示660之下不存在低速异常,这表明低速异常可能是局部存在的.我们选取了Huang和Zhao(2006)一文中图 8a和图 10a,10b作为对照,分别为43°N、41°N及39°N的层析成像剖面图.43°N和41°N剖面主要穿过了A、B子区域P波射线的拐点(图 1),且均显示在滞留板块下方存在低速异常,横向经度范围约120°E—130°E,深度范围约660~1000 km,P波低速异常约0.5%~1.0%;39°N剖面主要穿过了C子区域P波射线的拐点(图 1),显示滞留板块下方不存在低速异常.由此可见,A、B子区域低速异常与层析成像结果类似,但其分布位置(115°E—128°E)偏西约2°~5°.利用A、B子区域尖端B′的震中距(25.5°,25.0°)可确定三重震相能相对准确约束的最大深度分别为777 km和772 km(图 6c和7c),径向深度探测范围相对有限.在震中距大于尖端B′之后,仅C′D′震相存在,三重震相不能较好地约束更深范围(至821~833 km)的低速异常.结合25°~35°震中距观测P波初至的变化趋势和层析成像结果(Huang and Zhao,2006),滞留板块下方的低速异常可能存在相对较深的展布.
相比于高水容量的地幔转换带(Bercovici and Karato,2003),下地幔矿物的储水能力相对较小(Murakami et al.,2002; Ohtani,2005).俯冲板块在地幔转换带底部经过相变后会变得更为致密(van Mierlo et al.,2013),超水相B分解所释放的水被压入下地幔(Ohtani et al.,2001; Yuen et al.,2007; Fukao et al.,2009);由于滞留板块在本文研究区域地幔转换带内是普遍存在的,在滞留板块下方可形成局部相对封闭的环境,而板块底部脱水所释放的水可赋存于下地幔顶部.与此同时,因坍塌进入下地幔的滞留体中水相D的分解也可能对这部分低速有贡献.本文所探测到的低速异常可能与滞留板块从其底部向下地幔顶部脱水或坍塌进入下地幔深处滞留体的脱水有关.
此前,Wang和Chen(2009)认为亚洲东北部的南千岛地区660下方的低速异常可能与下地幔上升热柱有关;本文所涉及华北克拉通东部地区的层析成像结果(Huang and Zhao,2006)显示该区域滞留板块下方的低速异常并未源于下地幔深部.因此,该低速异常可能不是下地幔深部的热源所致.Zhao等(2012)提出西太平洋板块下方的低速异常可能与板块深俯冲及部分板块碎片崩塌所引起的地幔热物质的上涌有关.如果该低速异常与热物质上涌有关,那么利用700 km深度附近的地幔热膨胀系数∂lnVP/∂T=-2.8×10-5 K-1 (Cammarano et al.,2003)换算得出高温异常约为251~323 K.关于下地幔顶部低速异常的来源或者成因,值得更进一步的研究和探讨.
需要指出,我们研究剖面上的少量台站记录与三重震相理论走时和波形拟合上存在偏差,如A子区域DCD、WUH台,B子区域HSH、YULG台等,这些可能与深部小尺度散射体的存在有关,未来在台站分布和地震事件可能的情况,可以进一步开展二维或三维波形模拟的研究.
致谢 中国地震局地球物理研究所国家数字测震台网数据备份中心(doi:10.7914/SN/CB)和美国地震学研究联合会数据管理中心为本研究提供了地震波形数据,李娟研究员和王宝善研究员提供了中国东北地区地幔转换带的研究结果,审稿人对文章提出了宝贵的修改意见和建议,在此一并表示感谢.| [1] | Bassin C, Laske G, Masters G. 2000. The current limits of resolution for surface wave tomography in North America. EOS Trans AGU, 81: F897. |
| [2] | Bercovici D, Karato S-I. 2003. Whole-mantle convection and the transition-zone water filter. Nature, 425(6953): 39-44. |
| [3] | Cammarano F, Goes S, Vacher P, et al. 2003. Inferring upper-mantle temperatures from seismic velocities. Physics of the Earth and Planetary Interiors, 138(3-4): 197-222, doi: 10.1016/S0031-9201(03)00156-0. |
| [4] | Chen W P, Tseng T L. 2007. Small 660-km seismic discontinuity beneath Tibet implies resting ground for detached lithosphere. Journal of Geophysical Research, 112(B5): B05309, doi: 10.1029/2006JB004607. |
| [5] | Chu R S, Schmandt B, Helmberger D V. 2012. Upper mantle P velocity structure beneath the Midwestern United States derived from triplicated waveforms. Geochemistry Geophysics Geosystems, 13(1): Q0AK04, doi: 10.1029/2011GC003818. |
| [6] | Dziewonski A M, Chou T A, Woodhouse J H. 1981. Determination of earthquake source parameters from waveform data for studies of global and regional seismicity. Journal of Geophysical Research, 86(B4): 2825-2852, doi: 10.1029/JB086iB04p02825. |
| [7] | Ekström G, Nettles M, Dziewoński A M. 2012. The global CMT project 2004—2010: Centroid-moment tensors for 13, 017 earthquakes. Physics of the Earth and Planetary Interiors, 200-201: 1-9, doi: 10.1016/j.pepi.2012.04.002. |
| [8] | Faccenda M. 2014. Water in the slab: A trilogy. Tectonophysics, 614: 1-30, doi: 10.1016/j.tecto.2013.12.020. |
| [9] | Fossen H. 2010. Structural Geology. New York: Cambridge University Press. |
| [10] | Fukao Y. 1977. Upper mantle P structure on the ocean side of the Japan-Kurile Arc. Geophysical Journal International, 50(3): 621-642, doi: 10.1111/j.1365-246X.1977.tb01338.x. |
| [11] | Fukao Y, Obayashi M, Inoue H, et al. 1992. Subducting slabs stagnant in the mantle transition zone. Journal of Geophysical Research, 97(B4): 4809-4822, doi: 10.1029/91jb02749. |
| [12] | Fukao Y, Obayashi M, Nakakuki T, et al. 2009. Stagnant slab: a review. Annual Review of Earth and Planetary Sciences, 37: 19-46, doi: 10.1146/annurev.earth.36.031207.124224. |
| [13] | Gudmundsson Ó, Sambridge M. 1998. A regionalized upper mantle (RUM) seismic model. Journal of Geophysical Research, 103(B4): 7121-7136, doi: 10.1029/97jb02488. |
| [14] | Hirose K. 2002. Phase transitions in pyrolitic mantle around 670-km depth: Implications for upwelling of plumes from the lower mantle. Journal of Geophysical Research, 107(B4): ECV 3-1-ECV 3-13, doi: 10.1029/2001JB000597. |
| [15] | Huang J L, Zhao D P. 2006. High-resolution mantle tomography of China and surrounding regions. Journal of Geophysical Research, 111(B9): B09305, doi: 10.1029/2005JB004066. |
| [16] | International Seismological Centre. 2012. On-line Bulletin. http://www.isc.ac.uk, Internatl. Seis. Cent., Thatcham, United Kingdom. |
| [17] | Kennett B L N, Engdahl E R. 1991. Traveltimes for global earthquake location and phase identification. Geophysical Journal International, 105(2): 429-465, doi: 10.1111/j.1365-246X.1991.tb06724.x. |
| [18] | Lawrence J F, Wysession M E. 2006. Seismic evidence for subduction-transported water in the lower mantle.// Earth's Deep Water Cycle. American Geophysical Union, 251-261. |
| [19] | Lebedev S, Chevrot S, van der Hilst R D. 2002. Seismic evidence for olivine phase changes at the 410- and 660-kilometer discontinuities. Science, 296(5571): 1300-1302, doi: 10.1126/science.1069407. |
| [20] | Lei J S, Xie F R, Fan Q C, et al. 2013. Seismic imaging of the deep structure under the Chinese volcanoes: An overview. Physics of the Earth and Planetary Interiors, 224: 104-123, doi: 10.1016/j.pepi.2013.08.008. |
| [21] | Li C, van der Hilst R D, Engdahl E R, et al. 2008. A new global model for P wave speed variations in Earth's mantle. Geochemistry Geophysics Geosystems, 9(5): Q05018, doi: 10.1029/2007GC001806. |
| [22] | Li C, van der Hilst R D. 2010. Structure of the upper mantle and transition zone beneath Southeast Asia from traveltime tomography. Journal of Geophysical Research, 115(B7): B07308, doi: 10.1029/2009JB006882. |
| [23] | Li G H, Sui Y, Zhou Y Z. 2014. Low-velocity layer atop the mantle transition zone in the lower Yangtze Craton from P waveform triplication. Chinese Journal of Geophysics (in Chinese), 57(7): 2362-2371, doi: 10.6038/cig20140730. |
| [24] | Li J, Wang X, Wang X J, et al. 2013. P and SH velocity structure in the upper mantle beneath Northeast China: Evidence for a stagnant slab in hydrous mantle transition zone. Earth and Planetary Science Letters, 367: 71-81, doi: 10.1016/j.epsl.2013.02.026. |
| [25] | Murakami M, Hirose K, Yurimoto H, et al. 2002. Water in Earth's lower mantle. Science, 295(5561): 1885-1887, doi: 10.1126/science.1065998. |
| [26] | Ohtani E, Mizobata H, Kudoh Y, et al. 1997. A new hydrous silicate, a water reservoir, in the upper part of the lower mantle. Geophysical Research Letters, 24(9): 1047-1050, doi: 10.1029/97gl00874. |
| [27] | Ohtani E, Toma M, Litasov K, et al. 2001. Stability of dense hydrous magnesium silicate phases and water storage capacity in the transition zone and lower mantle. Physics of the Earth and Planetary Interiors, 124(1-2): 105-117, doi: 10.1016/S0031-9201(01)00192-3. |
| [28] | Ohtani E. 2005. Water in the mantle. Elements, 1(1): 25-30, doi: 10.2113/gselements.1.1.25. |
| [29] | Schmid C, Goes S, van der Lee S, et al. 2002. Fate of the Cenozoic Farallon slab from a comparison of kinematic thermal modeling with tomographic images. Earth and Planetary Science Letters, 204(1-2): 17-32, doi: 10.1016/S0012-821X(02)00985-8. |
| [30] | Shearer P M. 2009. Introduction to Seismology. 2nd ed. Cambridge: Cambridge University Press, 67-68. |
| [31] | Song T-R A, Helmberger D V, Grand S P. 2004. Low-velocity zone atop the 410-km seismic discontinuity in the northwestern United States. Nature, 427(6974): 530-533. |
| [32] | Stern R J. 2002. Subduction zones. Reviews of Geophysics, 40(4): 3-1-3-38, doi: 10.1029/2001RG000108. |
| [33] | Sui Y, Zhou Y Z. 2015. Low-velocity anomaly around 410 km beneath the Yellow and East China Seas with P wave triplications. Acta Seismologica Sinica (in Chinese), 37(1): 1-14, doi: 10.11939/jass.2015.01.001. |
| [34] | Tajima F, Grand S P. 1995. Evidence of high velocity anomalies in the transition zone associated with Southern Kurile Subduction Zone. Geophysical Research Letters, 22(23): 3139-3142, doi: 10.1029/95GL03314. |
| [35] | Tajima F, Grand S P. 1998. Variation of transition zone high-velocity anomalies and depression of 660 km discontinuity associated with subduction zones from the southern Kuriles to Izu-Bonin and Ryukyu. Journal of Geophysical Research, 103(B7): 15015-15036, doi: 10.1029/98JB00752. |
| [36] | Tajima F, Katayama I, Nakagawa T. 2009. Variable seismic structure near the 660 km discontinuity associated with stagnant slabs and geochemical implications. Physics of the Earth and Planetary Interiors, 172(3-4): 183-198, doi: 10.1016/j.pepi.2008.09.013. |
| [37] | Tang Y C, Obayashi M, Niu F L, et al. 2014. Changbaishan volcanism in northeast China linked to subduction-induced mantle upwelling. Nature Geoscience, 7(6): 470-475, doi: 10.1038/ngeo2166. |
| [38] | Tian Y, Hung S-H, Nolet G, et al. 2007. Dynamic ray tracing and traveltime corrections for global seismic tomography. Journal of Computational Physics, 226(1): 672-687, doi: 10.1016/j.jcp.2007.04.025. |
| [39] | van Mierlo W L, Langenhorst F, Frost D J, et al. 2013. Stagnation of subducting slabs in the transition zone due to slow diffusion in majoritic garnet. Nature Geoscience, 6(5): 400-403, doi: 10.1038/ngeo1772. |
| [40] | Wang B S, Niu F L. 2010. A broad 660 km discontinuity beneath northeast China revealed by dense regional seismic networks in China. Journal of Geophysical Research, 115(B6): B06308, doi: 10.1029/2009JB006608. |
| [41] | Wang P X. 2009. Interactions between Earth's deep and surface. Advances in Earth Science, 24(12): 1331-1338, doi: 10.11867/j.issn.1001-8166.2009.12.1331. |
| [42] | Wang R J. 1999. A simple orthonormalization method for stable and efficient computation of Green's functions. Bulletin of the Seismological Society of America, 89(3): 733-741. |
| [43] | Wang T, Chen L. 2009. Distinct velocity variations around the base of the upper mantle beneath northeast Asia. Physics of the Earth and Planetary Interiors, 172(3-4): 241-256, doi: 10.1016/j.pepi.2008.09.021. |
| [44] | Wang Y, Wen L X, Weidner D, et al. 2006. SH-velocity and compositional models near the 660-km discontinuity beneath South America and northeast Asia. Journal of Geophysical Research, 111(B7): B07305, doi: 10.1029/2005JB003849. |
| [45] | Ye L L, Li J, Tseng T L, et al. 2011. A stagnant slab in a water-bearing mantle transition zone beneath northeast China: implications from regional SH waveform modelling. Geophysical Journal International, 186(2): 706-710, doi: 10.1111/j.1365-246X.2011.05063.x. |
| [46] | Ye L L, Li J. 2012. Detecting velocity structure around 660-km discontinuity beneath Northeastern China. Acta Seismologica Sinica (in Chinese), 34(2): 137-146. |
| [47] | Yuen D A, Karato S-I, Maruyama S, et al. 2007. Superplumes: Beyond Plate Tectonics. Netherlands: Springer. |
| [48] | Zhang R Q, Wu Q J, Li Y H, et al. 2012. Lateral variations in SH velocity structure of the transition zone beneath Korea and adjacent regions. Journal of Geophysical Research, 117(B9): B09315, doi: 10.1029/2011jb008900. |
| [49] | Zhao D P, Yu S, Ohtani E. 2011. East Asia: Seismotectonics, magmatism and mantle dynamics. Journal of Asian Earth Sciences, 40(3): 689-709, doi: 10.1016/j.jseaes.2010.11.013. |
| [50] | Zhao D P, Yanada T, Hasegawa A, et al. 2012. Imaging the subducting slabs and mantle upwelling under the Japan Islands. Geophysical Journal International, 190(2): 816-828, doi: 10.1111/j.1365-246X.2012.05550.x. |
| [51] | Zheng X F, Ouyang B, Zhang D N, et al. 2009. Technical system construction of Data Backup Centre for China Seismograph Network and the data support to researches on the Wenchuan earthquake. Chinese Journal of Geophysics (in Chinese), 52(5): 1412-1417, doi:10.3969/j.issn.0001-5733.2009.05.031. |
| [52] | Zhou C Y, Jin Z M, Zhang J F. 2010. Mantle transition zone: An important field in the studies of Earth's deep interior. Earth Science Frontiers (in Chinese), 17(3): 90-113. |
| [53] | Zou H B, Fan Q C, Yao Y P. 2008. U-Th systematics of dispersed young volcanoes in NE China: Asthenosphere upwelling caused by piling up and upward thickening of stagnant Pacific slab. Chemical Geology, 255(1-2): 134-142, doi: 10.1016/j.chemgeo.2008.06.022. |
| [54] | 李国辉, 眭怡, 周元泽. 2014. 基于P波三重震相的下扬子克拉通地幔转换带顶部低速层初探. 地球物理学报, 57(7): 2362-2371, doi: 10.6038/cig20140730. |
| [55] | 眭怡, 周元泽. 2015. 利用三重震相探测中国东部海域410 km深度低速层. 地震学报, 37(1):1-14, doi: 10.11939/jass.2015.01.001. |
| [56] | 汪品先. 2009. 地球深部与表层的相互作用. 地球科学进展, 24(12):1331-1338, doi: 10.11867/j.issn.1001-8166.2009.12.1331. |
| [57] | 叶玲玲, 李娟. 2012. 东北地区660 km间断面附近波速结构研究. 地震学报, 34(2):137-146. |
| [58] | 郑秀芬, 欧阳飚, 张东宁等. 2009. "国家数字测震台网数据备份中心"技术系统建设及其对汶川大地震研究的数据支撑. 地球物理学报, 52(5): 1412-1417, doi:10.3969/j.issn.0001-5733.2009.05.031. |
| [59] | 周春银, 金振民, 章军锋. 2010. 地幔转换带: 地球深部研究的重要方向. 地学前缘, 17(3):90-113. |
 2016, Vol. 59


