2. 地球内部多尺度成像湖北省重点实验室, 武汉 430074;
3. 中国地质大学资源学院, 武汉 430074
2. Hubei Subsurface Multi-scale Imaging Key Laboratory, Wuhan 430074, China;
3. Faculty of Earth Resources, China University of Geosciences, Wuhan 430074, China
The results show that the crust-mantle structure in northeastern Tibetan plateau is different from that of the peripheral areas. The Sichuan basin,the Ordos basin and the Qilian block have homogeneous and rigid crust-mantle structure on the whole. While the crust-mantle materials in the Tibetan plateau are heterogeneous and plastic,where gravity anomalies strike dominantly in EW and SSE. It is inferred that the lithosphere materials extrude towards east in the interior of the Tibetan plateau,and then turn to south due to resistance of the Yangtze and the North China platforms in the margin of the plateau. The image of the crust thickness indicates that the northeastern Tibetan plateau gradually thins from west to east. However,there is no trace of "mountain roots" under the peripheral orogenic belts. Instead,the Moho below these areas uplifts. Combined with the low gravity anomalies,this study suggests that the upwelling mantle heat-flow interacts with the substances in upmost mantle and lower crust,uplifting the Moho or forming the new shallow Moho.
We infer that under the influence of the northward motion of the Indian plate,thermal activity may have occurred in the Qiangtang block lithosphere,and then induced thermal mantle flow. This mantle flow shifts toward east along the asthenospheric channel. Due to the obstruction of the rigid lithosphere in the Yangtze platform and the North China platform, the mantle flow is forced to rise up in the western Qinling-Songpan tectonic node. The uplift of the Longmen Shan and the western Qinling as well as the generation mechanism of earthquakes in the western Sichuan and Gansu province may be all related to this dynamic process.
自70—50 Ma以来,印度板块向北与欧亚板块持续强烈碰撞,至少有1360 km的南北向缩短的物质被吸收(Yin and Harrison,2000),物质的积累导致了青藏高原的隆升(Molnar and Tapponnier,1975;Engl and and Houseman,1986),形成了全球海拔最高的独特地域单元.青藏高原发育有厚达60~80 km 的地壳(高锐等,2009),由于其构造的复杂性,碰撞过程的吸收机制与地壳增厚的方式也存在多种解释.在高原腹地,一系列的俯冲、逆冲带可以很好地对应地壳缩短增厚模型.而在边缘造山带,一系列走滑断裂的存在则与大陆块体侧向挤出模型一致(Tapponnier et al.,2001);中下地壳显示低速高导的性质又为地壳流模型提供了依据(Royden et al.,1997;Clark and Royden,2000;Bai et al.,2010).作为印度欧亚板块碰撞作用由南北向东西转换的重要场所,青藏高原东北部(图 1)具有与一般线性造山带不同的造山极性及构造体制(许志琴等,1992).特别是西秦岭—松潘大陆构造结属中国大陆完成其主体拼合过程中形成的地壳尺度上的巨型构造,是青藏高原与周围稳定地体交接转换的关键构造域(张国伟等,2004).以往的地球物理深部探测在该区做了很多研究,包括人工反射地震(Liu et al.,2006;嘉世旭和张先康,2008;Zhang et al.,2011,2013;Gao et al.,2014)、天然地震(Vergne et al.,2003;薛光琦等,2003;Li et al.,2011,2014;Pan and Niu,2011;Tian and Zhang,2013)、大地电磁测深(赵国泽等,2004;Xiao et al.,2013)、GPS形变监测(Zhang et al.,2004;He et al.,2013)等,获得了青藏高原东北部岩石圈的速度结构、泊松比分布、SKS剪切波分裂、电性结构以及水平和垂直位移分量等重要地球物理参数,并且对壳幔中的低速高导层及动力学模式进行了一系列的探讨.由于受复杂的高原环境影响,上述研究多集中于沿特定地质构造方向的二维剖面测量或者是点距较大的固定台站,这 对于研究大尺度的区域地质构造稍显不足.重力方 面,前人分析了研究区的断裂体系、变形特征等,取得了许多成果(Zhang et al.,2010;孟小红等,2012;陈石等,2013).然而高原的地面重力观测数据分布不均且十分有限,上述多集中于将龙门山造山带、西秦岭造山带、青藏高原东北缘分隔开来单独研究.事实上,受印度板块向欧亚板块俯冲远程效应的影响,龙门山与西秦岭的隆升时限及所处的构造环境有诸多相似性,将其统一到青藏高原东北部向四川盆地、鄂尔多斯盆地周边扩展的动力学背景下,可进一步查明青藏高原东北部隆升变形机制以及川陕甘强震区的孕震构造机理.
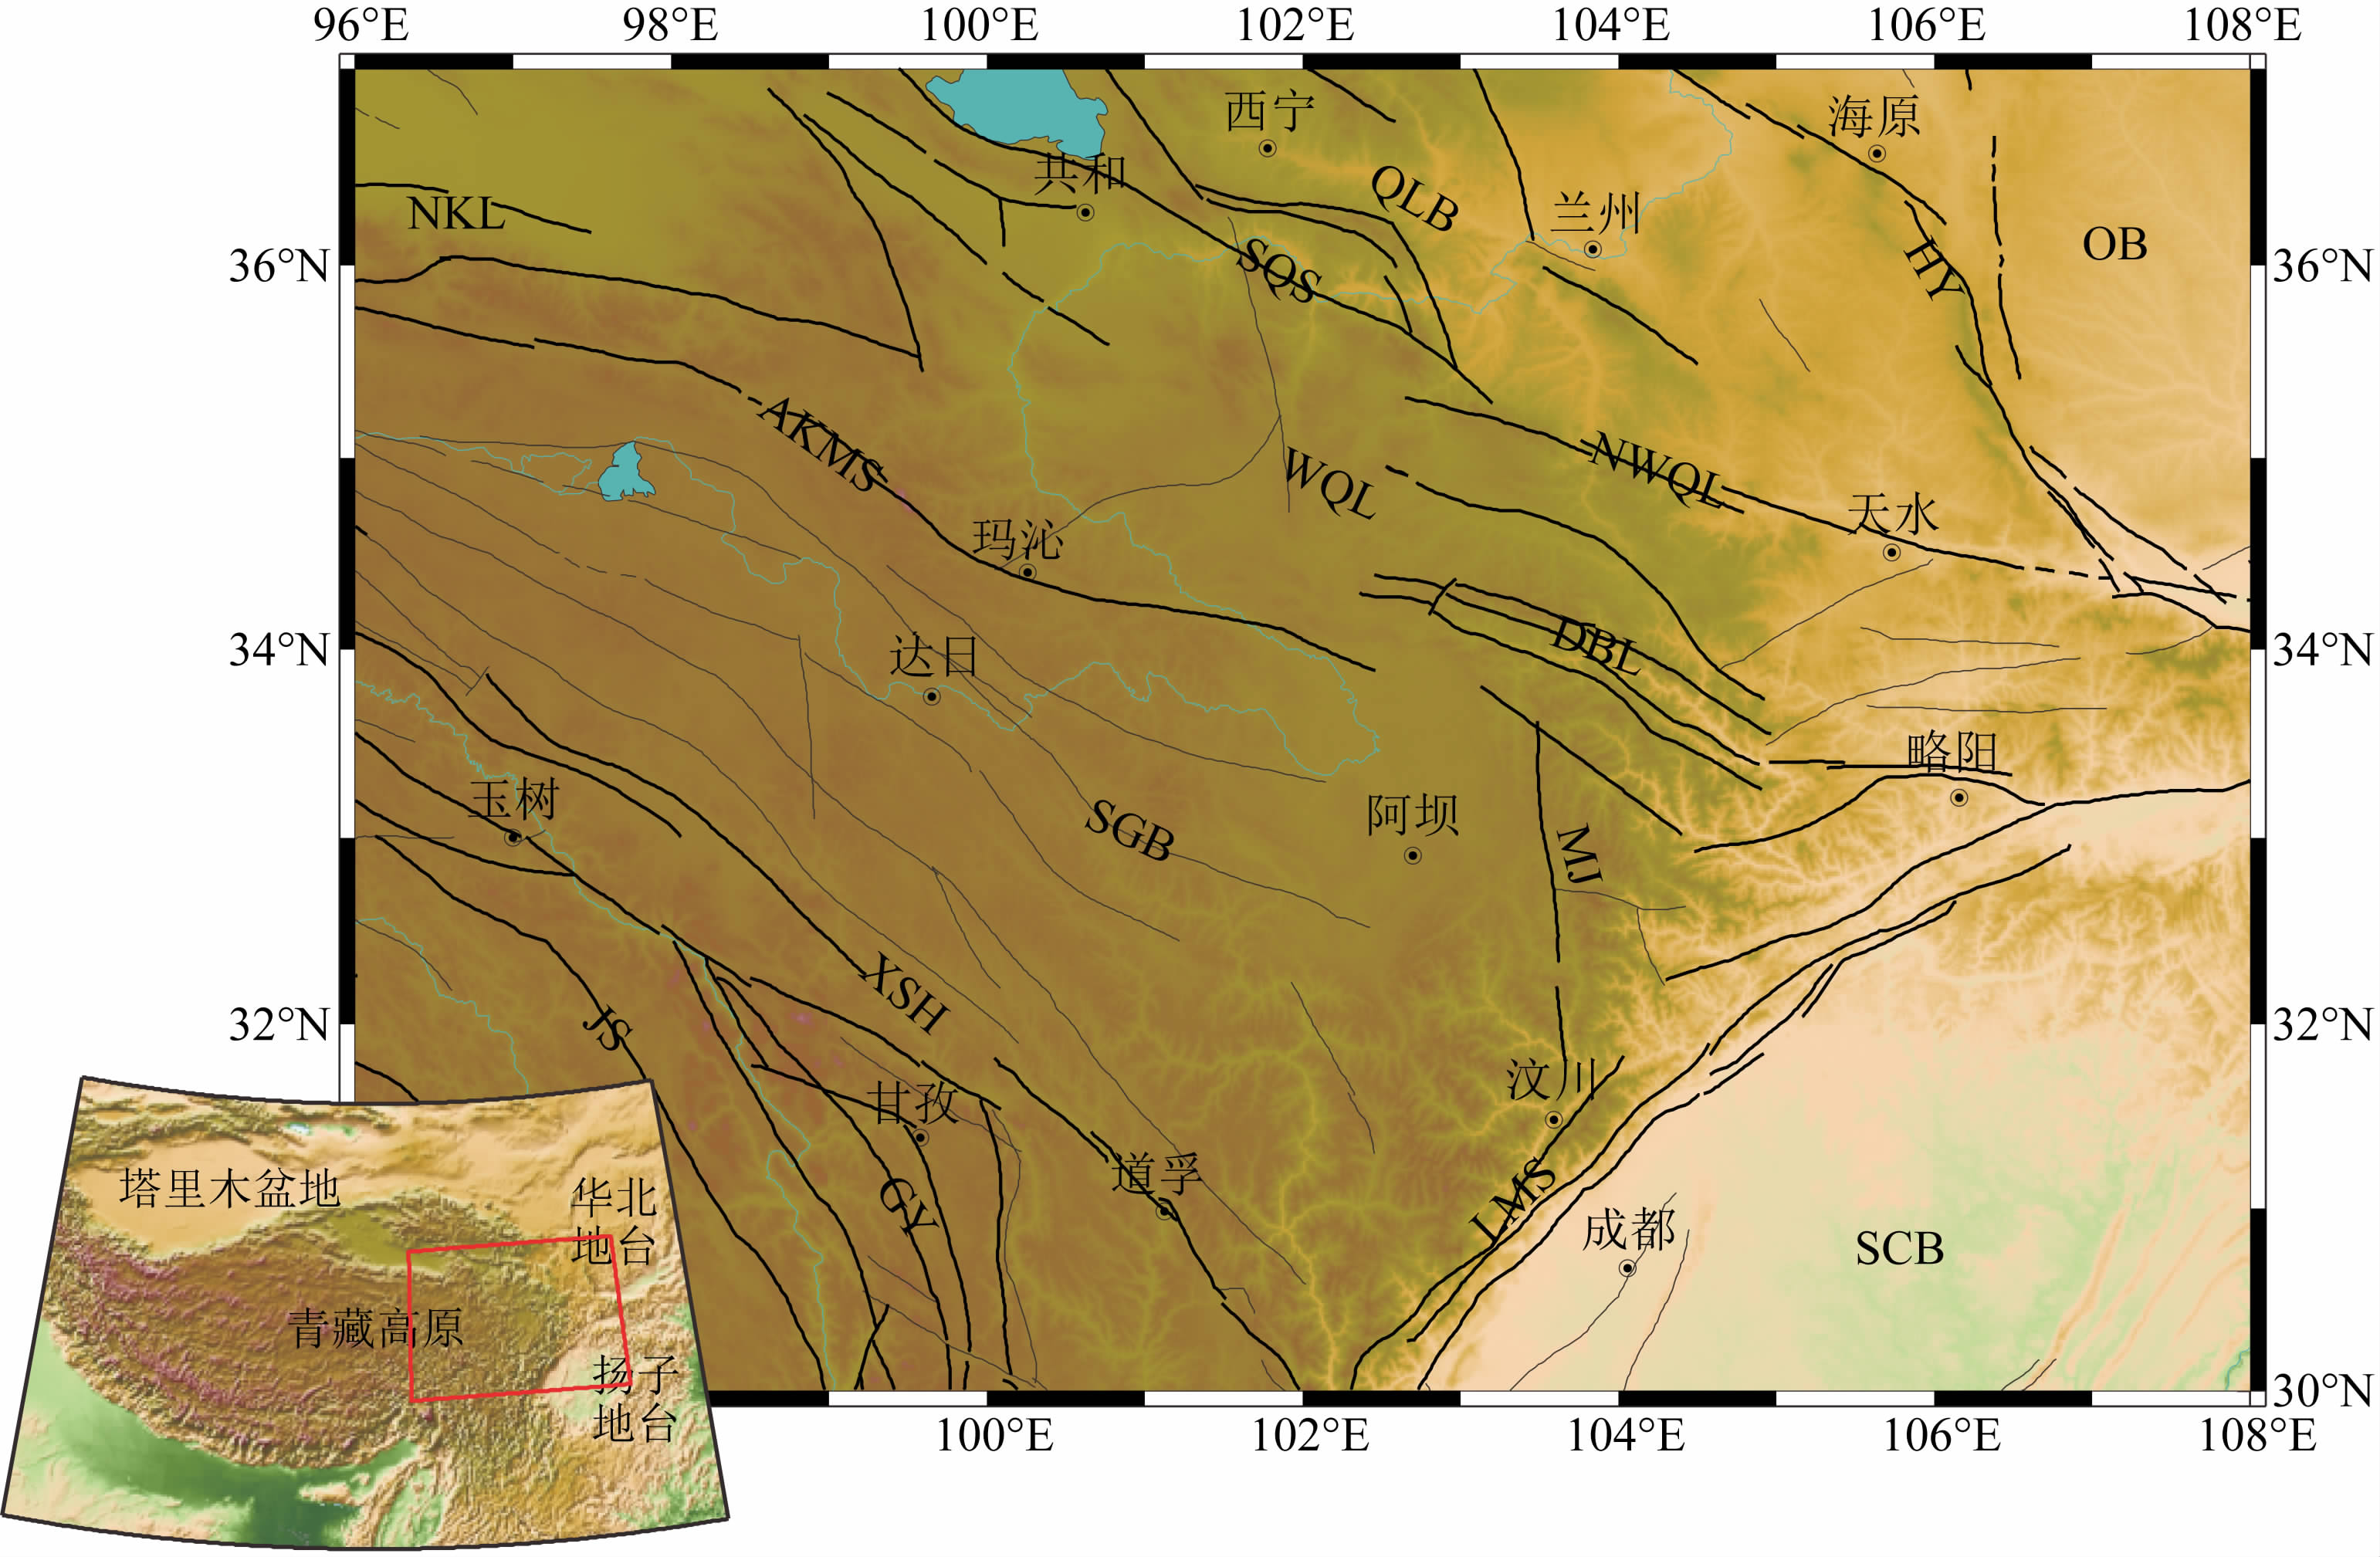 |
图 1 青藏高原东北部大地构造轮廓图 左下图红色图框为研究区位置.图中黑色实线为文中涉及的断裂,灰色细线为本文忽略断裂.断裂数据源自邓起东等(2002);SCB:四川盆地;SGB:松潘—甘孜地块;WQL:西秦岭造山带;QLB:祁连山地块;OB:鄂尔多斯盆地;JS:金沙江缝合带;AKMS:阿尼玛卿—昆仑—木 孜塔格缝合带;SQS:南祁连缝合带;GY:甘孜—玉树断裂;XSH:鲜水河断裂;LMS:龙门山断裂;MJ:岷江断裂;DBL:迭部—略阳断裂; NWQL:西秦岭北缘断裂;NKL:北昆仑断裂;HY:海原断裂. Fig. 1 Outline map of the northeastern Tibetan plateau and the surrounding area The study region marked by the red frame in the below left map. The black solid lines represent faults involved, and the gray filaments represent faults omitted. Faults data depicted after Deng et al.(2002); SCB: Sichuan basin; SGB: Songpan-Garzê block; WQL: West Qinling Orogenic belt; QLB: Qilian block; OB: Ordos basin; JS: Jinsha River suture; AKMS: A′nyêmaqên-Kunlun-Muztag suture; SQS: South Qilian suture; GY: Garzê-Yushu fault; XSH: Xianshui River fault; LMS: Longmen Shan fault; MJ: Minjiang fault; DBL: Diebu-Lueyang fault; NWQL: Northern edge of the Western Qinling fault; NKL: North Kunlun fault; HY: Haiyuan fault. |
随着卫星技术的发展,快速高精度测量全球重力场成为可能,继而建立了各种高分辨率的重力场模型.EGM2008(Earth Gravitational Model 2008)是近年来应用较为广泛的全球超高阶地球重力场模 型(Pavlis et al.,2008),它的球谐展开阶次为2160,空间分辨率约为5′(9 km). 其构建过程是用GRACE卫星数据建立前60阶球谐系数,加上EGM96重力模型的61~360阶球谐系数,再加上剩余地形重力模型的361~2160阶球谐系数计算得到的地球重力异常.与实测地面重力数据相比,EGM2008模型数据在青藏高原东北部的误差约为11.6 mGal(章传银等,2009),其异常的变化趋势上大体一致(付广裕等,2013).值得说明的是,青藏高原地面重力点位分布不均,其反映的异常信息远不如模型,地球重力模型网格数据的精度被低估了(杨金玉等,2012).
为了能从宏观上整体反映研究区深部构造特征,本文基于EGM2008模型的自由空气重力异常数据,研究青藏高原东北部不同尺度的重力场分布,推测横纵向地壳上地幔的物质成分及构造特征,进而探讨其动力学涵义.
2 青藏高原东北部及周缘地区重力异常图 2显示了青藏高原东北部及周缘地区自由空 气重力异常,可以看出,其形态与地形图相似.在山脉分布的高地势地区显示正异常,尤其是在剧烈切割的高山峡谷地区,由于山体形态复杂,受密度不均匀地质体的影响,自由空气重力异常特征变得十分复杂;而盆地中因在近地表分布有中、新生界的低密度地层,因而呈现负值,负异常的幅值和形态与盆地内沉积层的厚薄和分布呈正相关关系.四川盆地和鄂尔多斯盆地显示弱的负异常,变化较为平缓,表明地质构造比较稳定,负异常也说明盆地在均衡补偿过程中质量亏损.高原腹地的正异常走向由EW向向东转为SE向,幅值在0~100 mGal内变化,而在边缘造山带异常值在100~200 mGal之间,龙门山断裂带附近达到最大300 mGal.印度大陆持续向北推挤造成了青藏高原的抬升,形成高的地势,正是由于高原内部软流圈流体受到了地形对岩石圈的垂向重力均衡作用,侧向流动,遇到扬子刚性地块的阻挡,在龙门山断裂带附近积累大量物质,因而形成了强烈的正异常带.
 | 图 2 研究区自由空气重力异常图 Fig. 2 Free air gravity anomaly map of the study region |
在自由空气重力数据的基础上结合ETOPO1数据地形改正后,获得了整个研究区的布格重力异常分布(见图 3).由图可见,研究区内布格重力异常以负值为主,范围在50~-500 mGal之间,自东向西逐渐衰减.青藏高原布格重力异常在-300 mGal以下,而四川盆地、鄂尔多斯盆地在-100 mGal以上.在西宁—汶川一线有一条明显的重力梯度带,特别是梯度带南部龙门山断裂带附近,由西向东重力值剧烈递增,在不到100 km范围内重力值增加了100 mGal;而梯度带北段则相对平缓得多,西宁—兰州—海原一线地区呈现出过渡带的性质.
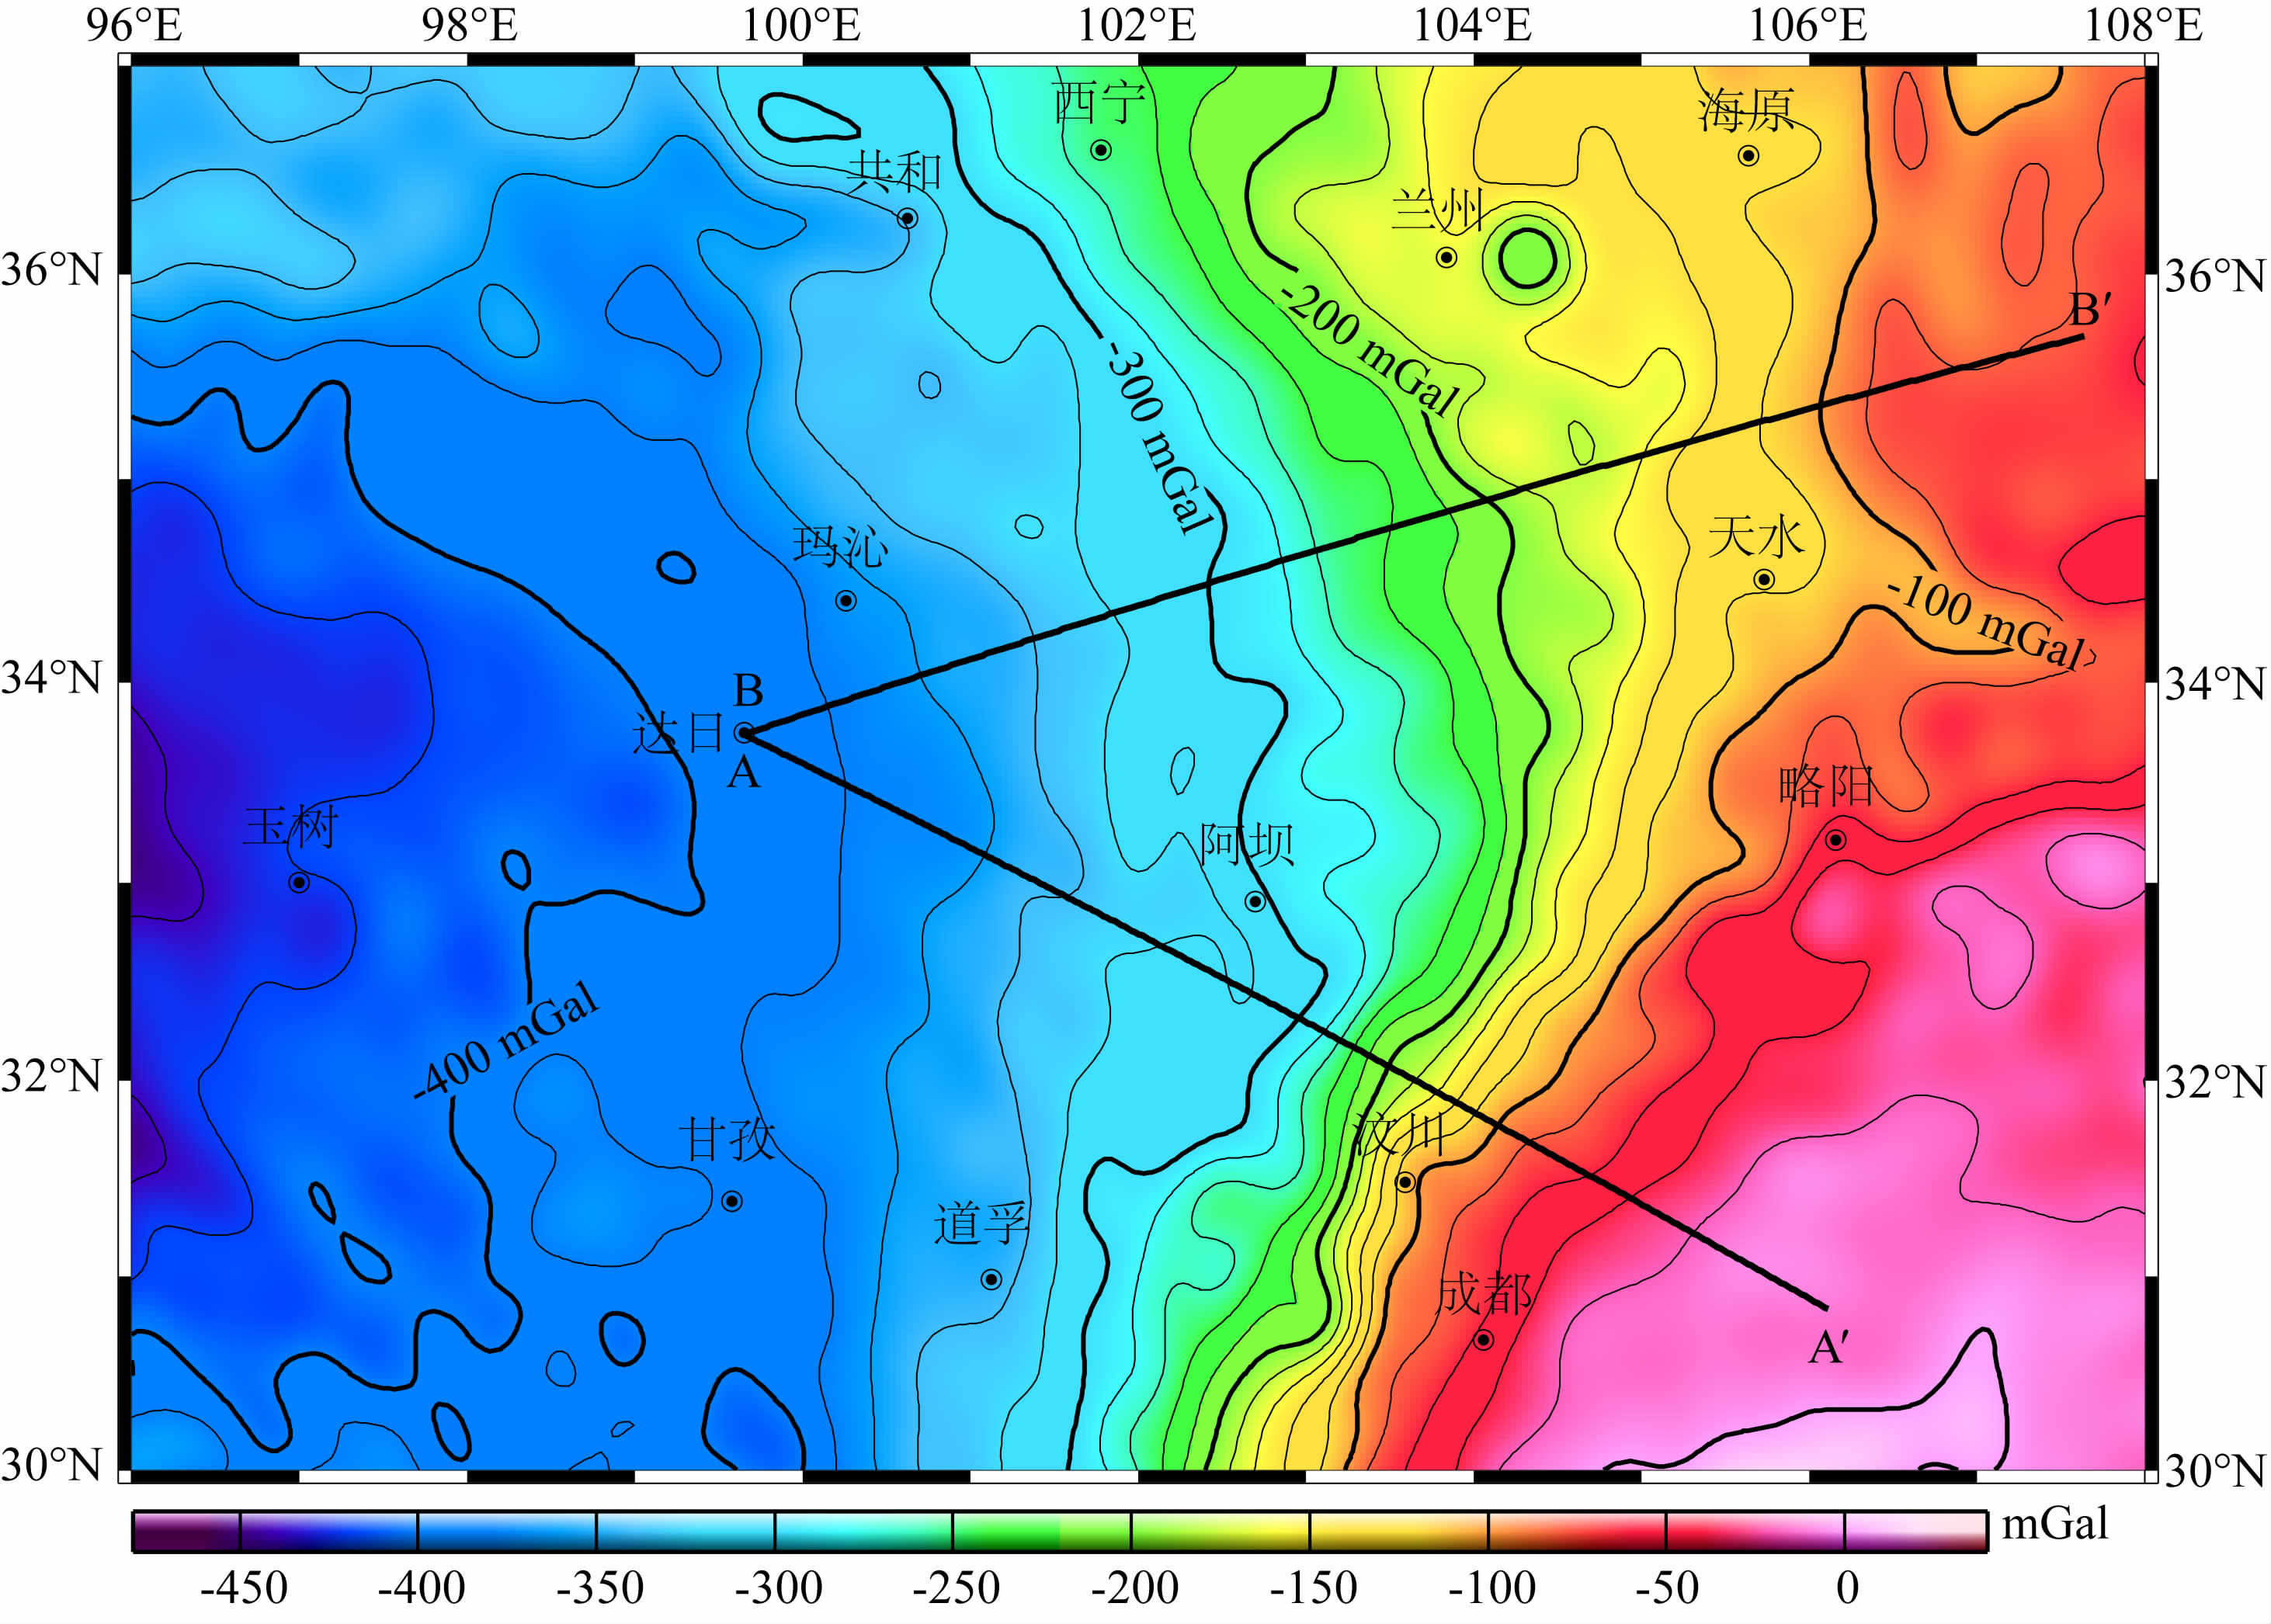 |
图 3 研究区布格重力异常图 A-A′和B-B′两条实线代表二维密度模型剖面切割的位置. Fig. 3 Bouguer gravity anomaly map of the study region Solid lines (A-A′ and B-B′) represent the location of density modeling profiles. |
重力异常反映的是地表下不同深度、不同规模、不同密度的地质体对应的重力异常叠加效应.小波多尺度分析方法是将信号分解成各种不同频率成分,并且聚焦到任意细节上加以分析(Mallat,1989;侯遵泽和杨文采,1997).为了得到目的地质体对应的重力特征,可以利用小波多尺度分析的方法分离出反映其横向、纵向上不同尺度地质体产生的重力异常场(Jiang et al.,2012;孟小红等,2012).本文通 过对EGM2008模型的布格重力异常应用Daubechies(db3)小波提取各个尺度的重力场细节信息;对于分解后的异常,应用功率谱分析的原理计算其径向对数功率谱,估计每一阶异常的场源深度,所得结果见表 1.1阶和2阶细节异常反映的是近地表的密度变化,在此不予讨论.
| | 表 1 功率谱估计的1阶~6阶细节异常的场源似深度 Table 1 Approximated source depths of the 1st to 6th order detailed images calculated from the power spectrum |
3阶和4阶细节异常图(图 4a、4b)反映了研究区上地壳的布格重力异常特征.四川盆地和鄂尔多斯盆地分别处于扬子地台和华北地台,构造稳定,其 基底之上覆盖巨厚的中新生代沉积物,因此显示出均匀的弱异常特征.松潘—甘孜地块中部巴颜喀拉、可可西里地区广泛分布三叠纪复理石沉积,厚度多在10 km以上,由于后期构造活动强烈,基底褶皱变形使沉积物重新改造,其重力异常形态表现为略微杂乱的弱异常的特征.与高原腹地相比,边缘地区的异常形态更加复杂.阿尼玛卿—昆仑—木孜塔格缝合带(AKMS)作为东古特提斯洋在晚古生代向北俯冲闭合的场所(Zhu and Helmberger,1998),东西绵延近1500 km,在异常图上显示其东段为负的线性异常,一直延伸到玛沁断裂以东.松潘—甘孜地块东缘及东南缘则表现出一系列正负相伴的条带异常.东缘是青藏高原向东运动与扬子地台碰撞的场所,其杂乱无序的异常方向体现了物质受挤压褶皱变形或破碎的特征,而四川盆地受到强烈的挤压其重力异常形态依然稳定,显示出刚性块体的特征.松潘甘孜东南缘接近于喜马拉雅东构造结,是青藏高原物质流向东南方向转折的场所,其不仅在地形上表现为强烈的褶皱变形、地壳缩短以及一系列走滑断层,在重力异常图上亦显现SSE向和SN向的串珠状异常,负异常可能是岩石挤压破碎的反映,而正异常则可能是由于岩浆岩沿破碎带侵入形成的.鲜水河断裂带一直被认为是现今东亚大陆最活跃的断 裂带之一,其包括甘孜—玉树(GY)、鲜水河(XSH)、 小江、则木河和安宁河等次级断裂.在3阶和4阶图上,鲜水河断裂和甘孜—玉树断裂表现为连续的SE和SSE向的负异常条带,并且两侧伴有正异常.
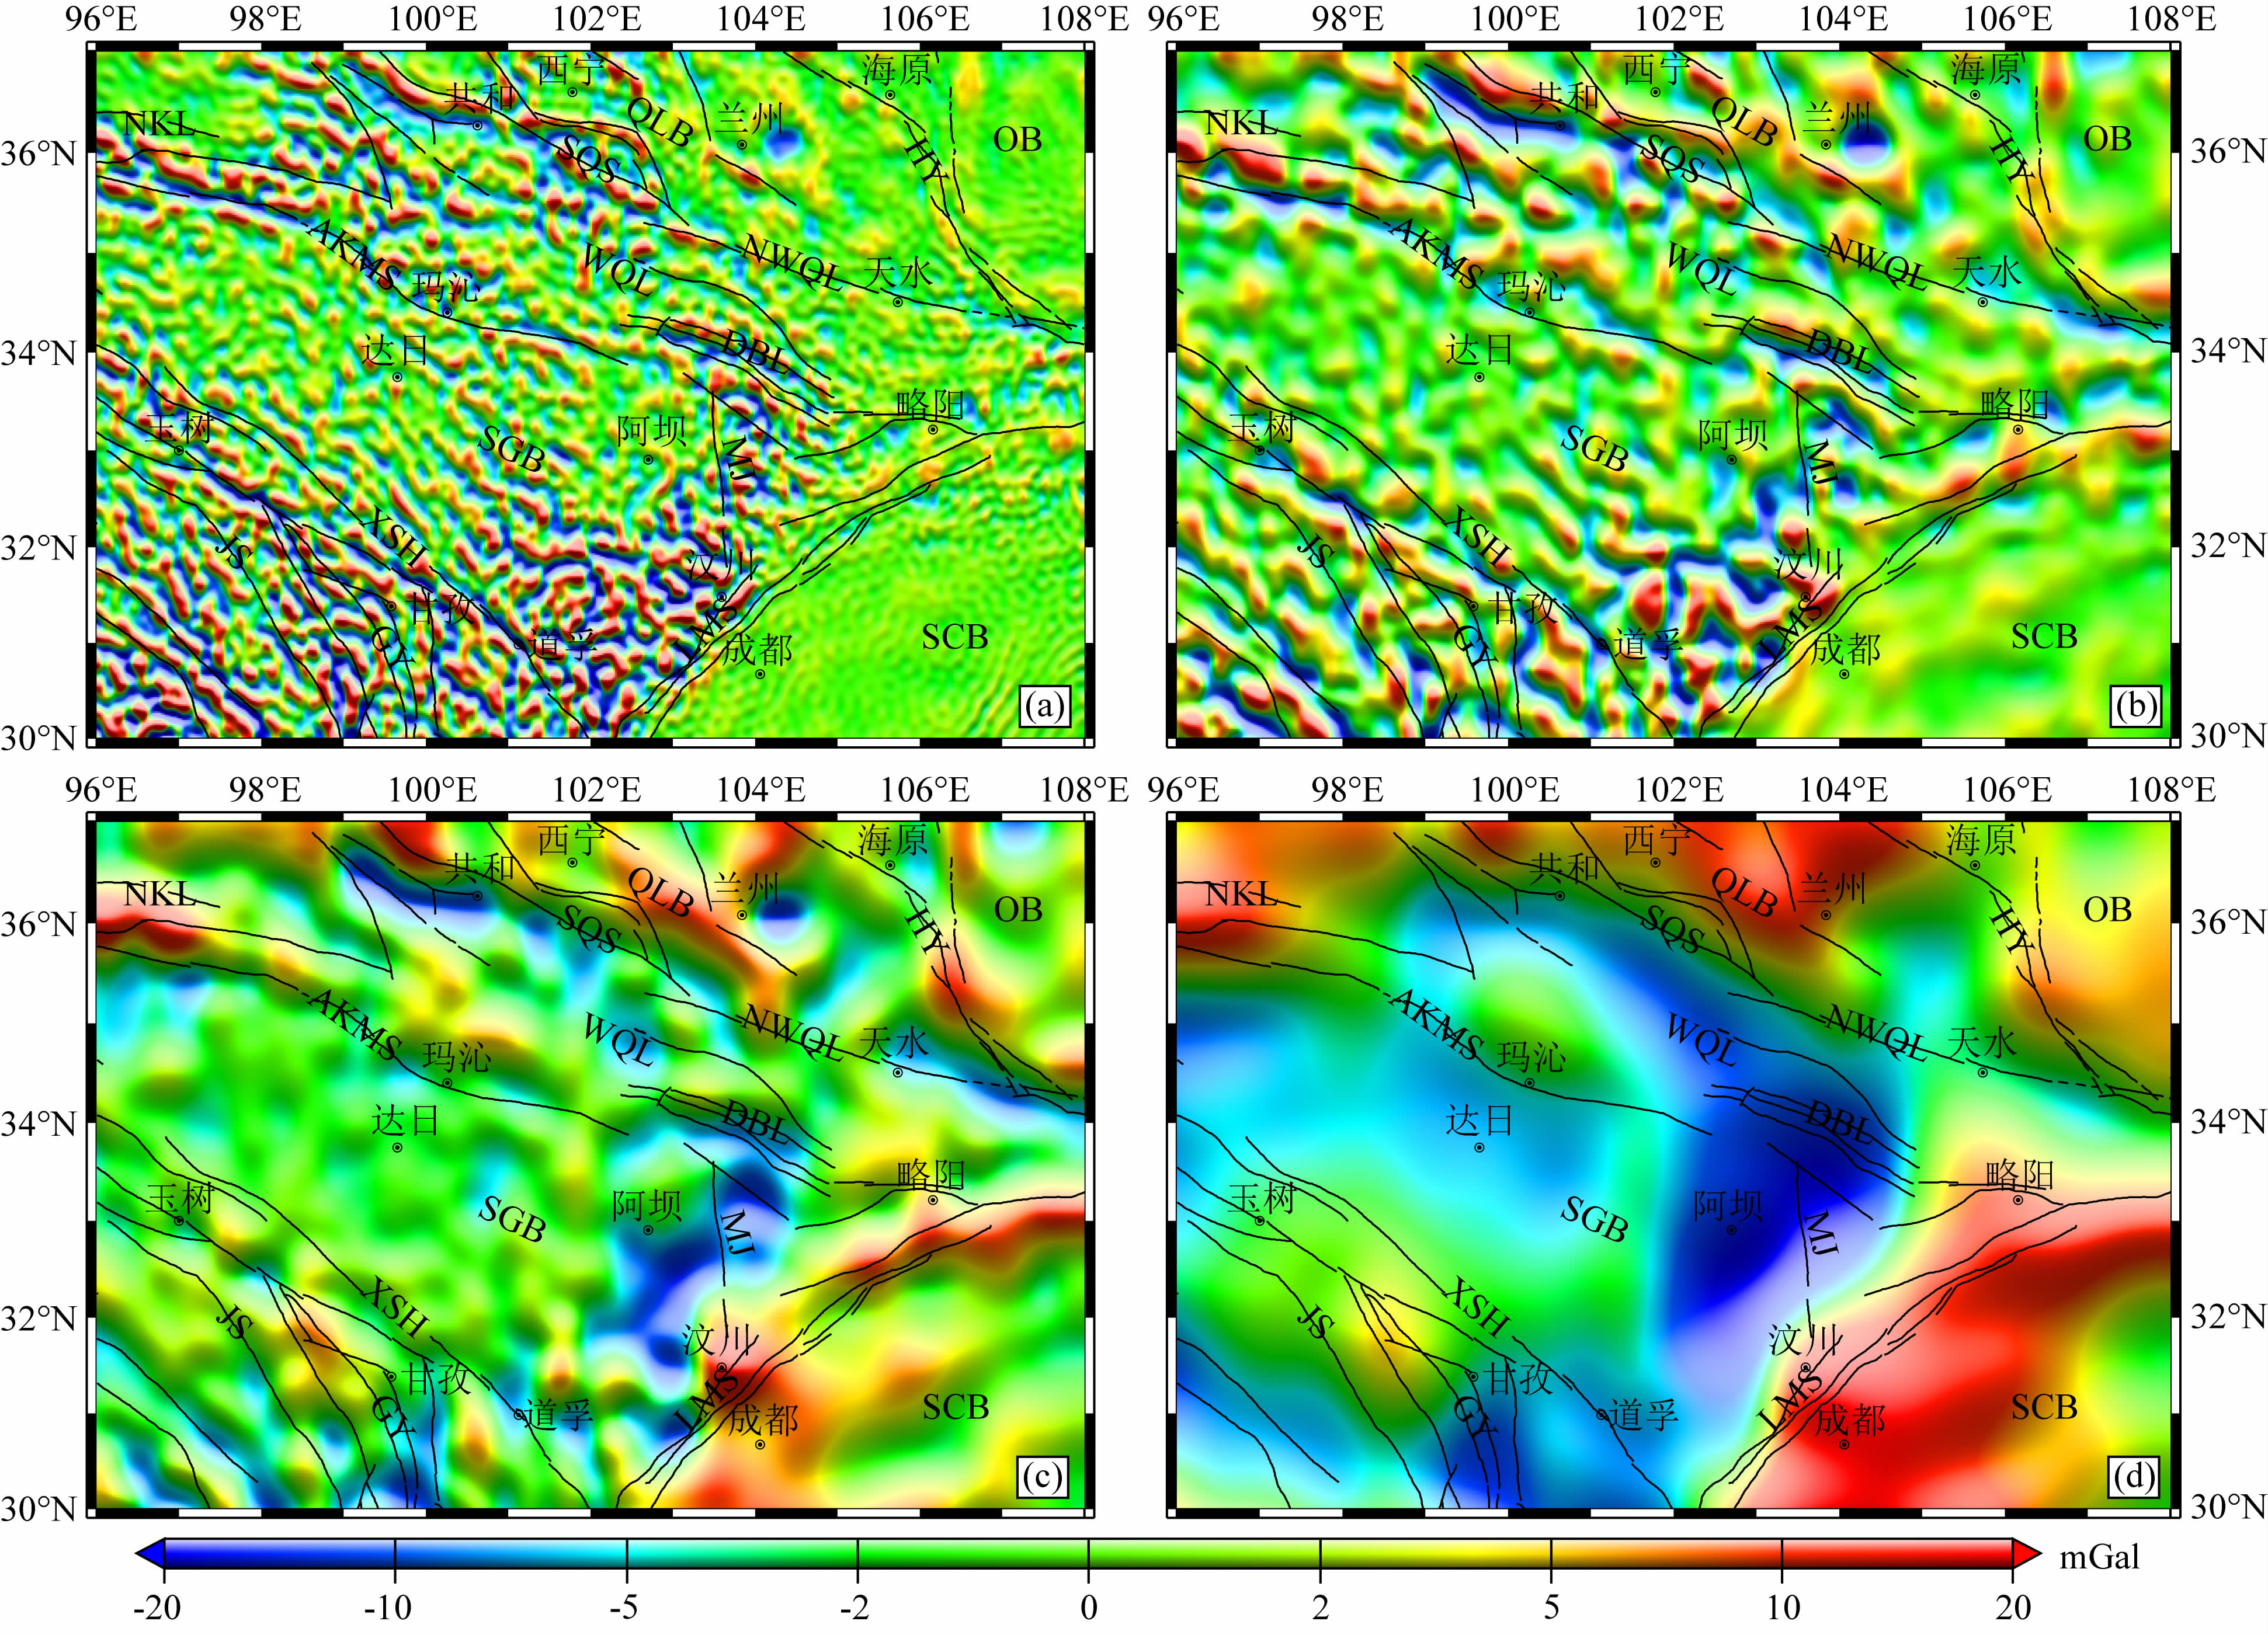 | 图 4 布格重力异常3~6阶小波变换细节图 Fig. 4 The 3rd to 6th order detailed images of Bouguer gravity anomaly from multi-scale wavelet analysis method |
5阶细节异常图(图 4c)反映了研究区中下地壳的布格重力异常特征.由图可知,青藏高原东北部大都显示负异常,而周围块体,如四川盆地、鄂尔多斯盆地、祁连地块以及柴达木盆地等都表现为突出的正异常,依旧为刚性块体的特征.西秦岭造山带北缘、松潘—甘孜地块东缘则呈现明显的负异常,推测是岩石受压应力破碎或者存在地壳熔融物质.四川盆地正异常区向西延伸,越过龙门山断裂带,反映了松潘—甘孜地块岩石圈向四川盆地仰冲的构造形态.
3.3 大尺度重力异常对数功率谱估计的6阶细节异常所反映的平均场源深度为125 km,体现了研究区上地幔布格重力异常特征(图 4d).鲜水河断裂带和金沙江断裂带所围限的正异常区,表现为刚性块体的性质,与周围的负异常带形成对比,推测该区曾经为扬子地台的一部分,其被顺时针旋转的地幔流冲断.研究区最为明显的重力低值区出现在松潘甘孜东缘和西秦岭造山带,范围较为连续,其东北缘幅值最低,向两翼逐渐增大.鄂尔多斯盆地西南缘分布弧形的重力梯度带,对应于地理上的海原断裂带,分割了低重力的青藏高原东北缘和高重力的鄂尔多斯盆地,形成深达岩石圈尺度的超壳断裂,而青藏高原壳幔物质挤入到阿拉善地台和鄂尔多斯盆地之间,在这样一个狭小的空间内势必会积累巨大的应变能,因此该区成为第四系以来构造变动十分强烈的地震活动区.
4 地壳厚度模型地球外部重力场是由地球内部物质分布所决定的,由于地壳和地幔存在着较大的密度差异,因此可以利用重力资料来确定地壳厚度(Feng et al.,2014).基于上述结论,本文对布格重力异常利用Parker-Oldenburg界面反演算法(Parker,1973;Oldenburg,1974)计算了青藏高原东北部及周缘地区的地壳厚度,其结果与GRACE卫星提供的GX-OG-2-GCM模型所计算的结果基本一致(段虎荣等,2010).
由图 5可见,青藏高原东北部地壳厚度在整体上由西向东逐渐减薄,其变化趋势以SE向为主,显示了青藏高原物质向东滑移引起地壳缩短变形的趋势.青藏高原岩石圈物质向东运动,受到扬子地台和华北地台的阻挡,引起物质的堆积;然而,在边缘造山带并没有发现“山根”的痕迹,重力异常多尺度分解结果显示该地壳减薄区存在明显的负异常,体现了深部物质上升并与岩石圈底部相互作用导致部分熔融的可能性(图 6).研究区莫霍面最深处在松潘 甘孜腹地,约59 km,而最浅处在四川盆地,约37 km. 以102°E—104°E为界,以西地壳厚度在50 km以 上,以东在45 km以下,尤其在龙门山附近,存在一条NNE向的地壳陡变带,其两侧莫霍面有5 km以上的错断,龙门山两侧地壳厚度的显著差异反映了松潘—甘孜地块岩石圈与扬子地台岩石圈结构的差异,这可能是龙门山形成的深部原因.总之,青藏高原东北部的地壳厚度东西向有显著差异,呈现出地壳内部受到了东西方向的强烈挤压的趋势;在印度板块的挤压环境下,南北向的莫霍面起伏却较为平缓,推测下地壳和上地幔经历过强烈的伸展运动.
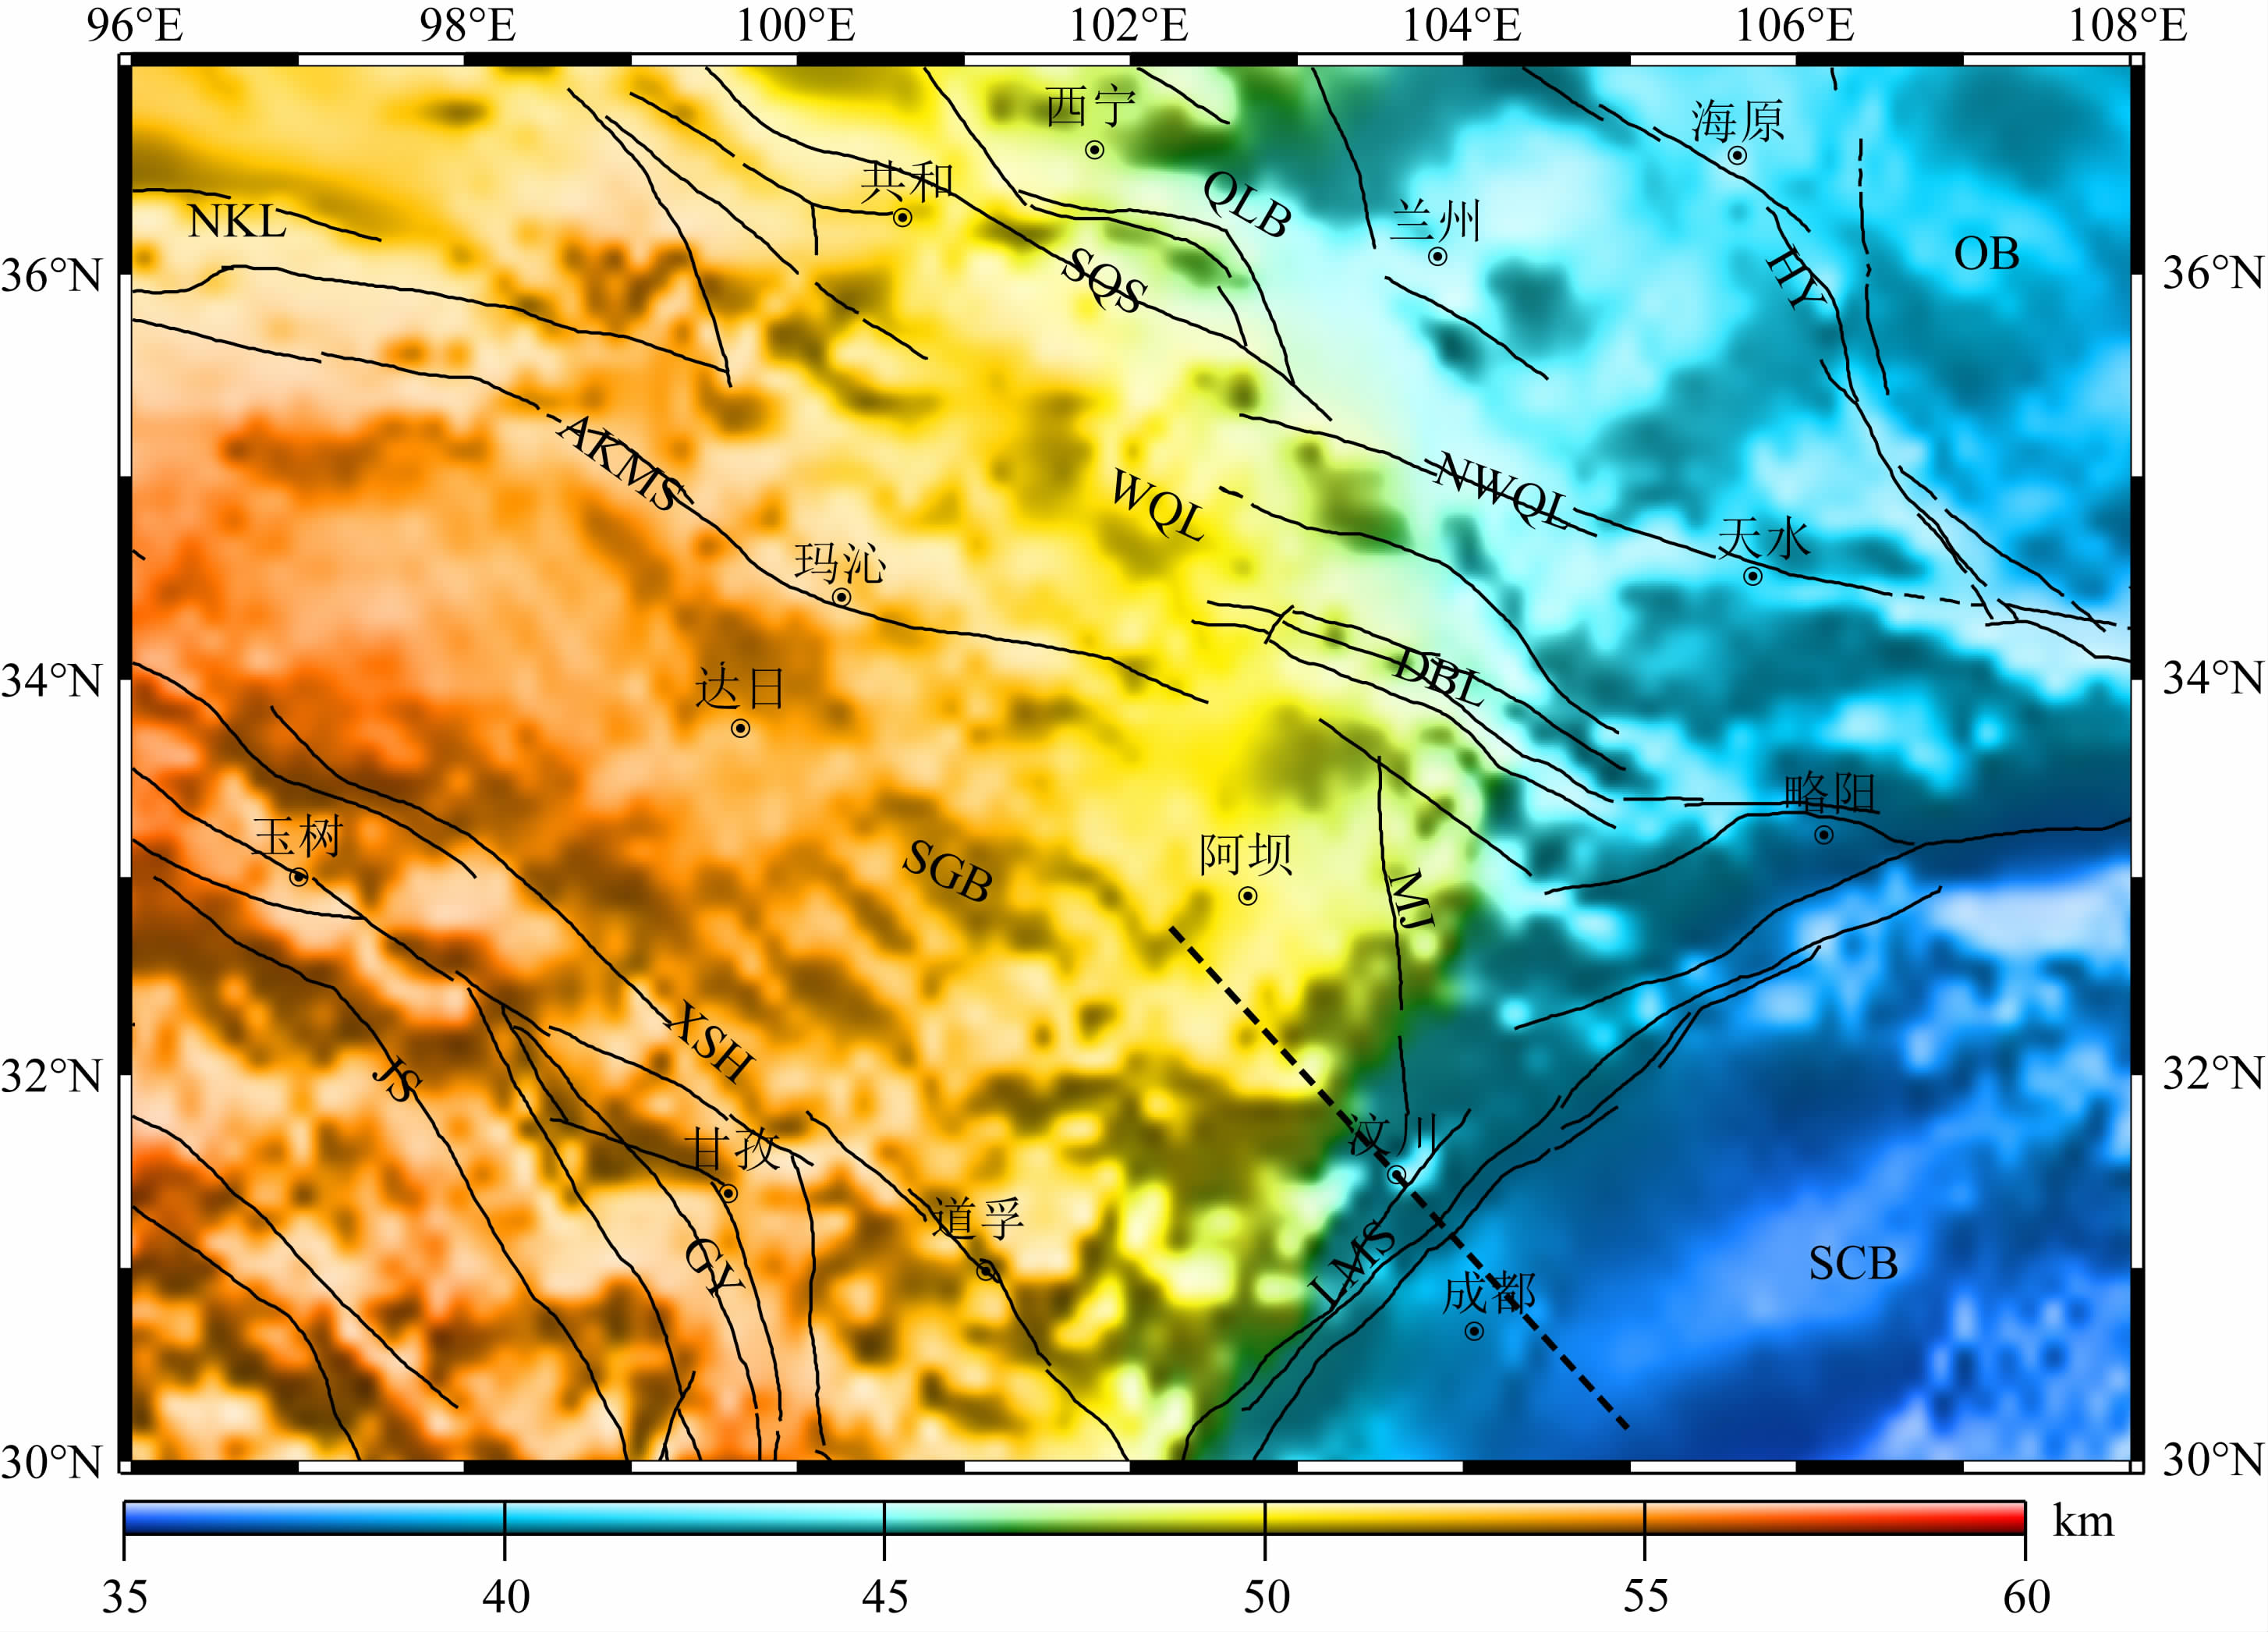 | 图 5 研究区地壳厚度分布图 Fig. 5 Variation of the crustal thickness of the study region |
从布格重力异常平面等值线上切割两条剖面(位置见图 3中实线A-A′、B-B′),由于地形质量产生的短波高频信息对深部构造研究会造成严重干扰(杨金玉等,2012),因此对原始的布格重力数据采用巴特沃斯低通滤波过滤掉高频成分,获得了平稳的区域异常曲线.基于前人的研究结果作为分层结构(Liu et al.,2006;Wang et al.,2010,2013),采用二度半体重力异常人机交互算法正演模拟了两条剖面的密度结构(图 7,图 8).在构建过程中,对密度模型的形态与密度等参数进行多次拟合,力图达到最好的效果.
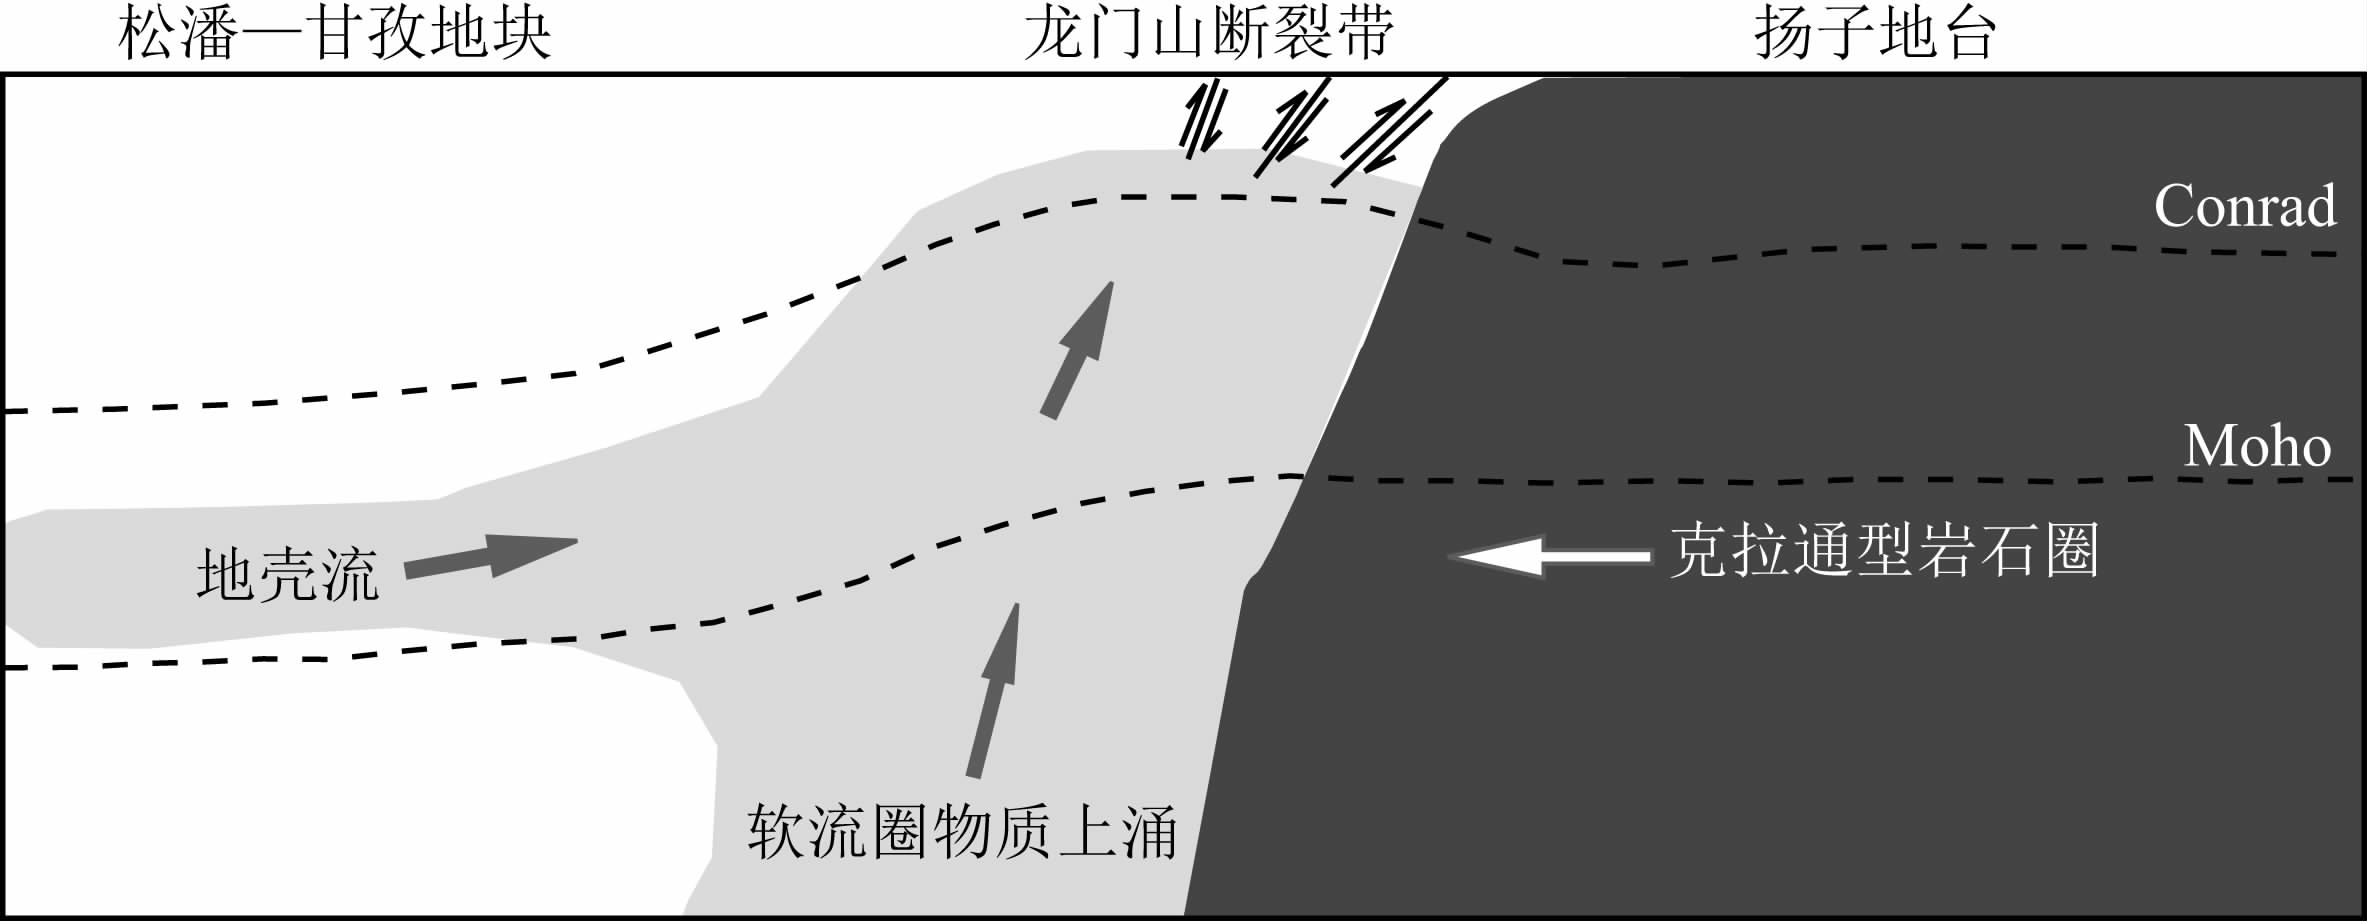 |
图 6 松潘—甘孜地块东缘深部动力学示意图 据Wang et al.,2010修改. 剖面位置见图5黑色虚线. Fig. 6 The cartoon showing the dynamic process under the eastern margin of the Songpan-Garzê block The result was derived from Wang et al.,2010. The location was labeled with black dash line in Fig.5. |
A-A′剖面由99.65°E,33.75°N至106.114°E,30.83°N,全长697 km,方位为112.7°,该剖面跨越松潘—甘孜地块中部,以SE向穿越龙门山造山带,最终抵达四川盆地腹地.从横向上看,龙门山两侧岩石圈物质和结构差异明显(见图 7).上地壳中,松潘—甘孜地块密度要大于四川盆地.由于早二叠纪松潘甘孜洋向昆仑柴达木地块俯冲,使陆缘弧地带抬升成山,在三叠纪时期松潘甘孜洋上沉积了巨厚海相复理石堆积(Yin and Harrison,2000),这种高致密的沉积物甚至被学者称为“中生代基底”(嘉世旭等,2009).
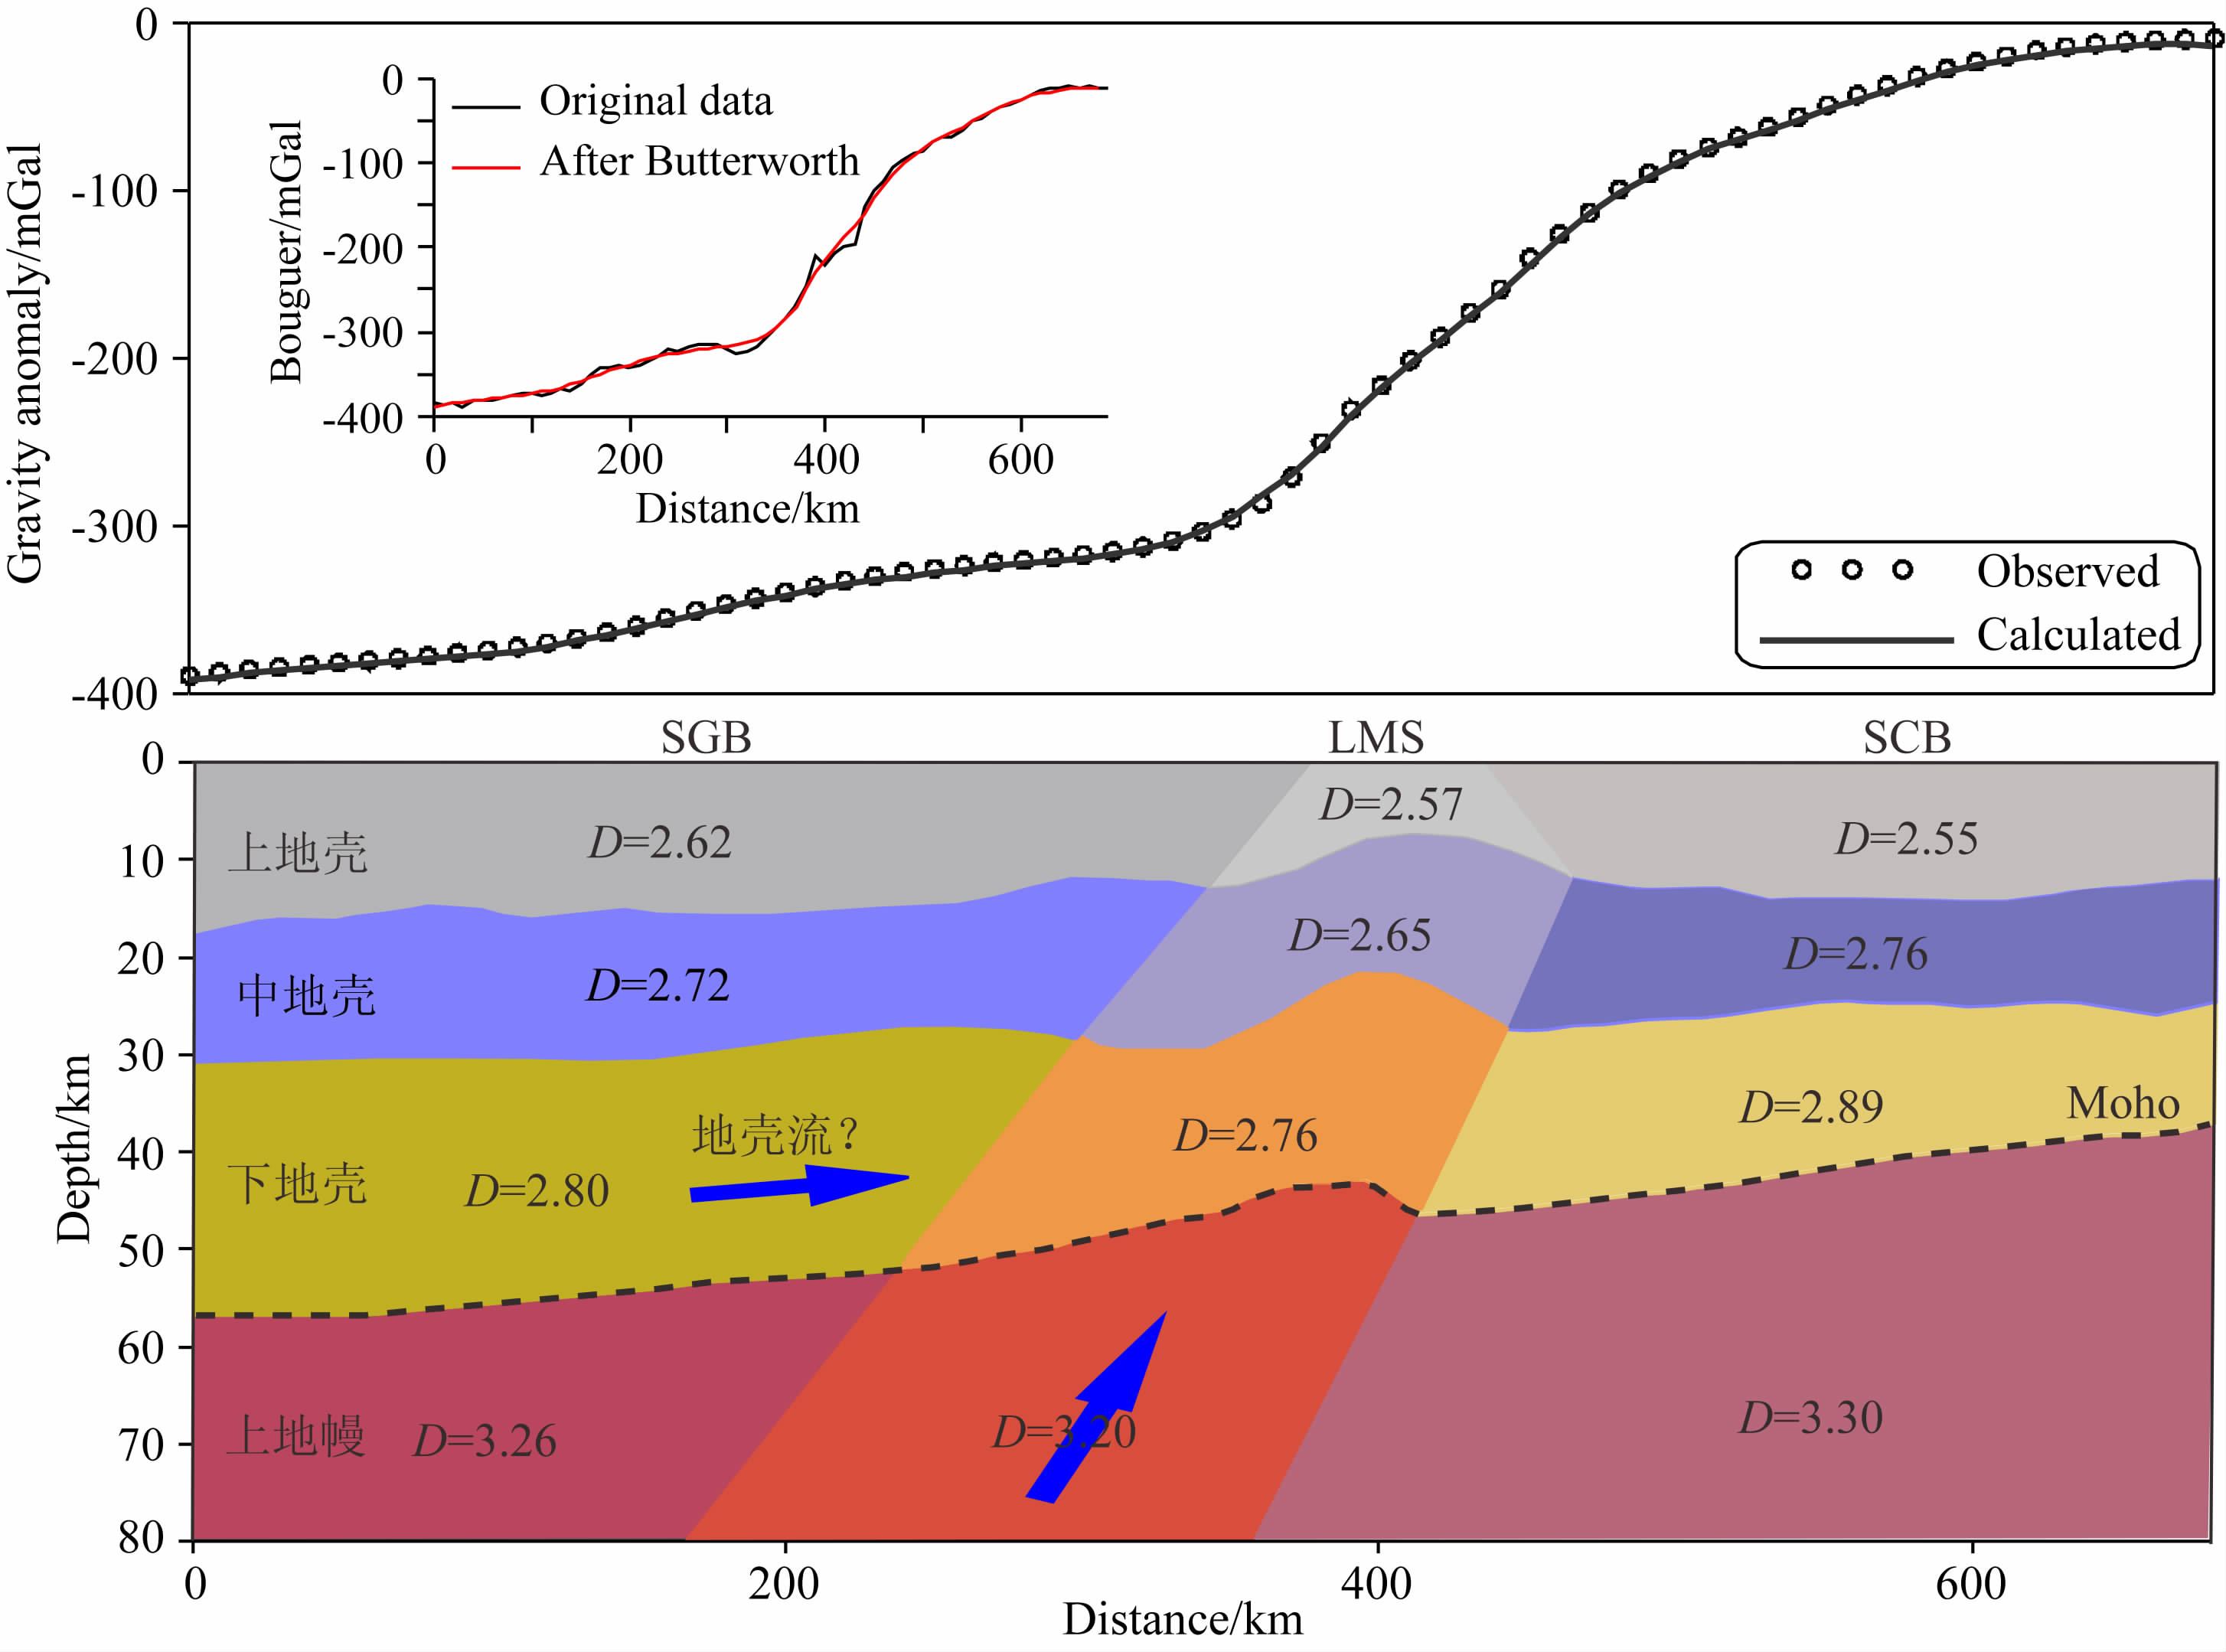 |
图 7 A-A′剖面岩石圈密度模型 不同块体和层位的平均密度已标注在模型中,单位为g·cm-3. Fig. 7 Lithospheric density structure along the A-A′ profile Densities of different positions are labeled in the model, and the unit of density is g·cm-3. |
在中下地壳,松潘—甘孜地块平均密度要明显低于四川盆地,表明处于青藏高原东北部地域的松潘—甘孜地块中下地壳物质相对柔软.大地电磁资料显示青藏高原东部中下地壳范围内存在大规模的高导体(张乐天等,2012;Wang et al.,2014);地震资料也揭示了龙门山造山带以西中下地壳速度远小于平均值(Wang et al.,2010);地热模拟的松潘—甘孜地块东部地下温度,中地壳接近700~800 ℃,下地壳达到了1000 ℃(Jiménez-Munt et al.,2008),如此高的温度足以使地壳物质熔融;GPS测量显示青藏高原中部和北部地壳物质存在着向东移动的现象,并且自西向东运动的速度越来越小(Zhang et al.,2004).在松潘—甘孜地块东缘龙门山造山带,中下地壳的密度达到横向上的最低值,且界面起伏较大,显示该区受到过强烈的挤压致使基底褶皱变形.下地壳流模型似乎可以解释这些地球物理现象,然而地壳流意味着壳幔解耦,并且有足够大范围内的下地壳存在流体.布格重力异常多尺度分解结果(图 4c)显示在松潘—甘孜地块内部并没有出现明显的低重力异常,岩石圈密度模型(图 7)中松潘—甘孜地块内部下地壳密度为2.80 g·cm-3,密度略低,但并未达到熔融的程度.
在上地幔结构中,松潘—甘孜地区的物质密度仍小于四川盆地,龙门山造山带最低.由于青藏高原内部存在丰富的地幔热流活动,在龙门山造山带附近,地幔热流已充斥到下地壳,导致下地壳物质部分熔融,形成塑性流体,因而密度达到横向上的最小值.松潘—甘孜地块向四川盆地仰冲的过程中,脆性的上地壳相互挤压碰撞,在接触部位形成破碎带,而塑性的岩石圈物质在东流过程中,遇到刚硬的四川盆地岩石圈阻挡,一部分转向东南方,一部分被迫上移,侵入到破碎岩石中并且抬升地壳,因而造就了龙门山的隆升.
5.2 B-B′剖面密度结构B-B′剖面由99.65°E,33.75°N至107.64°E,35.71°N,全长772 km,方位为67.3°,该剖面跨越松潘—甘孜地块中部以NE向穿越西秦岭造山带,抵达鄂尔多斯盆地.B-B′剖面密度结构模型呈现出松潘甘孜—西秦岭—鄂尔多斯地区的岩石圈密度结构具有横向分块,纵向分层的特点(见图 8).上地壳各地块的平均密度由西南到东北逐渐减小;厚度上西秦岭造山带最薄,往两边逐渐增厚.
 |
图 8 B-B′ 剖面岩石圈密度模型 不同块体和层位的平均密度已标注在模型中,单位为g·cm-3. Fig. 8 Lithospheric density structure along the B-B′ profile Densities of different positions are labeled in the model, and the unit of density is g·cm-3. |
在中下地壳,西秦岭造山带与松潘—甘孜地块密度值相同,反映了中下地壳物质成分相同,二者可能统属一个基底,这与前人的深地震反射结果有良好的一致性(高锐等,2006).中下地壳较低的密度值显示其柔软的性质,也与该区其他测量结果相对应:大地电磁测深剖面揭示该区地表下13~20 km到40~50 km之间存在低阻异常体,其电阻率在几欧姆米到几十欧姆米(金胜等,2012);深地震反射剖面结果显示该区域在地下20~45 km深度范围内具有高低速相间、低速为主的结构,与周边稳定地块(阿拉善地台、鄂尔多斯盆地、四川盆地)的中下地壳速度相比,平均低0.3~0.6 km·s-1(嘉世旭和张先康,2008).相比于龙门山,青藏高原东北缘大部分地区的地壳物质并不具备高泊松比的性质,单纯的地壳流体模型解释该区的低密度体有一定的局限,对此有学者认为青藏高原东北缘中下地壳含有较多的长英质组分(Pan and Niu,2011).长英质组分提升了地壳物质的熔点,致使西秦岭造山带下地壳物质的熔融程度弱于龙门山造山带.
上地幔中,西秦岭造山带密度最小,且莫霍面上隆.结合前人研究成果推断西秦岭地区上地幔低密度体可能是来自于地幔流物质上涌加热弱化了岩石圈底部,关于地幔流物质的来源和成因,下一节会详细讨论.
6 地球动力学意义岩石圈厚度分布揭示青藏高原地区有两处明显减薄区:羌塘地体以北到昆仑造山带之间的藏北高原地区和青藏高原东北缘西秦岭松潘构造结附近(An and Shi,2006).在藏北高原,存在着大面积低Pn波速和Sn波缺失的事实(马开义等,1996),同时广泛发育新生代碱性火山岩.印度板块向北俯冲到班公湖—怒江缝合带附近(潘桂棠等,2004;Kumar et al.,2006),其岩石圈地幔前缘进入亚洲软流圈深部,造成深部软流圈地幔的热物质上涌(Owens and Z and t,1997;Tilmann et al.,2003).SKS分裂波显示该区具有青藏高原目前所知最强的各向异性区,其快波极化方向揭示了软流圈地幔物质向东流动(杨晓松等,2002).
青藏高原东北缘亦表现出与藏北高原相似的地质地球物理性质.地质调查表明在高原东北部广泛发育新生代火山岩(喻学惠等,2009;汤庆艳等,2012;赖绍聪等,2014),有些地区岩浆活动仍在进行.地壳下岩浆上升至地表喷发的前提之一是存在地壳破裂作为其运移通道,而破裂源于地壳底部的张应力作用(熊熊等,2007).深地震反射结果揭示了西秦岭造山带岩石圈经历了强烈的伸展运动(高锐等,2006),说明该地区岩石圈深部确实存在张应力作用.西秦岭地区新生代超钾质火山岩的地球化学特征揭示了其源区为地幔或软流圈,并且具有地幔柱源的特征(喻学惠等,2009).火山岩出露位置恰位于上地幔重力低值区内,亦是岩石圈减薄区,壳幔界面不明显,同时周边有热泉分布,天水地区莫霍面附近存在高导低速层预示着该区莫霍面以下局部熔融的可能性(林长佑等,1995).一系列证据说明了该区岩石圈底部软流圈热物质通过底侵作用上涌,强烈的上拱力造成岩石圈的整体形变,地幔热物质进入岩石圈致使岩石圈底部的物质被加热弱化,甚至挤入地壳部分,造成下地壳物质局部减压熔融.
地幔物质上涌的动力学机制来源于青藏高原中心软流圈地幔流的东向移动.GPS精准测量结果显示高原东部物质向东北和东南方向运动(见图 9);莫宣学等(2007)根据青藏高原新生代火山岩的时空分布关系并综合其他地质地球物理资料,推断三江地区和西秦岭地区深部分别存在一条物质流通道,而高原腹地下软流圈地幔物质正是沿“软流圈通道”向东流动.在西秦岭松潘构造结,岩石圈上地幔分布着明显的低密度异常,其重力异常区呈现侧卧的马鞍状形态,前缘朝NE向凸出,而火山岩出露的位置恰位于前缘位置,体现了地幔热物质并不是垂直上涌,而是存在NE方向的位移趋势.由于西秦岭松潘构造结周缘为稳定的大陆克拉通地区,东移的软流圈地幔流受到扬子地台和华北地台坚硬岩石圈的阻挡,在陆续的挤压之下,被迫上涌即产生底侵作用,物质和能量积累,影响到龙门山和西秦岭的隆升和近年来川陕甘地区地震的诱发.
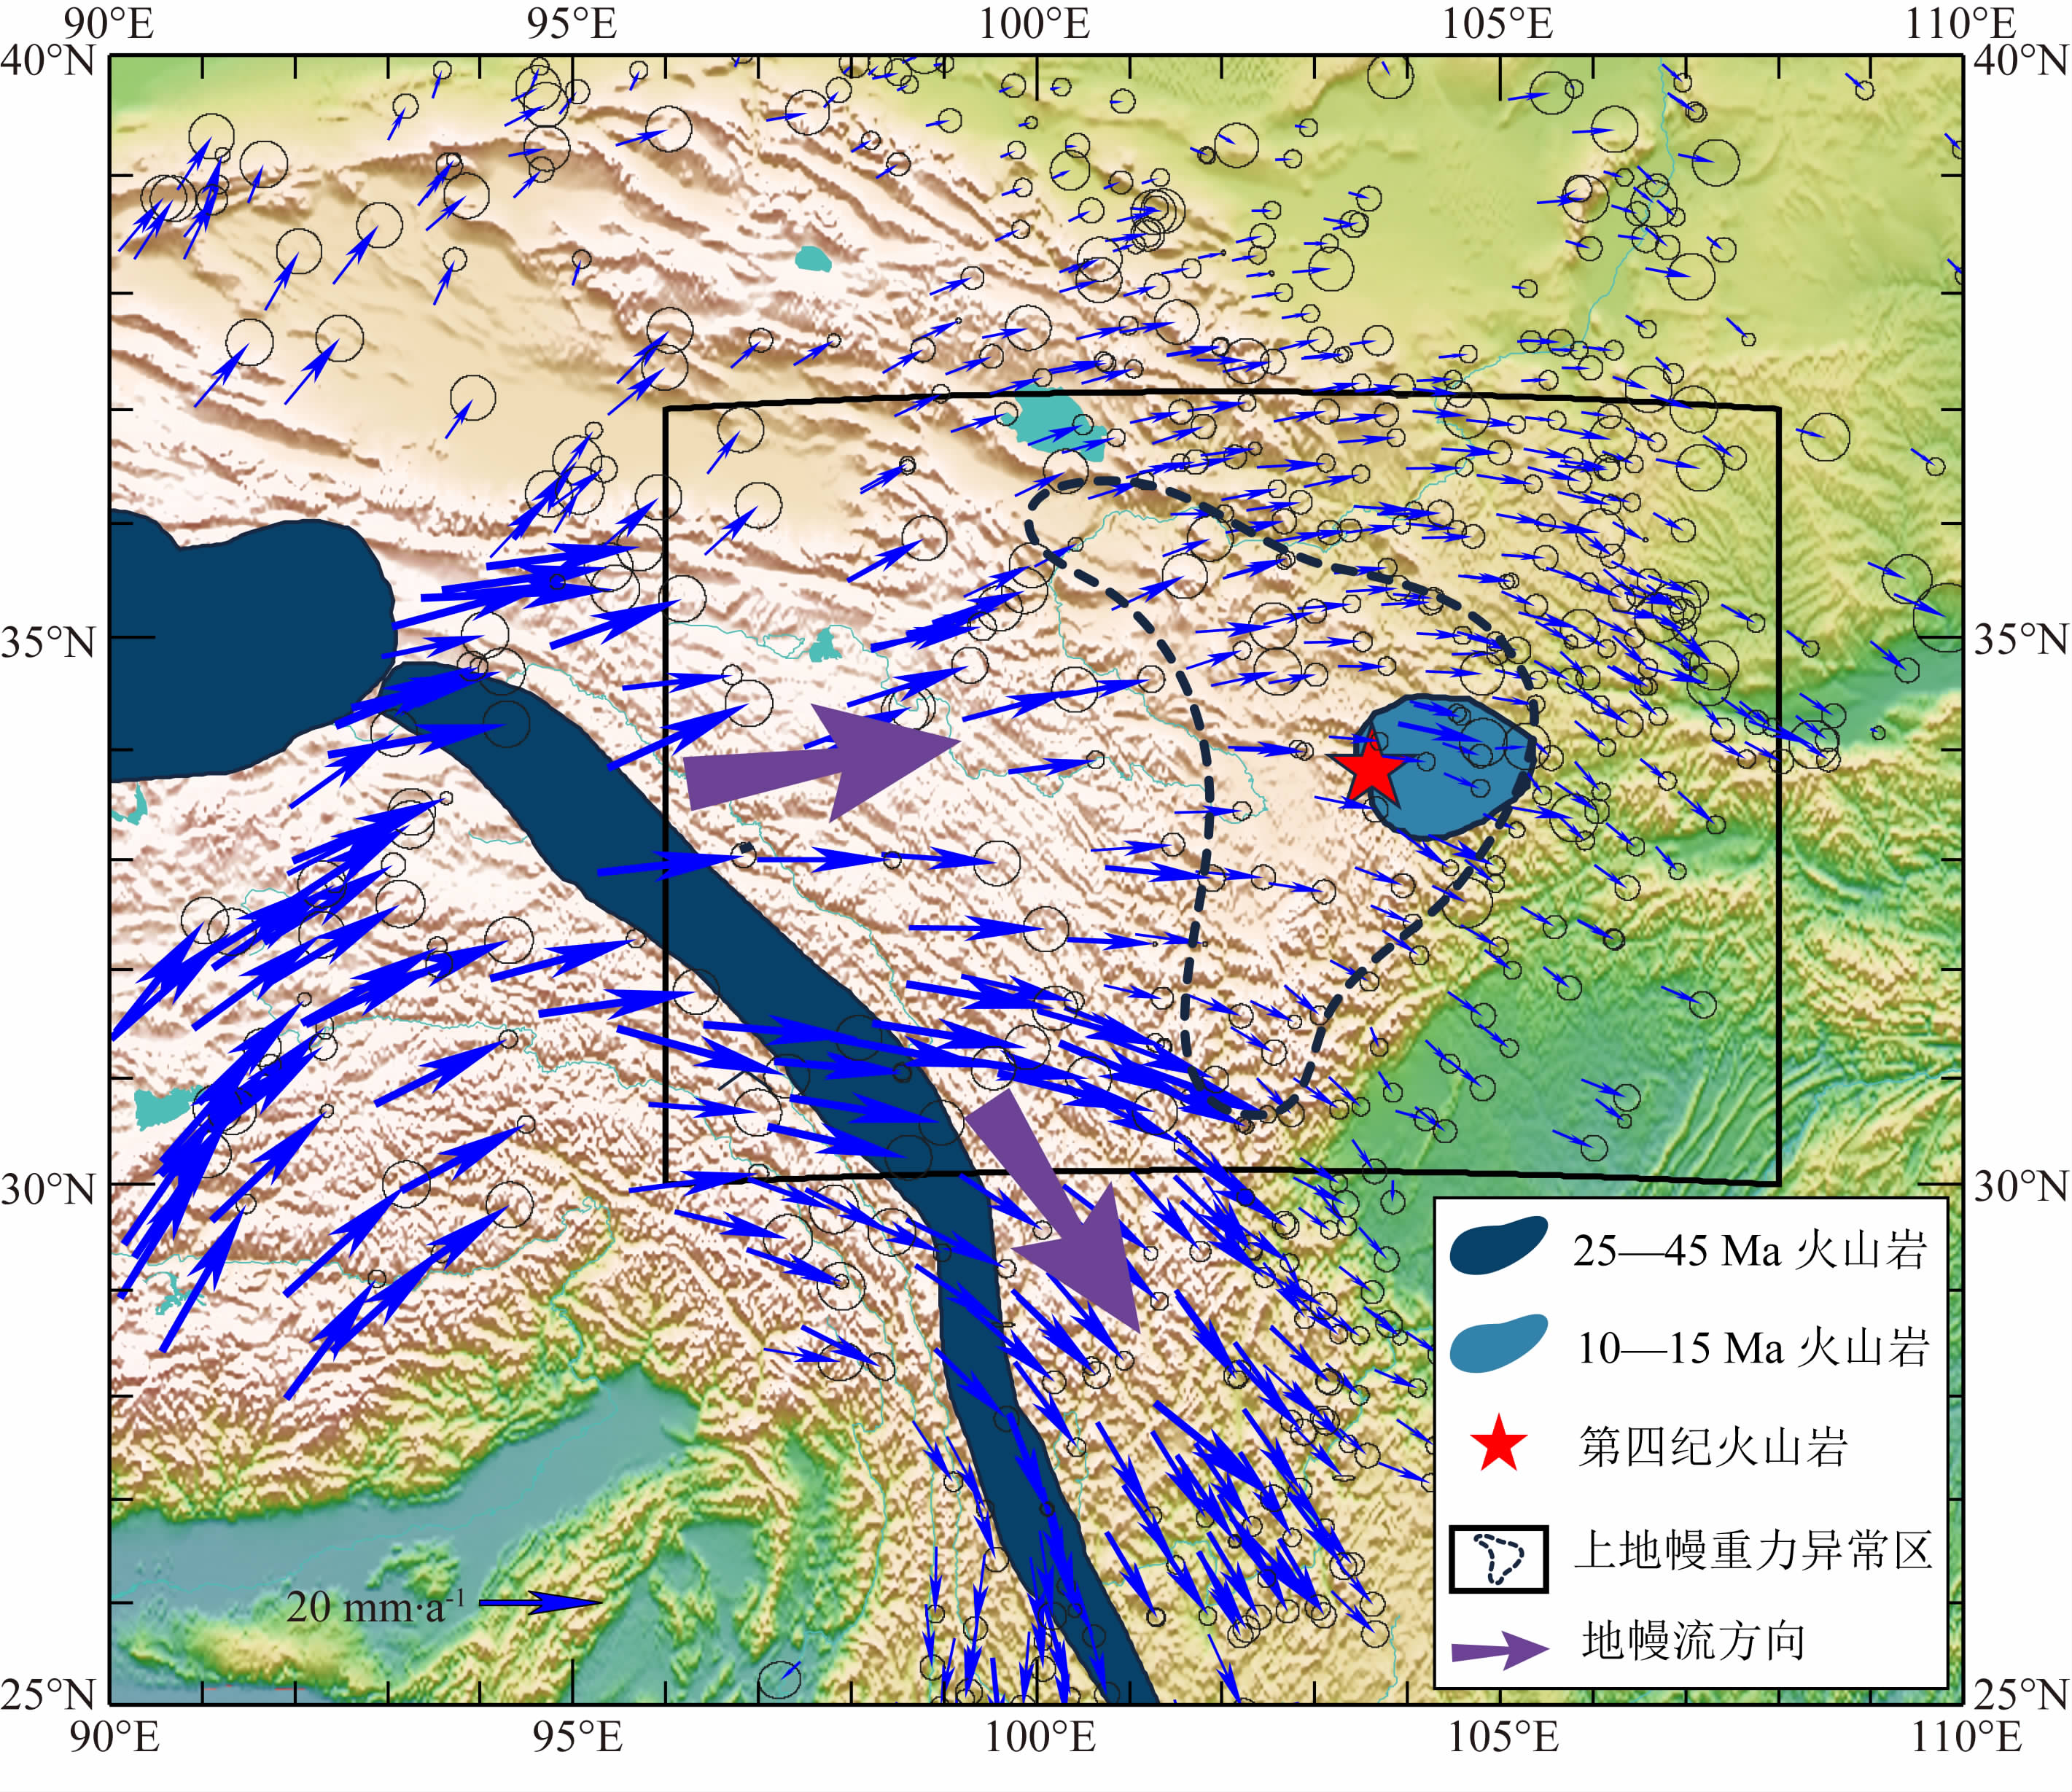 |
图 9 青藏高原东部地球动力学模式图 GPS数据资料取自Liang等(2013),青藏高原新生代火山岩的时空分布及地幔流向引自莫宣学等(2007). Fig. 9 The geodynamic model image of the eastern Tibetan plateau GPS data is compiled from Liang et al. (2013), the distribution of the Cenozoic volcanism with time is quoted from Mo et al. (2007). |
本文将EGM2008模型的重力数据应用于青藏高原东北部壳幔结构的研究之中.通过对多尺度重力场、地壳厚度、岩石圈密度结构的分析以及其他地球物理、地质等研究的比较,得到以下几点认识:
(1)青藏高原东北部的壳幔物质结构与周边地区相比有很大的差异:四川盆地、鄂尔多斯盆地以及祁连山地块整体上表现出均匀的刚性块体性质;而 青藏高原东北部则呈现出复杂的塑性介质的特征,其异常的走向多以 EW 或 SSE 为主,反映了岩石圈物质向东运移的趋势.
(2)重力场多尺度分解结果并不支持青藏高原东北部下地壳流动模型.根据青藏高原东北部的地壳厚度由西向东逐渐减薄,边缘造山带深部无“山根”痕迹,推测地幔热流上涌,抬升了莫霍面,致使岩石圈底部物质部分熔融,因而高原东缘、东北缘的岩石圈底部显示出低密度的性质.
(3)龙门山和西秦岭的隆升可能同时受大规模地幔流底侵作用的影响.深部物质上涌的动力受控于青藏高原向东北扩张的过程中,高原内部的软流圈物质侧向流动,受到扬子地台和华北地台坚硬岩石圈的阻挡而被迫上移.这一动力学过程或许也是川陕甘地区地震孕育的重要条件.
本文的研究结果对深化认识青藏高原周缘造山带隆升机制及深层动力学过程有着重要意义.如果今后能结合地面实测重力数据对模型进行有效校正,则有望为青藏高原的岩石圈物质分布、地震孕育等提供更丰富细致的信息.
致谢 感谢两位审稿专家提出的宝贵意见.文中部 分图件使用了GMT软件(Wessel and Smith,1991)进行绘制.| [1] | An M J, Shi Y L. 2006. Lithospheric thickness of the Chinese continent. Phys. Earth Planet. Int., 159(3-4):257-266. |
| [2] | Bai D H, Unsworth M J, Meju M A, et al. 2010. Crustal deformation of the eastern Tibetan plateau revealed by magnetotelluric imaging. Nature Geoscience, 3(5):358-362. |
| [3] | Chen S, Xu W M, Shi L, et al. 2013. Gravity field and lithospheric mechanical properties of Longmenshan fault zone and its surrounding areas. Acta Seismologica Sinica (in Chinese), 35(5):692-703. |
| [4] | Clark M K, Royden L H. 2000. Topographic ooze:Building the eastern margin of Tibet by lower crustal flow. Geology, 28(8):703-706. |
| [5] | Deng Q D, Zhang P Z, Ran Y K, et al. 2002. Basic feature of China active structures. Science in China (Series D) (in Chinese), 32(12):1020-1030. |
| [6] | Duan H R, Zhang Y Z, Liu F, et al. 2010. Crustal thickness computed by using satellite gravity data in China and its adjacent regions. Progress in Geophys. (in Chinese), 25(2):494-499, doi:10.3969/j.issn.1004-2903.2010.02.016. |
| [7] | England P, Houseman G. 1986. Finite strain calculations of continental deformation:2. Comparison with the India-Asia collision zone. J. Geophys. Res., 91(B3):3664-3676. |
| [8] | Feng R H, Dong P, Wang L S, et al. 2014. Inversion of Moho interface in northeastern China with prior information. Journal of Earth Science, 25(1):146-151, doi:10.1007/s12583-014-0407-9. |
| [9] | Fu G Y, Zhu Y Q, Gao S H, et al. 2013. Discrepancies between free air gravity anomalies from EGM2008 and the ones from dense gravity/GPS observations at west Sichuan Basin. Chinese J. Geophys. (in Chinese), 56(11):3761-3769, doi:10.6038/cjg20131117. |
| [10] | Gao R, Ma Y S, Li Q S, et al. 2006. Structure of the lower crust beneath the Songpan block and West Qinling orogen and their relation as revealed by deep seismic reflection profiling. Geological Bulletin of China (in Chinese), 25(12):1361-1367. |
| [11] | Gao R, Xiong X S, Li Q S, et al. 2009. The Moho depth of Qinghai-Tibet Plateau revealed by seismic detection. Acta Geoscientia Sinica (in Chinese), 30(6):761-773. |
| [12] | Gao R, Wang H Y, Zeng L S, et al. 2014. The crust structures and the connection of the Songpan block and West Qinling orogen revealed by the Hezuo-Tangke deep seismic reflection profiling. Tectonophysics, 634:227-236. |
| [13] | He J K, Lu S J, Wang W M. 2013. Three-dimensional mechanical modeling of the GPS velocity field around the northeastern Tibetan plateau and surrounding regions. Tectonophysics, 584:257-266. |
| [14] | Hou Z Z, Yang W C. 1997. Wavelet transform and multi-scale analysis on gravity anomalies of China. Chinese J. Geophys. (Acta Geophysica Sinica) (in Chinese), 40(1):85-95. |
| [15] | Jia S X, Zhang X K. 2008. Study on the crust phases of deep seismic sounding experiments and fine crust structures in the northeast margin of Tibetan plateau. Chinese J. Geophys.(in Chinese), 51(5):1431-1443. |
| [16] | Jia S X, Zhang X K, Zhao J R, et al. 2010. Deep seismic sounding data reveal the crustal structures beneath Zoige basin and its surrounding folded orogenic belts. Science China Earth Sciences, 53(2):203-212, doi:10.1007/s11430-009-0166-0. |
| [17] | Jiang W L, Zhang J F, Tian T, et al. 2012. Crustal structure of Chuan-Dian region derived from gravity data and its tectonic implications. Phys. Earth Planet. Int., 212-213:76-87. |
| [18] | Jiménez-Munt I, Fernàndez M, Vergés J, et al. 2008. Lithosphere structure underneath the Tibetan Plateau inferred from elevation, gravity and geoid anomalies. Earth Planet. Sci. Lett., 267(1-2):276-289. |
| [19] | Jin S, Zhang L T, Jin Y J, et al. 2012. Crustal electrical structure along the Hezuo-Dajing profile across the Northeastern Margin of the Tibetan Plateau. Chinese J. Geophys. (in Chinese), 55(12):3979-3990, doi:10.6038/j.issn.0001-5733.2012.12.010. |
| [20] | Kumar P, Yuan X H, Kind R, et al. 2006. Imaging the colliding Indian and Asian lithospheric plates beneath Tibet. J. Geophys. Res.-Solid Earth, 111:B06308, doi:10.1029/2005JB003930. |
| [21] | Lai S C, Qin J F, Zhao S W, et al. 2014. Geochemistry and its continental dynamic implication of the Cenozoic sodic picritic basalt from the Liuping area, northeastern margin of the Tibetan Plateau. Acta Petrologica Sinica (in Chinese), 30(2):361-370. |
| [22] | Li H Y, Shen Y, Huang Z X, et al. 2014. The distribution of the mid-to-lower crustal low-velocity zone beneath the northeastern Tibetan Plateau revealed from ambient noise tomography. J. Geophys. Res., 119(3):1954-1970. |
| [23] | Li Y H, Wu Q J, Zhang F X, et al. 2011. Seismic anisotropy of the Northeastern Tibetan Plateau from shear wave splitting analysis. Earth Planet. Sci. Lett., 304(1-2):147-157. |
| [24] | Liang S M, Gan W J, Shen C Z, et al. 2013. Three-dimensional velocity field of present-day crustal motion of the Tibetan Plateau derived from GPS measurements. J. Geophys. Res., 118(10):5722-5732. |
| [25] | Lin C Y, Wu Y X, Yang C F. 1995. On the high conductive layer near the Moho and the transitional zone between the crust and mantle in Tianshui region. Acta Seismologica Sinica (in Chinese), 17(2):230-236. |
| [26] | Liu M J, Mooney W D, Li S L, et al. 2006. Crustal structure of the northeastern margin of the Tibetan plateau from the Songpan-Ganzi terrane to the Ordos basin. Tectonophysics, 420(1-2):253-266. |
| [27] | Ma K Y, Xue G Q, Dong Y J, et al. 1996. Uplift of Qinghai-Xizang (Tibet) Plateau and mantle deformation due to partial melting. Acta Geoscientia Sinica (in Chinese), 17(2):214-223. |
| [28] | Mallat S G. 1989. A theory for multiresolution signal decomposition:the wavelet representation. IEEE Transactions on Pattern Analysis and Machine Intelligence, 11(7):674-693. |
| [29] | Meng X H, Shi L, Guo L H, et al. 2012. Multi-scale analyses of transverse structures based on gravity anomalies in the northeastern margin of the Tibetan Plateau. Chinese J. Geophys. (in Chinese), 55(12):3933-3941, doi:10.6038/j.issn.0001-5733.2012.12.006. |
| [30] | Mo X X, Zhao Z D, Deng J F, et al. 2007. Migration of the Tibetan Cenozoic potassic volcanism and its transition to eastern basaltic province:implications for crustal and mantle flow. Geoscience (in Chinese), 21(2):255-264. |
| [31] | Molnar P, Tapponnier P. 1975. Cenozoic tectonics of Asia:effects of a continental collision. Science, 189(4201):419-426. |
| [32] | Oldenburg D W. 1974. The inversion and interpretation of gravity anomalies. Geophysics, 39(4):526-536. |
| [33] | Owens T J, Zandt G. 1997. Implications of crustal property variations for models of Tibetan plateau evolution. Nature, 387(6628):37-43. |
| [34] | Pan G T, Zhu D C, Wang L Q, et al. 2004. Bangong Lake-Nu River suture zone-the northern boundary of Gondwanaland:Evidence from geology and geophysics. Earth Science Frontiers (in Chinese), 11(4):371-382. |
| [35] | Pan S Z, Niu F L. 2011. Large contrasts in crustal structure and composition between the Ordos plateau and the NE Tibetan plateau from receiver function analysis. Earth Planet. Sci. Lett., 303(3-4):291-298. |
| [36] | Parker R L. 1973. The rapid calculation of potential anomalies. Geophys. J. Int., 31(4):447-455. |
| [37] | Pavlis N, Kenyon S, Factor J, et al. 2008. Earth gravitational model 2008.//SEG Technical Program Expanded Abstracts. Las Vegas, Nevada:SEG, 761-763. |
| [38] | Royden L H, Burchfiel B C, King R W, et al. 1997. Surface deformation and lower crustal flow in eastern Tibet. Science, 276(5313):788-790. |
| [39] | Tang Q Y, Zhang M J, Li X Y, et al. 2012. The chemical and carbon isotopic compositions of volatiles in Cenozoic high-potassic basalts in western Qinling, China and their mantle geodynamic implications. Acta Petrologica Sinica (in Chinese), 28(4):1251-1260. |
| [40] | Tapponnier P, Xu Z Q, Roger F, et al. 2001. Oblique stepwise rise and growth of the Tibet plateau. Science, 294(5547):1671-1677. |
| [41] | Tian X B, Zhang Z J. 2013. Bulk crustal properties in NE Tibet and their implications for deformation model. Gondwana Res., 24(2):548-559. |
| [42] | Tilmann F, Ni J, INDEPTH III Seismic Team. 2003. Seismic imaging of the downwelling Indian lithosphere beneath central Tibet. Science, 300(5624):1424-1427. |
| [43] | Vergne J, Wittlinger G, Farra V, et al. 2003. Evidence for upper crustal anisotropy in the Songpan-Ganze (northeastern Tibet) terrane. Geophys. Res. Lett., 30(11):1552, doi:10.1029/2002GL016847. |
| [44] | Wang X B, Zhang G, Fang H, et al. 2014. Crust and upper mantle resistivity structure at middle section of Longmenshan, eastern Tibetan plateau. Tectonophysics, 619-620:143-148. |
| [45] | Wang Y X, Mooney W D, Yuan X C, et al. 2013. Crustal structure of the northeastern Tibetan Plateau from the Southern Tarim Basin to the Sichuan Basin, China. Tectonophysics, 584:191-208. |
| [46] | Wang Z, Zhao D P, Wang J A. 2010. Deep structure and seismogenesis of the north-south seismic zone in southwest China. J. Geophys. Res., 115(B12):B12334. |
| [47] | Wessel P, Smith W H F. 1991. Free software helps map and display data. Eos. Trans.AGU, 72(41):441-446. |
| [48] | Xiao Q B, Zhang J, Zhao G Z, et al. 2013. Electrical resistivity structures northeast of the Eastern Kunlun Fault in the Northeastern Tibet:Tectonic implications. Tectonophysics, 601:125-138. |
| [49] | Xiong X, Wang J Y, Teng J W. 2007. Deep mechanical background for the Cenozoic volcanism in the Tibetan plateau. Earth Science (Journal of China University of Geosciences) (in Chinese), 32(1):1-6. |
| [50] | Xu Z Q, Hou L W, Wang Z X, et al. 1992. Orogenic Processes of the Songpan-Ganze Orogenic Belt of China (in Chinese). Beijing:Geological Publishing House. |
| [51] | Xue G Q, Qian H, Jiang M, et al. 2003. Studies on the velocity structure of crust-upper mantle beneath northeast Qinghai-Tibet Plateau, China. Acta Geoscientia Sinica (in Chinese), 24(1):19-26. |
| [52] | Yang J Y, Zhang X H, Zhang F F, et al. 2012. On the accuracy of EGM2008 earth gravitational model in Chinese Mainland. Progress in Geophys. (in Chinese), 27(4):1298-1306, doi:10.6038/j.issn.1004-2903.2012.04.003. |
| [53] | Yang X S, Jin Z M, Ma J, et al. 2002. Genesis of SKS splitting in the north-central Qinghai-Xizang plateau:melt alignment enhanced lithosphere anisotropy. Chinese J. Geophys. (in Chinese), 45(6):821-831. |
| [54] | Yin A, Harrison T M. 2000. Geologic evolution of the Himalayan-Tibetan orogen. Annu. Rev. Earth Plant. Sci., 28:211-280. |
| [55] | Yu X H, Mo X X, Zhao Z D, et al. 2009. Two types of Cenozoic potassic volcanic rocks in West Qinling, Gansu Province:Their petrology, geochemistry and petrogenesis. Earth Science Frontiers (in Chinese), 16(2):79-89. |
| [56] | Zhang C Y, Guo C X, Chen J Y, et al. 2009. EGM 2008 and its application analysis in Chinese mainland. Acta Geodaetica et Cartographica Sinica (in Chinese), 38(4):283-289. |
| [57] | Zhang G W, Guo A L, Yao A P. 2004. Western Qinling-Songpan continental tectonic node in China's continental tectonics. Earth Science Frontiers (in Chinese), 11(3):23-32. |
| [58] | Zhang J S, Gao R, Zeng L S, et al. 2010. Relationship between characteristics of gravity and magnetic anomalies and the earthquakes in the Longmenshan range and adjacent areas. Tectonophysics, 491(1-4):218-229. |
| [59] | Zhang L T, Jin S, Wei W B, et al. 2012. Electrical structure of crust and upper mantle beneath the eastern margin of the Tibetan plateau and the Sichuan basin. Chinese J. Geophys. (in Chinese), 55(12):4126-4137, doi:10.6038/j.issn.0001-5733.2012.12.025. |
| [60] | Zhang P Z, Shen Z K, Wang M, et al. 2004. Continuous deformation of the Tibetan Plateau from global positioning system data. Geology, 32(9):809-812. |
| [61] | Zhang Z J, Klemperer S, Bai Z M, et al. 2011. Crustal structure of the Paleozoic Kunlun orogeny from an active-source seismic profile between Moba and Guide in East Tibet, China. Gondwana Res., 19(4):994-1007. |
| [62] | Zhang Z J, Bai Z M, Klemperer S L, et al. 2013. Crustal structure across northeastern Tibet from wide-angle seismic profiling:Constraints on the Caledonian Qilian orogeny and its reactivation. Tectonophysics, 606:140-159. |
| [63] | Zhao G Z, Tang J, Zhan Y, et al. 2005. Relation between electricity structure of the crust and deformation of crustal blocks on the northeastern margin of Qinghai-Tibet plateau. Science China Earth Sciences, 48(10):1613-1626. |
| [64] | Zhu L P, Helmberger D V. 1998. Moho offset across the northern margin of the Tibetan Plateau. Science, 281(5380):1170-1172. |
| [65] | 陈石, 徐伟民, 石磊等. 2013. 龙门山断裂带及其周边地区重力场和岩石层力学特性研究. 地震学报, 35(5):692-703. |
| [66] | 邓起东, 张培震, 冉勇康等. 2002. 中国活动构造基本特征. 中国科学(D辑:地球科学), 32(12):1020-1030. |
| [67] | 段虎荣, 张永志, 刘锋等. 2010. 利用卫星重力数据研究中国及邻域地壳厚度. 地球物理学进展, 25(2):494-499, doi:10.3969/j.issn.1004-2903.2010.02.16. |
| [68] | 付广裕, 祝意青, 高尚华等. 2013. 川西地区实测自由空气重力异常与EGM2008模型结果的差异. 地球物理学报, 56(11):3761-3769, doi:10.6038/cjg20131117. |
| [69] | 高锐, 马永生, 李秋生等. 2006. 松潘地块与西秦岭造山带下地壳的性质和关系——深地震反射剖面的揭露. 地质通报, 25(12):1361-1367. |
| [70] | 高锐, 熊小松, 李秋生等. 2009. 由地震探测揭示的青藏高原莫霍面深度. 地球学报, 30(6):761-773. |
| [71] | 侯遵泽, 杨文采. 1997. 中国重力异常的小波变换与多尺度分析. 地球物理学报, 40(1):85-95. |
| [72] | 嘉世旭, 张先康. 2008. 青藏高原东北缘深地震测深震相研究与地壳细结构. 地球物理学报, 51(5):1431-1443. |
| [73] | 嘉世旭, 张先康, 赵金仁等. 2009. 若尔盖盆地及周缘褶皱造山带地壳结构——深地震测深结果. 中国科学(D辑:地球科学), 39(9):1200-1208. |
| [74] | 金胜, 张乐天, 金永吉等. 2012. 青藏高原东北缘合作—大井剖面地壳电性结构研究. 地球物理学报, 55(12):3979-3990, doi:10.6038/j.issn.0001-5733.2012.12.010. |
| [75] | 赖绍聪, 秦江锋, 赵少伟等. 2014. 青藏高原东北缘柳坪新生代苦橄玄武岩地球化学及其大陆动力学意义. 岩石学报, 30(2):361-370. |
| [76] | 林长佑, 武玉霞, 杨长福. 1995. 天水地区莫霍面附近的高导层及壳幔过渡带. 地震学报, 17(2):230-236. |
| [77] | 马开义, 薛光琦, 董英君等. 1996. 地幔内异常热熔变与青藏高原的隆升. 地球学报, 17(2):214-223. |
| [78] | 孟小红, 石磊, 郭良辉等. 2012. 青藏高原东北缘重力异常多尺度横向构造分析. 地球物理学报, 55(12):3933-3941, doi:10.6038/j.issn.0001-5733.2012.12.006. |
| [79] | 莫宣学, 赵志丹, 邓晋福等. 2007. 青藏新生代钾质火山活动的时空迁移及向东部玄武岩省的过渡:壳幔深部物质流的暗示. 现代地质, 21(2):255-264. |
| [80] | 潘桂棠, 朱弟成, 王立全等. 2004. 班公湖—怒江缝合带作为冈瓦纳大陆北界的地质地球物理证据. 地学前缘, 11(4):371-382. |
| [81] | 汤庆艳, 张铭杰, 李晓亚等. 2012. 西秦岭新生代高钾质玄武岩流体组成及其地幔动力学意义. 岩石学报, 28(4):1251-1260. |
| [82] | 熊熊, 王继业, 滕吉文. 2007. 青藏高原新生代火山活动的深部力学背景. 地球科学(中国地质大学学报), 32(1):1-6. |
| [83] | 许志琴, 侯立玮, 王宗秀等. 1992. 中国松潘—甘孜造山带的造山过程. 北京:地质出版社. |
| [84] | 薛光琦, 钱辉, 姜枚等. 2003. 青藏高原东北部天然地震探测与岩石圈深部特征. 地球学报, 24(1):19-26. |
| [85] | 杨金玉, 张训华, 张菲菲等. 2012. EGM2008地球重力模型数据在中国大陆地区的精度分析. 地球物理学进展, (4):1298-1306, doi:10.6038/j.issn.1004-2903.2012.04.003 |
| [86] | 杨晓松, 金振民, 马瑾等. 2002. 青藏高原北部异常SKS分裂成因的初步探讨——被熔体强化的岩石圈各向异性. 地球物理学报, 45(6):821-831. |
| [87] | 喻学惠, 莫宣学, 赵志丹等. 2009. 甘肃西秦岭两类新生代钾质火山岩:岩石地球化学与成因. 地学前缘, 16(2):79-89. |
| [88] | 章传银, 郭春喜, 陈俊勇等. 2009. EGM 2008地球重力场模型在中国大陆适用性分析. 测绘学报, 38(4):283-289. |
| [89] | 张国伟, 郭安林, 姚安平. 2004. 中国大陆构造中的西秦岭—松潘大陆构造结. 地学前缘, 11(3):23-32. |
| [90] | 张乐天, 金胜, 魏文博等. 2012. 青藏高原东缘及四川盆地的壳幔导电性结构研究. 地球物理学报,55(12):4126-4137, doi:10.6038/j.issn.0001-5733.2012.12.025. |
| [91] | 赵国泽, 汤吉, 詹艳等. 2004. 青藏高原东北缘地壳电性结构和地块变形关系的研究. 中国科学(D辑:地球科学), 48(10):908-918. |
 2016, Vol. 59


