2. 山东省地震局, 济南 250000;
3. 中国地震局地壳应力研究所(地壳动力学重点实验室), 北京 100085
2. Earthquake Administration of Shandong Province, Ji'nan 250000, China;
3. Key Laboratory of Crustal Dynamics, Institute of Crustal Dynamics, Chinese Earthquake Administration, Beijing 100085, China
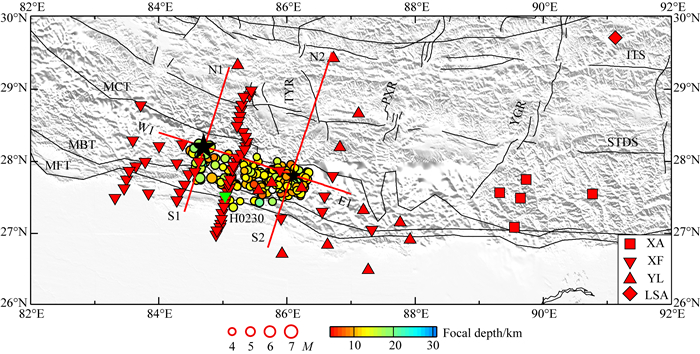
2015年4月25日,尼泊尔发生MS8.1强烈地震,震中位置为28.2°N、84.7°E,至5月6日已造成7566人死亡,超过14500人受伤(张广伟和雷建设, 2015),因此该地震的发震机理引起国际地学界的普遍关注.由于研究区结构的复杂性,国内外很多不同研究机构开展了尼泊尔MS8.1主震震源深度的研究工作.由于不同研究机构使用了不同的地震资料和研究方法,因此他们分别给出了各自的研究结果.中国地震台网给出的震源深度为20.0 km,USGS给出的初始震源深度为8.2 km (http://earthquake.usgs.gov/earthquakes/eventpage/us20002926#origin [2016-03-25]),Denolle等(2015)给出的震源深度为15.0 km,Bai等(2016)给出的震源深度为18.2 km.中等余震的震源机制解显示,6次地震有2个正断型、2个逆断型和2个走滑型,且这些地震分别处于不同构造部位,说明由于同震位移的影响和印度板块与欧亚板块的碰撞作用,地震发生后不同区域处于不同的应力状态(张广伟和雷建设, 2015).这与研究区地表分布有东西向的主前锋逆冲断裂(MFT)、藏南拆离系(STDS)、雅鲁藏布缝合带(ITS)及南北向的当惹-雍错裂谷带(TYR)、朋曲-申扎裂谷带(PXR)和亚东-谷露裂谷带(YGR)等地质构造特征(图 1)密切相关.印度板块和欧亚板块间的碰撞始于约55 Ma前,是导致现今青藏高原快速隆升的主要原因(Molnar and Tapponnier, 1975, 1981; England and Houseman, 1985;Craig et al., 2012).印度板块在青藏高原下方俯冲板片的几何形态与地壳细结构及相关动力学,一直是地球科学关注的焦点科学问题.地震层析成像和接收函数研究结果表明,印度板块已北向俯冲至青藏高原下方,其俯冲前沿可能已到达羌塘块体之下(Huang and Zhao, 2006; Li et al., 2008; Wei et al., 2012; Lei et al., 2014; Zhou and Lei, 2016),且已下倾至200 km深度(Kind et al., 2002; Kumar et al., 2006; Zhao et al., 2010),或在青藏高原东缘印度板块已俯冲至地幔转换带深度并形成大地幔楔结构(Lei et al., 2009; Lei and Zhao, 2016).这些研究工作中,大多研究者使用远震资料,虽然能够较好地反映地幔的结构特征,但对于地壳速度结构约束较弱,因此目前已有的地壳结构模型对于认识尼泊尔地震的发生机理受到一定制约.
|
图 1 尼泊尔地区主要构造及震中和所用台站分布图 黑色大五星为2015年4月25日尼泊尔MS8.1主震震中位置,黑色小五星为2015年5月12日尼泊尔MS7.5最大余震震中位置.其中,主震的定位结果采用Denolle等(2015)结果,而余震的定位结果采用Bai等(2016)结果.红色方形代表XA台网,红色倒三角代表XF台网,红色正三角代表YL台网,红色菱形代表LSA台,红色倒三角为图 2中所用台站,红线为图 10和图 11速度剖面位置.圆圈为尼泊尔主震的主要余震震中位置,其中不同颜色代表不同的震源深度,圆圈大小代表震级大小,其图标示于图底.MFT为主前锋逆冲断裂,MBT为主边界逆冲断裂,MCT为主中央逆冲断裂,STDS为藏南拆离系,ITS为雅鲁藏布缝合带,YGR为亚东-谷露裂谷带,PXR为朋曲-申扎裂谷带,TYR为当惹-雍错裂谷带. Fig. 1 Sketch map of regional tectonics, earthquake hypocenters and seismic stations used in the Nepal region The big black star is the epicenter of the 25 April 2015 MS8.1 Nepal earthquake, whereas the small black star is the epicenter of the 12 May 2015 MS7.5 largest aftershock. The mainshock location was determined by Denolle et al. (2015), whereas its aftershocks were relocated by Bai et al. (2016). The red squares denotes the seismic network XA, whereas the red inverted triangles denote the seismic network XF. The red triangles denote the seismic network YL, whereas the red diamond represents the seismic station LSA. The red inverted triangles indicate the seismic stations used in Fig. 2. The red lines indicate locations of velocity profiles in Figs. 10 and 11. The circles denote the major aftershocks of the Nepal mainshock, different colors and sizes of which represent different focal depths and magnitudes. Their scales are shown at the bottom. MFT, Main Frontal Thrust; MBT, Main Boundary Thrust; MCT, Main Central Thrust; STDS, Southern Tibet Detachment System; ITS, Indus-Tsangpo Suture; YGR, Yadong-Gulu Rift; PXR, Pumqu-Xainza Rift; TYR, Tangre-Yumco Rift. |
相对于传统的面波层析成像,地震背景噪声成像可以有效提高浅部结构的模型空间分辨率(Shapiro et al., 2005; Yao et al., 2006; Yang et al., 2007; 唐有彩等,2011; 范莉萍等,2015).本研究将尼泊尔地震震源区尽可能多的流动地震观测与长期观测的拉萨(LSA)固定台站的连续记录数据相结合,从地震背景噪声互相关函数中提取经验格林函数,获得尼泊尔地震地区5~25 s周期的瑞利波相速度分布,通过二维网格反演确定每个节点的纯路径频散曲线,然后反演每个节点下方的S波速度结构,进而得到该地区的三维S波速度结构.本研究获得的S速度模型,对于我们了解尼泊尔地震震源区的深部结构特征、孕震环境及青藏高原形成演化动力学过程都具有重要意义.
2 数据和方法本研究所用的数据主要来自4个台网,其中3个流动地震观测台网和1个固定台网,总共81个台站(图 1).第1个台网是XF (Nepal-Himalaya-Tibet Seismic Transect)宽频带流动地震观测台网,包含有56台;第2个台网是YL (Himalayan Nepal Tibet Experiment)宽频带流动地震观测台网,包含有19台;第3个台网是XA (Bhutan)宽频带流动地震观测台网,包含有5台;第4个台网是IC (New China Digital Seismograph Network)台网中的1个固定地震台站拉萨(LSA)台.依据噪声数据的连续性,其中XF台网的资料选取2002年10月-2003年12月期间的连续波形数据,YL台网的资料选取2001年10月-2003年4月期间的连续波形数据,XA台网的资料选取2002年1月-2002年12月期间的连续波形数据,LSA台的资料选取2001年10月-2003年12月期间的连续波形数据.为了保证数据具有较高的信噪比,最终选择叠加天数超过150天的台站对用于相速度频散曲线的提取.
地震背景噪声的数据处理主要采用Bensen等(2007)方法,主要分为4个步骤:(1) 单台数据预处理,主要包括数据重采样(1 Hz)、去均值、去倾斜分量和带宽为1.25~50 s的带通滤波、采用滑动绝对平均法进行时域归一化处理,其中时窗长度选取带通滤波最大周期的一半、频域谱白化、噪声数据的互相关计算与叠加;(2) 频散曲线的测量;(3) 二维相速度面波层析成像;(4) S波速度结构反演.
理论研究表明,在均匀散射场中任意两点之间的经验格林函数,可从这两点记录的位移互相关函数中提取出来(Stehly et al., 2008; Weaver, 2008).然而,实际噪声源的分布通常是不均匀的,因而得到的互相关波形的正负时间分量存在不对称现象,但我们可通过将互相关波形的正负分量取均值,可以得到正负半轴的“对称”分量,这样有利于提高互相关波形的信噪比(Lin et al., 2007).图 2为本研究提取到的H0230台与其他台站(如图 2所示)的互相关函数,可以看出它们具有较好的对称性和较高的信噪比.

|
图 2 H0230台与其他台的互相关函数 Fig. 2 Cross-correlations between seismic station H0230 and other stations |
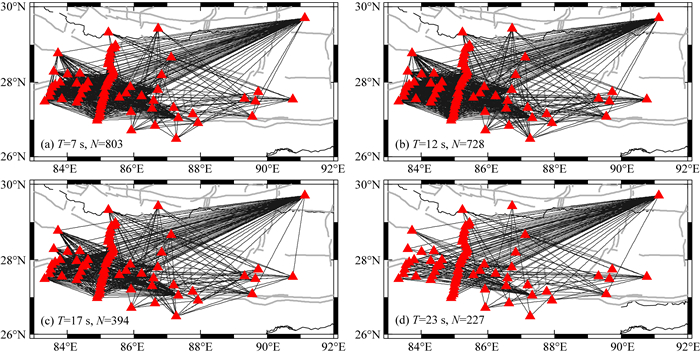
频散曲线的提取采用Yao等(2006)提出的一种基于图像分析技术的相速度频散曲线提取方法.为了确保相速度频散曲线的测量精度,我们选取信噪比(SNR)大于5的互相关波形资料用于频散曲线的提取,这里定义信噪比为信号窗口振幅最大值与噪声窗口振幅平均值的比值.为了满足远场面波格林函数的近似条件,选取台间距大于3个波长的记录.图 3为最终提取到的研究区内的全部频散曲线、不同周期相速度的平均值和标准差以及不同周期的射线路径数目.从图 3可以看出随着周期的增加,标准差逐渐增大,但最大标准差为0.1 km·s-1,因而可以保证反演结果的准确性.图 4给出了不同周期的相速度射线路径的分布,可以看出尽管随着周期的增加,射线数逐渐减少,但尼泊尔地震震源区的射线覆盖较为密集.另外,由于拉萨(LSA)台资料的使用,使得研究区内的射线交叉性覆盖得到了明显提高.

|
图 3 (a) 研究区内全部频散曲线;(b) 不同周期的平均相速度(黑色实线)及对应的标准差(红色误差棒);(c) 不同周期的射线路径数 Fig. 3 (a) All the dispersion curves; (b) The average phase velocity (black line) and its standard deviations (red error bars) at different periods; (c) The number of paths at different periods |
|
图 4 不同周期瑞利波相速度测量所用的射线路径(黑线) 红三角代表所用地震台站,灰色线为图 1所示的构造线,T为周期,N为射线路径数. Fig. 4 Ray paths (black lines) for Rayleigh phase velocity at different periods Red triangles denote seismic stations used, whereas gray lines denote tectonic lines as shown in Fig. 1. T is period, whereas N is the number of ray paths. |
为了验证层析成像所用资料的空间分辨能力,需开展分辨率测试实验.在实验中,不同周期采用不同的初始速度模型,在每个周期的平均相速度值上加正负5%的速度扰动量.图 5展示了不同周期检测板实验的输出结果,可以看出检测板实验的恢复结果与射线路径的分布有着直接关系.周期为7 s射线路径在尼泊尔震源区附近分布比较密集(图 4a),暗示尼泊尔震源区速度模型能够重建得较好(图 5a).周期为12 s和17 s的射线分布比较均匀(图 4b和图 4c),说明整个研究区的速度模型能够较好重建(图 5b和图 5c).由于周期为23 s的射线数量相对减少(图 4d),因此速度异常的恢复能力有所降低(图 5d).整体而言,根据目前所用资料,地壳模型的空间分辨率可以达到1.0°×1.0°(图 5).

|
图 5 波速异常尺度为1.0°×1.0°模型下的不同周期资料检测板测试结果 红色代表低波速异常,蓝色代表高波速异常,色标位于图底,T为所用资料周期.其他符号与图 1中的相同. Fig. 5 Results of checkerboard tests using the data at deferent periods in the model with a cell size of 1.0°×1.0° in velocity anomalies Red and blue colors denote low-and high-velocity anomalies, respectively, the scale of which is shown at the bottom. T is the period of the data used. The labeling is the same as that in Fig. 1. |
利用5~25 s周期的瑞利波相速度的频散曲线,采用Montagner (1986)发展的区域化反演算法对研究区域进行0.5°×0.5°的网格划分,该方法矩阵反演过程采用LU分解算法.依据检测板实验结果,平滑尺度选为100 km,最终得到周期5~25 s的瑞利波相速度扰动图像.尽管该方法可以同时反演各向同性介质速度的变化和方位各向异性,但本文仅将各向同性介质的速度作为未知参数进行反演.
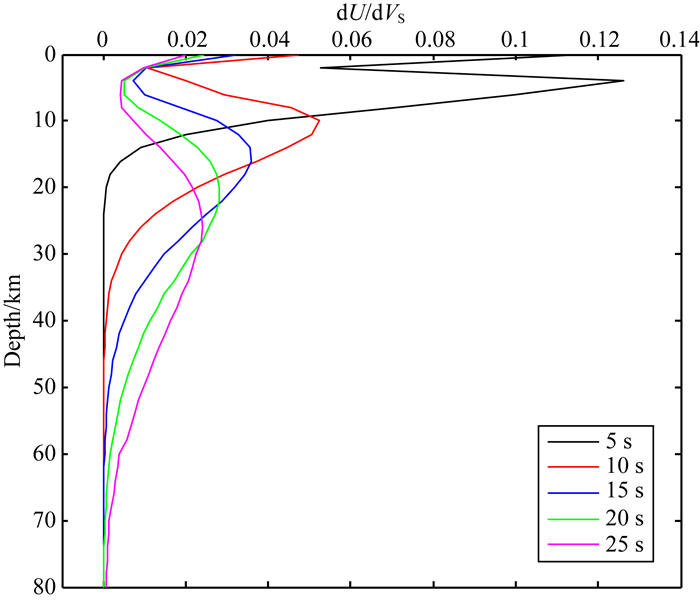
由于瑞利面波的频散特征,不同周期的瑞利面波反映不同深度范围的S波速度特征.图 6为不同周期瑞利面波相速度对S波的深度敏感核.基阶瑞利面波相速度对大约1/3波长深度附近介质的S波速度结构最为敏感,因此较短周期资料基本反映了浅部结构的变化特征.然而,随着周期的增加,资料所反映的深度逐渐增加,但其垂向分辨率却逐渐降低.由图 6可以看出,周期5~25 s的相速度值基本可以反映40 km深度以上的速度结构特征.
|
图 6 不同周期瑞利面波相速度对S波的深度敏感核 Fig. 6 Depth sensitivity kernels of Rayleigh wave phase velocity at different periods |
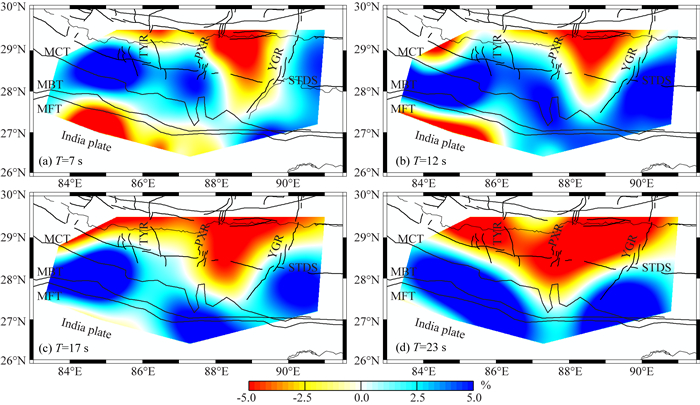
图 7为不同周期二维瑞利波相速度分布图,可以看出周期为7 s的相速度资料基本反映了浅部速度结构.在俯冲板块前沿,MFT以南地区表现为低波速异常,在MFT和STDS之间的区域表现为高波速异常,南北向裂谷YGR呈现为高低波速异常过渡带.周期为12 s和17 s的相速度资料主要反映了中上地壳的速度变化,随着周期的增加,俯冲板块前沿的MFT以南地区逐渐由低波速异常转变为高波速异常,南北向裂谷YGR依然表现为高低波速异常过渡区.周期为23 s的相速度资料主要反映中地壳的速度变化特征,整体表现出与印度板块俯冲相关的结构特征,在俯冲板块前沿的STDS以南地区表现为高波速异常,而以北地区的南北向裂谷区域则表现为明显低波速异常,可能由于印度板块北向俯冲致板块前沿的热物质上涌到达地壳深度使地壳物质产生部分熔融或上涌热物质携带有深部流体作用.
|
图 7 不同周期二维瑞利波相速度分布 红色和蓝色分别代表低波速和高波速异常,色标位于图底.T为所用的周期.其他符号与图 1中的相同. Fig. 7 Maps of 2-D Rayleigh-wave phase velocities at different periods Red and blue colors denote low-and high-velocity anomalies, respectively, the scale of which is shown at the bottom. T is the period of the data used. The labeling is the same as that in Fig. 1. |
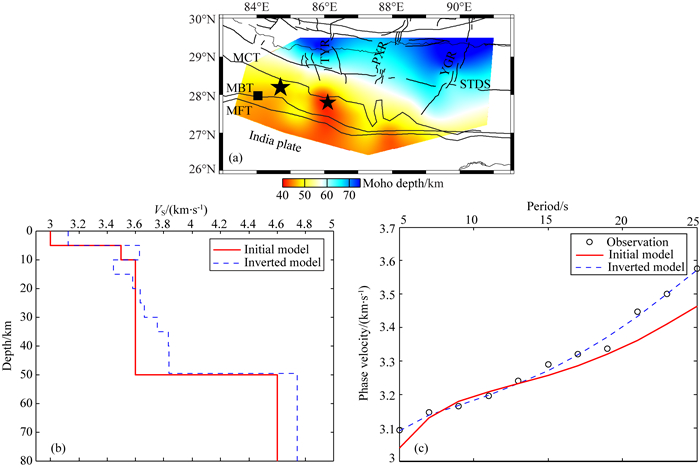
面波频散主要对横波速度比较敏感,对纵波速度和介质密度敏感程度相对较弱.本文对研究区域进行0.5°×0.5°的网格划分,采用NA算法反演二维网格每个节点下方不同深度的S波速度结构(Yao et al., 2008),初始速度模型参考前人的研究(Yang et al., 2012; Rapine et al., 2003),详细参数如表 1所示.反演过程中采用接收函数结果(Li et al., 2014) (图 8a)对Moho面深度进行约束.
|
|
表 1 初始速度模型及每层速度扰动范围 Table 1 The initial velocity model and its velocity perturbation range in each layer |
|
图 8 (a) 初始Moho面深度分布; (b) 图(a)所示节点(黑色方块, 84°E, 28°N)的初始与反演获得的S波速度模型; (c) 相应节点不同周期的观测与拟合频散曲线 Fig. 8 (a) The distribution of the initial Moho depth; (b) Initial and inverted S-wave speed models at the grid node (84°E, 28°N) as shown in (a); (c) Observed and synthetic Rayleigh-wave phase velocity dispersion curves for different periods at the corresponding grid node |
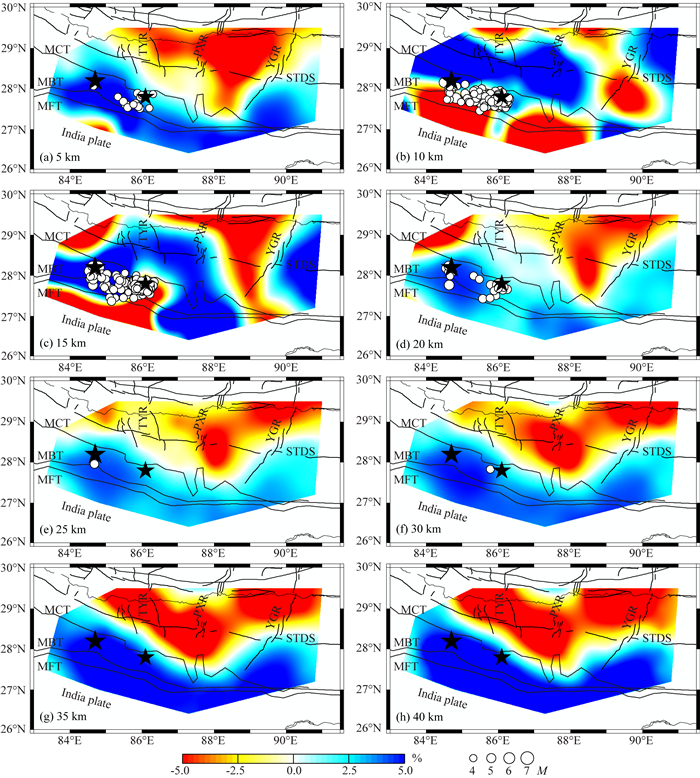
在本研究中,首先依次反演每个节点随深度变化的速度模型.图 8b给出了研究区内节点(84°E, 28°N)的初始速度模型和相应的反演结果,并依赖于该反演结果拟合出频散曲线.由图 8c可以看出,周期为7~15 s的拟合频散曲线最接近于观测曲线,其差值在0.01 km·s-1左右,而周期大于15 s的频散曲线拟合得略差些,但观测与拟合之间的最大差值仍不大于0.1 km·s-1.这些结果表明,本节点下方的速度模型比较可靠.然后,将不同节点下方的S波速度结构进行插值,最终获得三维速度模型(图 9和图 10).结果显示,无论是在横剖面上还是纵剖面上,尼泊尔地震震源区不同深度的S波速度结构具有强烈的横向不均匀性.这些不均匀性较好地反映了浅部构造的相关性和强震震源区的结构特征.
|
图 9 不同深度S波速度结构 红色代表低波速异常,而蓝色代表高波速异常.白色圆圈代表 2015年尼泊尔地震地区的主要余震分布,其圆圈大小代表震级.速度扰动及地震震级图例位于图下方.大星号代表 2015年尼泊尔主震震中位置,而小星号代表其7.5级最大余震震中.其他符号与图 1相同. Fig. 9 S-wave velocity structures at different depths Red and blue colors denote low-and high-velocity anomalies, respectively. White circles denote major aftershocks of the 2015 Nepal earthquake area, the size of which denotes earthquake magnitude. The scales for velocity and earthquake magnitude are shown at the bottom. The big star denotes the epicenter of the 2015 Nepal mainshock, whereas the small star denotes that of the MS7.5 largest aftershock. The other labeling is the same as that in Fig. 1. |

|
图 10 S波速度结构纵剖面图(剖面位置见图 1) 红色代表低波速异常,而蓝色代表高波速异常.大星号代表2015年尼泊尔主震,小星号代表7.5级最大余震,圆圈代表距离剖面60 km范围内余震.主震的震源深度采用Denolle等(2015)结果,震源深度为15.0 km.余震的震源深度采用Bai等(2016)重定位的结果,最大余震的震源深度为19.5 km.速度扰动色标及余震图例位于图底.图顶部灰色多边形为沿剖面地形.MFT为主前锋逆冲断裂,MBT为主边界逆冲断裂,MCT为主中央逆冲断裂,MHT为主喜马拉雅逆冲断裂,STDS为藏南拆离系. Fig. 10 Vertical cross-sections of S-wave velocity structures (see Fig. 1 for locations of cross-sections) Red and blue colors denote low-and high-velocities, respectively. The big and small stars denote the 2015 Nepal mainshock and its MS7.5 largest aftershock. The circles denote the aftershocks within the range of 60 km off the profile. The mainshock focal depth, 15.0 km, was from Denolle et al. (2015), whereas aftershocks are relocated by Bai et al. (2016), and the focal depth of its largest aftershock is 19.5 km. The pologies at the top of each profile are topography along the profile. MFT, Main Frontal Thrust; MBT, Main Boundary Thrust; MCT, Main Central Thrust; MHT, Main Himalayan Thrust; STDS, Southern Tibet Detachment System. |
5 km深度的S波速度结构(图 9a)主要反映浅部地壳的速度结构.MCT以北及南北向裂谷TYR和PXR地区表现为低波速异常,这与Sheehan等(2008)给出的区域地震层析成像的结果较为一致.在MCT附近及以南地区表现为高波速异常,南北向裂谷YGR表现为高低波速异常过渡区.大部分余震活动主要分布于相对高波速异常区域内.
10 km和15 km深度的S波速度结构(图 9b, 9c)主要反映上地壳的速度结构.由10 km深度的S波速度结构可以看出,MBT或MCT以南地区表现为明显低波速异常,可能反映了主喜马拉雅滑脱断裂带(MHT)主要结构特征,MBT或MCT与STDS之间区域为高波速异常,而南北向裂谷PXR和TYR的速度结构特征不明显.在15 km深度,MFT以南地区表现为低波速异常区域有所减小,MFT和STDS之间表现为高波速异常有所扩展,南北向裂谷YGR处于高低波速异常过渡区.主震和最大余震发生于高低波速异常过渡区偏向高波速异常区(图 9b和图 9c),大多数余震发生于波速变化明显区(图 9a-9c).
20~40 km深度的S波速度结构(图 9d-9h)主要反映中地壳的S波速度结构变化,这些变化展示出与印度板块俯冲相关的深部结构特征.在MCT附近及以南地区主要表现为与俯冲印度板块相关的高波速异常,而在MCT以北地区南北向裂谷YGR在20 km深度上主要表现为高低波速异常过渡区,并且随着深度的增加,低波速异常强度有所增加,空间范围有所加大,以致于低波速异常连成明显的东西向条带,可能暗示出其下方地幔存在强烈热物质的上涌或深部流体作用,这与Jiang等(2011)的研究结果相类似,这些结构特征可能一定程度上反映了青藏高原南部受印度板块南北向强烈碰撞挤压,在板块俯冲前缘形成部分熔融的高温低密度物质上涌有关(王椿镛等, 2014; Liang et al., 2008).
为了更加清楚显示尼泊尔地震地区深部的S波速度结构及其与地震发震关系,图 10给出3条剖面的S波速度结构图像,剖面位置如图 1所示.剖面S1N1、S2N2均是由印度板块经尼泊尔到达我国西藏的南北向剖面,其中剖面S1N1和S2N2分别穿过尼泊尔主震和7.5级最大余震震中位置.这两个剖面的速度结构虽然存在很多细节差别,但主要的结构特征相类似:在印度板块和西藏块体下方的上地壳,主中央断裂带(MCT)以北地区表现为高速区,其以南地区存在一低速薄层(图 10a, 10b),可能代表了MHT的结构特征;中地壳的速度结构特征与上地壳相反,即在STDS附近及以南区域表现均存在明显高波速异常,可能代表俯冲的印度板块,而以北地区为明显低波速异常(图 10a, 10b),主要与地幔热物质上涌至地壳引起地壳物质部分熔融或深部物质上涌所携带的流体作用有关.
尼泊尔主震和最大余震发生于高低波速异常过渡区偏向高波速异常体内(图 10),说明这些地区易于积累能量形成大震,而其他余震主要发生于波速变化最为明显的地区.这些结果说明,速度结构对地震的发生具有一定的控制作用.对比体波层析成像结果(Wei and Zhao, 2016),可以看出主震发生于相对强的高波速异常过渡区,而最大余震发生于更加明显的高低波速异常过渡带附近,主震和最大余震的南侧表现为相对低波速异常,与本文的结果比较类似,但与Guo等(2009)的结果存在差异.Guo等(2009)结果表明,MCT以南地区从浅部地壳至中上地壳一直呈现为低波速异常,而本文结果表明仅在浅部地壳存在一低波速异常层.在40 km深度,Wei等(2016)的结果显示印度板块的俯冲前沿区域主要表现为高波速异常,与本文结果一致.尼泊尔主震及最大余震所在深度的南部区域存在低速层,说明尼泊尔强震的发生可能与深部流体或地壳部分熔融作用于断裂带密切相关.由东西向剖面(图 10c)同样可以看出,主震和最大余震发生于高低波速异常过渡区偏向高波速异常,且主震与最大余震之间也存在着低波速异常条带,这种结构特征与余震分布模式基本一致,说明速度结构的确对地震的发生起着重要的控制作用.
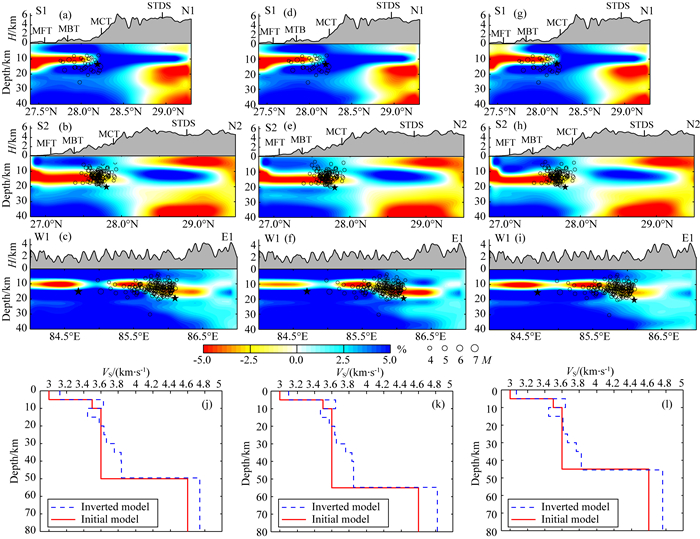
5 讨论 5.1 莫霍面变化对成像结果的影响作用由于印度板块和青藏高原的挤压碰撞作用,使得研究区Moho面起伏变化较大,而面波频散数据对于速度间断面的约束不够.因此,在反演过程中我们采用接收函数研究结果对Moho面的深度进行约束.为了检测Moho面深度不确定性对反演结果的影响作用,我们开展了很多通过改变莫霍面深度的速度结构反演测试.由于篇幅的原因,这里仅展示将Moho面深度分别上下浮动5 km后并在其他参数保持不变情况下反演获得的S波速度结构(图 11).由图可知,Moho面深度扰动后的结果(图 11d-11i)与未扰动的结果(图 11a-11c)尽管在异常幅值上略有差别,但在异常的空间分布模式上基本保持一致.为进一步了解不同莫霍面情况下反演结果的细节,本文也展示出单个节点的反演结果(图 11j-11l),可以看到该节点Moho面深度上下扰动5 km后展示出相对于未扰动情况下有微小速度值上的差异,但结构随深度变化的基本特征没有变化.因此,本文所用的莫霍面埋深获得的S波成像结果的主要结构特征是可靠的.
|
图 11 Moho面变化对S波成像结果的影响 (a-c) 图 8a所示Moho面情况下的反演结果;(d-f)与(a-c)相同但莫霍面增加5 km;(g-i)与(a-c)相同但莫霍面减少5 km.其他符号与图 10相同;(j-l)节点(84°E, 28°N)在图 8a所示的Moho面、增加和减少5 km的反演结果.红色实线为初始速度模型,蓝色虚线为反演得到的速度模型. Fig. 11 Effects of the Moho variations on S-wave tomographic images (a-c) S-wave velocity structures for the Moho depth as shown in Fig. 8a; (d-f) The same as (a-c) but for the Moho depth increased by 5 km; (g-i) The same as (a-c) but for the Moho depth decreased by 5 km. The labeling is the same as that in Fig. 10; (j-l) S-wave velocity models at the grid point (84°E, 28°N) for the Moho depth as shown in Fig. 8a, that increased by 5 km and that decreased by 5 km. The red line represents the initial velocity model, whereas the blue dash line marks the inverted velocity model. |
印度板块与欧亚板块陆陆碰撞和挤压,造成喜马拉雅地区地壳缩短和岩石圈增厚.尼泊尔地区低喜马拉雅的变形表明,南北向地壳缩短速率为21 mm·a-1左右,应力非常集中,青藏高原南缘的喜马拉雅构造带是地震活动比较活跃的地区(邓起东等, 2014),而青藏高原南部地区次级断块内部发育有多条南北向裂谷,表明该地区受南北向挤压和东西向拉张共同作用的影响.这些构造活动特征得到震源机制结果的证实,在印度板块与欧亚板块的碰撞边缘地区主要以逆冲断层为主,而在南北向裂谷区域则以正断层为主(Liang et al., 2008; 张广伟和雷建设, 2015).
依据青藏高原南部花岗岩和钾质火山岩的分布情况,认为青藏高原下方存在以下3种可能的地壳熔融(Zhang et al., 2014):(1) 陆陆碰撞导致的地壳熔融;(2) 由软流圈上涌和地幔减薄引起的地壳熔融;(3) 俯冲的印度板块的破裂导致下地壳部分熔融.由本研究的层析成像结果可以看出,在20~40 km深度MCT以北的南北向裂谷区主要表现为低波速异常,且随深度的增加其空间范围逐渐加大,可能暗示了与青藏高原南部花岗岩和钾质火山岩相关的地壳熔融和印度岩石圈破裂引起上地幔热物质上涌有关,南北向裂谷为热物质上涌提供了良好的物质通道(Nelson et al., 1996).以往的层析成像研究结果(Ren and Shen, 2008; Hung et al., 2010; Jiang et al., 2011; Liang et al., 2011)也支持此观点,即青藏高原南部地区存在多处低波速异常,可能是由于印度板块北向俯冲时受东西向拉张作用而产生破裂,导致地幔热物质沿南北向裂谷挤出,而热物质的上涌使得中上地壳物质产生部分熔融,同时上涌热物质还可能携带有深部流体.
5.3 速度结构与强震发生本文研究显示出MFT以南地区的上地壳深度存在明显低速层(图 9b, 9c和10a, 10b),这得到接收函数结果在印度板块和青藏高原碰撞带附近的上地壳存在低速层(Schulte-Pelkum et al., 2005)和在碰撞带前沿表现为高波速比异常的成像结果(Monsalve et al., 2008)的支持.壳内低速层的存在常常与强震的发生有着密切联系.Zhao等(2002)发现1885到1999年间发生在日本岛内的地壳强震(M5.7~8.0)几乎都位于由地震层析成像所揭示的低波速与高波速异常的边界上.2001年印度普杰7.6级地震发生在高波速异常区,而其下方存在低波速异常(Mishra and Zhao, 2003).1976年唐山7.8级地震震源区位于高波速异常区,而其下方存在明显低波速异常(Lei et al., 2008).2008年汶川MS8.0级强震发生在龙门山断裂带高波速异常边缘,其下方存在明显低速高泊松比异常(Lei and Zhao, 2009; Wang et al., 2010).
在震源深度上,不同研究机构给出的结果存在一定差别.由于中国地震台网给出的20.0 km深度和USGS给出的8.2 km深度均由走时资料确定,因此其均反映了震源起始破裂的深度,但两者之间的差别可能反映了其所用资料和速度模型的差别.中国地震台网主要使用中国区域地震台网地震资料和区域速度模型,而USGS定位所用地震资料为全球远震资料和全球平均速度模型.Bai等(2016)在全球资料基础上增加了距离主震震中约100 km左右的我国境内流动地震观测资料,认为主震的最佳深度为18.5 km.Denolle等(2015)增加深度震相通过全局张量(GCMT)反演,认为主震震源深度为15.0 km,反映了主震破裂的质心深度.本文认为大震破裂的质心深度能较客观地反映其震源深度,因此本文主震的震源深度采用全局张量反演结果的震源深度15.0 km,而余震采用Bai等(2016)的双差定位结果.
从S波速度结构(图 9和图 10)可以看出,主震和最大余震发生在高低波速异常过渡区偏向高波速异常区,震源区以南存在明显低波速异常,接收函数结果(Schulte-Pelkum et al., 2005;Caldwell et al., 2013)和大地电磁(MT)结果(Lemonnier et al., 1999;Rawat et al., 2014)也展示出该区域的中上地壳存在低速高导层,对应了MHT断裂带,可能暗示出震源区附近存在部分熔融或流体作用,这种部分熔融或流体作用会大大增加孔隙压力,减小MHT断裂带的摩擦系数,降低断层面的有效正应力(Lei and Zhao, 2009; Arora et al., 2016),从而在断层面上剪应力加大情况下有利于断层错动引起地震的发生(Lei and Zhao, 2009).地震定位结果(Bai et al., 2016)及地震地质野外调查结果(杨晓平等, 2016)推测尼泊尔MS8.1强震可能位于MHT凹凸体中,而凹凸体往往是应力集中和大地震发生的主要区域(姚华建和尹九洵,2015).主震区域具有一定高波速异常体,可能更有利于更大应力的积累.主震与最大余震之间的多数余震处于波速变化最为明显之处,说明速度结构对地震的发生具有一定控制作用.
6 结语本研究利用2001-2003年期间2015年4月12日尼泊尔MS8.1地震震源区附近尽可能多的流动地震观测资料,通过背景噪声成像技术获得了研究区三维S波速度精细结构.结果显示,在上地壳大致以MFT或MBT为界,其以南地区存在明显低波速异常条带,其以北地区存在明显高波速异常;在中地壳大致以STDS为界,其以南地区为明显高波速异常,而以北地区为明显低波速异常.这些结构特征说明,由于印度板块的北向俯冲挤压,可能会造成地幔热物质的上涌而引起地壳部分熔融或流体作用.2015年4月12日主震和最大余震处于高低波速异常过渡区偏于高波速异常区,说明这些地区易于积累能量孕育强震,而震源区附近的低波速异常暗示出流体或部分熔融作用于MBT附近的MHT断裂带,从而降低了断层面上的有效正应力;主震与最大余震之间的余震也处于波速异常变化明显的地区,说明该地区地震的发生可能受震源区附近速度不均匀性的构造所控制.
| Arora B R, Bansal B K, Prajapati S K, et al. 2016. Seismotectonics and seismogenesis of MW7.8 Gorkha earthquake and its aftershocks. Journal of Asian Earth Sciences. DOI:10.1016/j.jseaes.2016.07.018 | |
| Bai L, Liu H B, Ritsema J, et al. 2016. Faulting structure above the Main Himalayan Thrust as shown by relocated aftershocks of the 2015 MW7.8 Gorkha, Nepal, earthquake. Geophysical Research Letters, 43(2): 637-642. | |
| Bensen G D, Ritzwoller M H, Barmin M P, et al. 2007. Processing seismic ambient noise data to obtain reliable broad-band surface wave dispersion measurements. Geophysical Journal International, 169(3): 1239-1260. DOI:10.1111/gji.2007.169.issue-3 | |
| Caldwell W B, Klemperer S L, Lawrence J F, et al. 2013. Characterizing the Main Himalayan Thrust in the Garhwal Himalaya, India with receiver function CCP stacking. Earth and Planetary Science Letters, 367: 15-27. DOI:10.1016/j.epsl.2013.02.009 | |
| Craig T J, Copley A, Jackson J. 2012. Thermal and tectonic consequences of India underthrusting Tibet. Earth and Planetary Science Letters, 353-354: 231-239. DOI:10.1016/j.epsl.2012.07.010 | |
| Deng Q D, Cheng S P, Ma J, et al. 2014. Seismic activities and earthquake potential in the Tibetan Plateau. Chinese J. Geophys., 57(7): 2025-2042. DOI:10.6038/cjg20140701 | |
| Denolle M A, Fan W Y, Shearer P M. 2015. Dynamics of the 2015 M7.8 Nepal earthquake. Geophysical Research Letters, 42(18): 7467-7475. DOI:10.1002/2015GL065336 | |
| England P, Houseman G. 1985. Role of lithospheric strength heterogeneities in the tectonics of Tibet and neighbouring regions. Nature, 315(6017): 297-310. DOI:10.1038/315297a0 | |
| Fan L P, Wu J P, Fang L H, et al. 2015. The characteristic of Rayleigh wave group velocities in the southeastern margin of the Tibetan Plateau and its tectonic implications. Chinese J. Geophys., 58(5): 1555-1567. DOI:10.6038/cjg20150509 | |
| Guo Z, Gao X, Yao H J, et al. 2009. Midcrustal low-velocity layer beneath the central Himalaya and southern Tibet revealed by ambient noise array tomography. Geochemistry Geophysics Geosystems, 10: Q05007. DOI:10.1029/2009GC002458 | |
| Huang J L, Zhao D P. 2006. High-resolution mantle tomography of China and surrounding regions. Journal of Geophysical Research, 111: B09305. DOI:10.1029/2005JB004066 | |
| Hung S H, Chen W P, Chiao L Y, et al. 2010. First multi-scale, finite-frequency tomography illuminates 3-D anatomy of the Tibetan Plateau. Geophysical Research Letter, 37: L06304. DOI:10.1029/2009GL041875 | |
| Jiang M M, Zhou S Y, Sandvol E, et al. 2011. 3-D lithospheric structure beneath southern Tibet from Rayleigh-wave tomography with a 2-D seismic array. Geophysical Journal International, 185(2): 593-608. DOI:10.1111/gji.2011.185.issue-2 | |
| Kind R, Yuan X, Saul J, et al. 2002. Seismic images of crust and upper mantle beneath Tibet: Evidence for Eurasian plate subduction. Science, 298(5596): 1219-1221. DOI:10.1126/science.1078115 | |
| Kumar P, Yuan X H, Kind R, et al. 2006. Imaging the colliding Indian and Asian lithospheric plates beneath Tibet. Journal of Geophysical Research, 111: B06308. DOI:10.1029/2005JB003930 | |
| Lei J S, Xie F R, Lan C X, et al. 2008. Seismic images under the Beijing region inferred from P and PmP data. Physics of the Earth and Planetary Interiors, 168(3-4): 134-146. DOI:10.1016/j.pepi.2008.06.005 | |
| Lei J S, Zhao D P. 2009. Structural heterogeneity of the Longmenshan fault zone and the mechanism of the 2008 Wenchuan earthquake (MS8.0). Geochemistry Geophysics Geosystems, 10(10): Q10010. DOI:10.1029/2009GC002590 | |
| Lei J S, Zhao D P, Su Y J. 2009. Insight into the origin of the Tengchong intraplate volcano and seismotectonics in southwest China from local and teleseismic data. Journal of Geophysical Research, 114: B05302. DOI:10.1029/2008JB005881 | |
| Lei J S, Li Y, Xie F R, et al. 2014. Pn anisotropic tomography and dynamics under eastern Tibetan plateau. Journal of Geophysical Research, 119(3): 2174-2198. | |
| Lei J S, Zhao D P. 2016. Teleseismic P-wave tomography and mantle dynamics beneath Eastern Tibet. Geochemistry Geophysics Geosystems, 17(5): 1861-1884. DOI:10.1002/ggge.v17.5 | |
| Lemonnier C, Marquis G, Perrier F, et al. 1999. Electrical structure of the Himalaya of Central Nepal: High conductivity around the mid-crustal ramp along the MHT. Geophysical Research Letters, 26(21): 3261-3264. DOI:10.1029/1999GL008363 | |
| Li C, van der Hilst R D, Meltzer A S, et al. 2008. Subduction of the Indian lithosphere beneath the Tibetan Plateau and Burma. Earth and Planetary Science Letters, 274(1-2): 157-168. DOI:10.1016/j.epsl.2008.07.016 | |
| Li Y H, Gao M T, Wu Q J. 2014. Crustal thickness map of the Chinese mainland from teleseismic receiver functions. Tectonophysics, 611: 51-60. DOI:10.1016/j.tecto.2013.11.019 | |
| Liang X F, Zhou S Y, Chen Y J, et al. 2008. Earthquake distribution in southern Tibet and its tectonic implications. Journal of Geophysical Research, 113: B12409. DOI:10.1029/2007JB005101 | |
| Liang X F, Shen Y, Chen Y J, et al. 2011. Crustal and mantle velocity models of southern Tibet from finite frequency tomography. Journal of Geophysical Research, 116: B02408. DOI:10.1029/2009JB007159 | |
| Lin F C, Ritzwoller M H, Townend J, et al. 2007. Ambient noise Rayleigh wave tomography of New Zealand. Geophysical Journal International, 170(2): 649-666. DOI:10.1111/gji.2007.170.issue-2 | |
| Mishra O P, Zhao D P. 2003. Crack density, saturation rate and porosity at the 2001 Bhuj, India, earthquake hypocenter: A fluid-driven earthquake?. Earth and Planetary Science Letters, 212(3-4): 393-305. DOI:10.1016/S0012-821X(03)00285-1 | |
| Molnar P, Tapponnier P. 1975. Cenozoic tectonics of Asia: Effects of a continental collision. Science, 189(4201): 419-425. DOI:10.1126/science.189.4201.419 | |
| Molnar P, Tapponnier P. 1981. A possible dependence of tectonic strength on the age of the crust in Asia. Earth and Planetary Science Letters, 52(1): 107-114. DOI:10.1016/0012-821X(81)90213-2 | |
| Monsalve G, Sheehan A, Rowe C, et al. 2008. Seismic structure of the crust and the upper mantle beneath the Himalayas: Evidence for eclogitization of lower crustal rocks in the Indian Plate. Journal of Geophysical Research, 113: B08315. DOI:10.1029/2007JB005424 | |
| Montagner J P. 1986. Regional three-dimensional structures using long-period surface waves. Annales Geophysicae, 4: 283-294. | |
| Nelson K D, Zhao W J, Brown L D, et al. 1996. Partially molten middle crust beneath southern Tibet: synthesis of Project INDEPTH results. Science, 274(5293): 1684-1688. DOI:10.1126/science.274.5293.1684 | |
| Rapine R, Tilmann F, West M, et al. 2003. Crustal structure of northern and southern Tibet from surface wave dispersion analysis. Journal of Geophysical Research, 108(B2): 2120. DOI:10.1029/2001JB000445 | |
| Rawat G, Arora B R, Gupta P K. 2014. Electrical resistivity cross-section across the Garhwal Himalaya: Proxy to fluid-seismicity linkage. Tectonophysics, 637: 68-79. DOI:10.1016/j.tecto.2014.09.015 | |
| Ren Y, Shen Y. 2008. Finite frequency tomography in southeastern Tibet: evidence for the causal relationship between mantle lithosphere delamination and the north-south trending rifts. Journal of Geophysical Research, 113: B10316. DOI:10.1029/2008JB005615 | |
| Schulte-Pelkum V, Monsalve G, Sheehan A, et al. 2005. Imaging the Indian subcontinent beneath the Himalaya. Nature, 435(7046): 1222-1225. DOI:10.1038/nature03678 | |
| Shapiro N M, Campillo M, Stehly L, et al. 2005. High-resolution surface-wave tomography from ambient seismic noise. Science, 307(5715): 1615-1618. DOI:10.1126/science.1108339 | |
| Sheehan A F, de la Torre T L, Monsalve G, et al. 2008. Earthquakes and crustal structure of the Himalaya from the Himalayan Nepal Tibet seismic experiment (HIMNT). Journal of the Nepal Geological Society, 38: 1-8. | |
| Stehly L, Campillo M, Froment B, et al. 2008. Reconstructing Green's function by correlation of the coda of the correlation (C3) of ambient seismic noise. Journal of Geophysical Research, 113(B11): B11306. DOI:10.1029/2008JB005693 | |
| Tang Y C, Chen Y S, Yang Y J, et al. 2011. Ambient noise tomography in North China craton. Chinese J. Geophys., 54(8): 2011-2022. DOI:10.3969/j.issn.0001-5733.2011.08.008 | |
| Wang C Y, Chang L J, Ding Z F, et al. 2014. Upper mantle anisotropy and crust-mantle deformation pattern beneath the Chinese mainland. Science China: Earth Sciences, 57(1): 132-143. DOI:10.1007/s11430-013-4675-5 | |
| Wang Z, Zhao D P, Wang J. 2010. Deep structure and seismogenesis of the north-south seismic zone in southwest China. Journal of Geophysical Research, 115: B12334. DOI:10.1029/2010JB007797 | |
| Weaver R L. 2008. Ward identities and the retrieval of Green's function in the correlations of a diffuse field. Wave Motion, 45(5): 596-604. DOI:10.1016/j.wavemoti.2007.07.007 | |
| Wei W, Xu J D, Zhao D P, et al. 2012. East Asia mantle tomography: New insight into plate subduction and intraplate volcanism. Journal of Asian Earth Sciences, 60: 88-103. DOI:10.1016/j.jseaes.2012.08.001 | |
| Wei W, Zhao D P. 2016. Tomography of the source zone of the 2015 M7.8 Nepal earthquake. Physics of the Earth and Planetary Interiors, 253: 58-63. DOI:10.1016/j.pepi.2016.01.008 | |
| Yang X P, Wu G, Chen L C, et al. 2016. The seismogenic structure of the April 25, 2015 MW7.8 Nepal earthquake in the southern margin of Qinghai-Tibetan Plateau. Chinese J. Geophys., 59(7): 2528-2538. DOI:10.6038/cjg20160718 | |
| Yang Y J, Ritzwoller M H, Levshin A L, et al. 2007. Ambient noise Rayleigh wave tomography across Europe. Geophysical Journal International, 168(1): 259-274. DOI:10.1111/gji.2007.168.issue-1 | |
| Yang Y J, Ritzwoller M H, Zheng Y, et al. 2012. A synoptic view of the distribution and connectivity of the mid-crustal low velocity zone beneath Tibet. Journal of Geophysical Research, 117: B04303. DOI:10.1029/2011JB008810 | |
| Yao H J, van der Hilst R D, de Hoop M V. 2006. Surface-wave array tomography in se Tibet from ambient seismic noise and two-station analysis-Ⅰ. phase velocity maps. Geophysical Journal International, 166(2): 732-744. DOI:10.1111/gji.2006.166.issue-2 | |
| Yao H J, Caroline B, van der Hilst R D. 2008. Surface wave array tomography in SE Tibet from ambient seismic noise and two-station analysis-Ⅱ. Crustal and upper-mantle structure. Geophysical Journal International, 173(1): 205-219. DOI:10.1111/gji.2008.173.issue-1 | |
| Yao H J, Yin J X. 2015. Tectonic characteristics of the Himalaya orogenic belt and the 2015 MW7.8 Nepal earthquake. Chinese Science Bulletin, 60(27): 2656-2658. | |
| Zhang G W, Lei J S. 2015. Focal mechanism solutions of moderate-sized aftershocks of the 2015 MS8.1 Nepal earthquake. Chinese J. Geophys., 58(11): 4298-4304. DOI:10.6038/cjg20151134 | |
| Zhang X M, Teng J W, Sun R M, et al. 2014. Structural model of the lithosphere-asthenosphere system beneath the Qinghai-Tibet Plateau and its adjacent areas. Tectonophysics, 634: 208-226. DOI:10.1016/j.tecto.2014.08.017 | |
| Zhao D P, Mishra O P, Sanda R. 2002. Influence of fluids and magma on earthquakes: Seismological evidence. Physics of the Earth and Planetary Interiors, 132(4): 249-267. DOI:10.1016/S0031-9201(02)00082-1 | |
| Zhao J M, Yuan X H, Liu H B, et al. 2010. The boundary between the Indian and Asian tectonic plates below Tibet. Proceedings of the National Academy of Sciences of the United States of America, 107(25): 11229-11233. DOI:10.1073/pnas.1001921107 | |
| Zhou Z G, Lei J S. 2016. Pn anisotropic tomography and mantle dynamics beneath China. Physics of the Earth and Planetary Interiors, 257: 193-204. DOI:10.1016/j.pepi.2016.06.005 | |
| 邓起东, 程绍平, 马冀, 等. 2014. 青藏高原地震活动特征及当前地震活动形势. 地球物理学报, 57(7): 2025–2042. DOI:10.6038/cjg20140701 | |
| 范莉萍, 吴建平, 房立华, 等. 2015. 青藏高原东南缘瑞利波群速度分布特征及其构造意义探讨. 地球物理学报, 58(5): 1555–1567. DOI:10.6038/cjg20150509 | |
| 唐有彩, 陈永顺, 杨英杰, 等. 2011. 华北克拉通中部地区背景噪声成像. 地球物理学报, 54(8): 2011–2022. DOI:10.3969/j.issn.0001-5733.2011.08.008 | |
| 王椿镛, 常利军, 丁志峰, 等. 2014. 中国大陆上地幔各向异性和壳幔变形模式. 中国科学:地球科学, 44(1): 98–110. | |
| 杨晓平, 吴果, 陈立春, 等. 2016. 青藏高原南缘2015年尼泊尔MW7.8地震发震构造. 地球物理学报, 59(7): 2528–2538. DOI:10.6038/cjg20160718 | |
| 姚华建, 尹九洵. 2015. 喜马拉雅造山带构造特征与2015年尼泊尔MW7.8级大地震. 科学通报, 60(27): 2656–2658. | |
| 张广伟, 雷建设. 2015. 2015尼泊尔MS8.1地震中等余震震源机制研究. 地球物理学报, 58(11): 4298–4304. DOI:10.6038/cjg20151134 | |
 2016, Vol. 59


