2. 河北省地震局, 石家庄 050021
2. Earthquake Administration of Hebei Province, Shijiazhuang 050021, China
震群发震机理指触发震群活动以及推动震群持续活动的物理过程和动力学作用.其作为地震活动性研究的组成部分,对深入认识地震序列的孕育和发展过程有重要意义.随着数字化地震观测技术的发展以及地下精细构造研究的不断完善,对震群发震机理的讨论渐渐成为地震序列研究的热点之一.
Vidale和Shearer(2006)通过分析美国南加州震群活动,归纳了三种常见的震群活动发震机理,即级联触发模型、断层慢滑动模型和流体侵入模型.级联触发模型认为震群发震机理与主震触发余震的机制相同,其主要建立在地震序列统计特征研究上(Helmstetter and Sornette,2003;Helmstetter et al.,2003;Felzer et al.,2004),并得到静态应力触发计算结果的支持(Sumy et al.,2014).断层慢滑动模型指中小地震震群活动期间伴随有地下断层构造慢滑动的现象,其得到了数字地震波形研究的支持(Chen and Shearer,2011;Kato et al.,2014).在日本沿海(Kato et al.,2014;Hirose et al.,2014)、南美洲西海岸(Brodskey and Lay,2014)等俯冲带地区可以观测到断层慢滑动伴随着震群活动.流体侵入模型指流体侵入地壳已存在的微小裂隙从而触发小震群活动,其多见于水库蓄水(陈翰林等,2009;El Hariri et al.,2010)、向地下人工加压注水(张致伟等,2012;Ellsworth,2013;Lei et al.,2013;McGarr et al.,2015)、活火山或古火山构造地区(吴建平等,2007;Hensch et al.,2008;Horálek and Fischer,2008)、深部热物质脱水(Kato et al.,2010;Lindenfeld et al.,2012; Kassaras et al.,2014)和强降雨(蒋海昆等,2011)等引发的震群活动.流体作用亦可通过引发断层慢滑动而触发地震活动(Wei et al.,2015).
震中扩展特征与重复地震检测是分析震群发震机理的有效手段.Chen和Shearer(2011)、Chen等(2012)通过分析美国南加州震群的扩展特征,发现流体侵入引发的震群与断层慢滑动引发的震群在震中扩展形态特征上有所不同,可作为判别是否存在流体或断层慢滑动作用的依据.单纯的应力级联触发模型较难解释同一凹凸体反复破裂产生的重复地震活动,而断层慢滑动可使断层应力加载速度加快(Bouchon et al.,2011;Kato et al.,2012),因而重复地震检测有助于判断在应力触发作用以外是否存在如断层慢滑动机制等其他的物理过程.
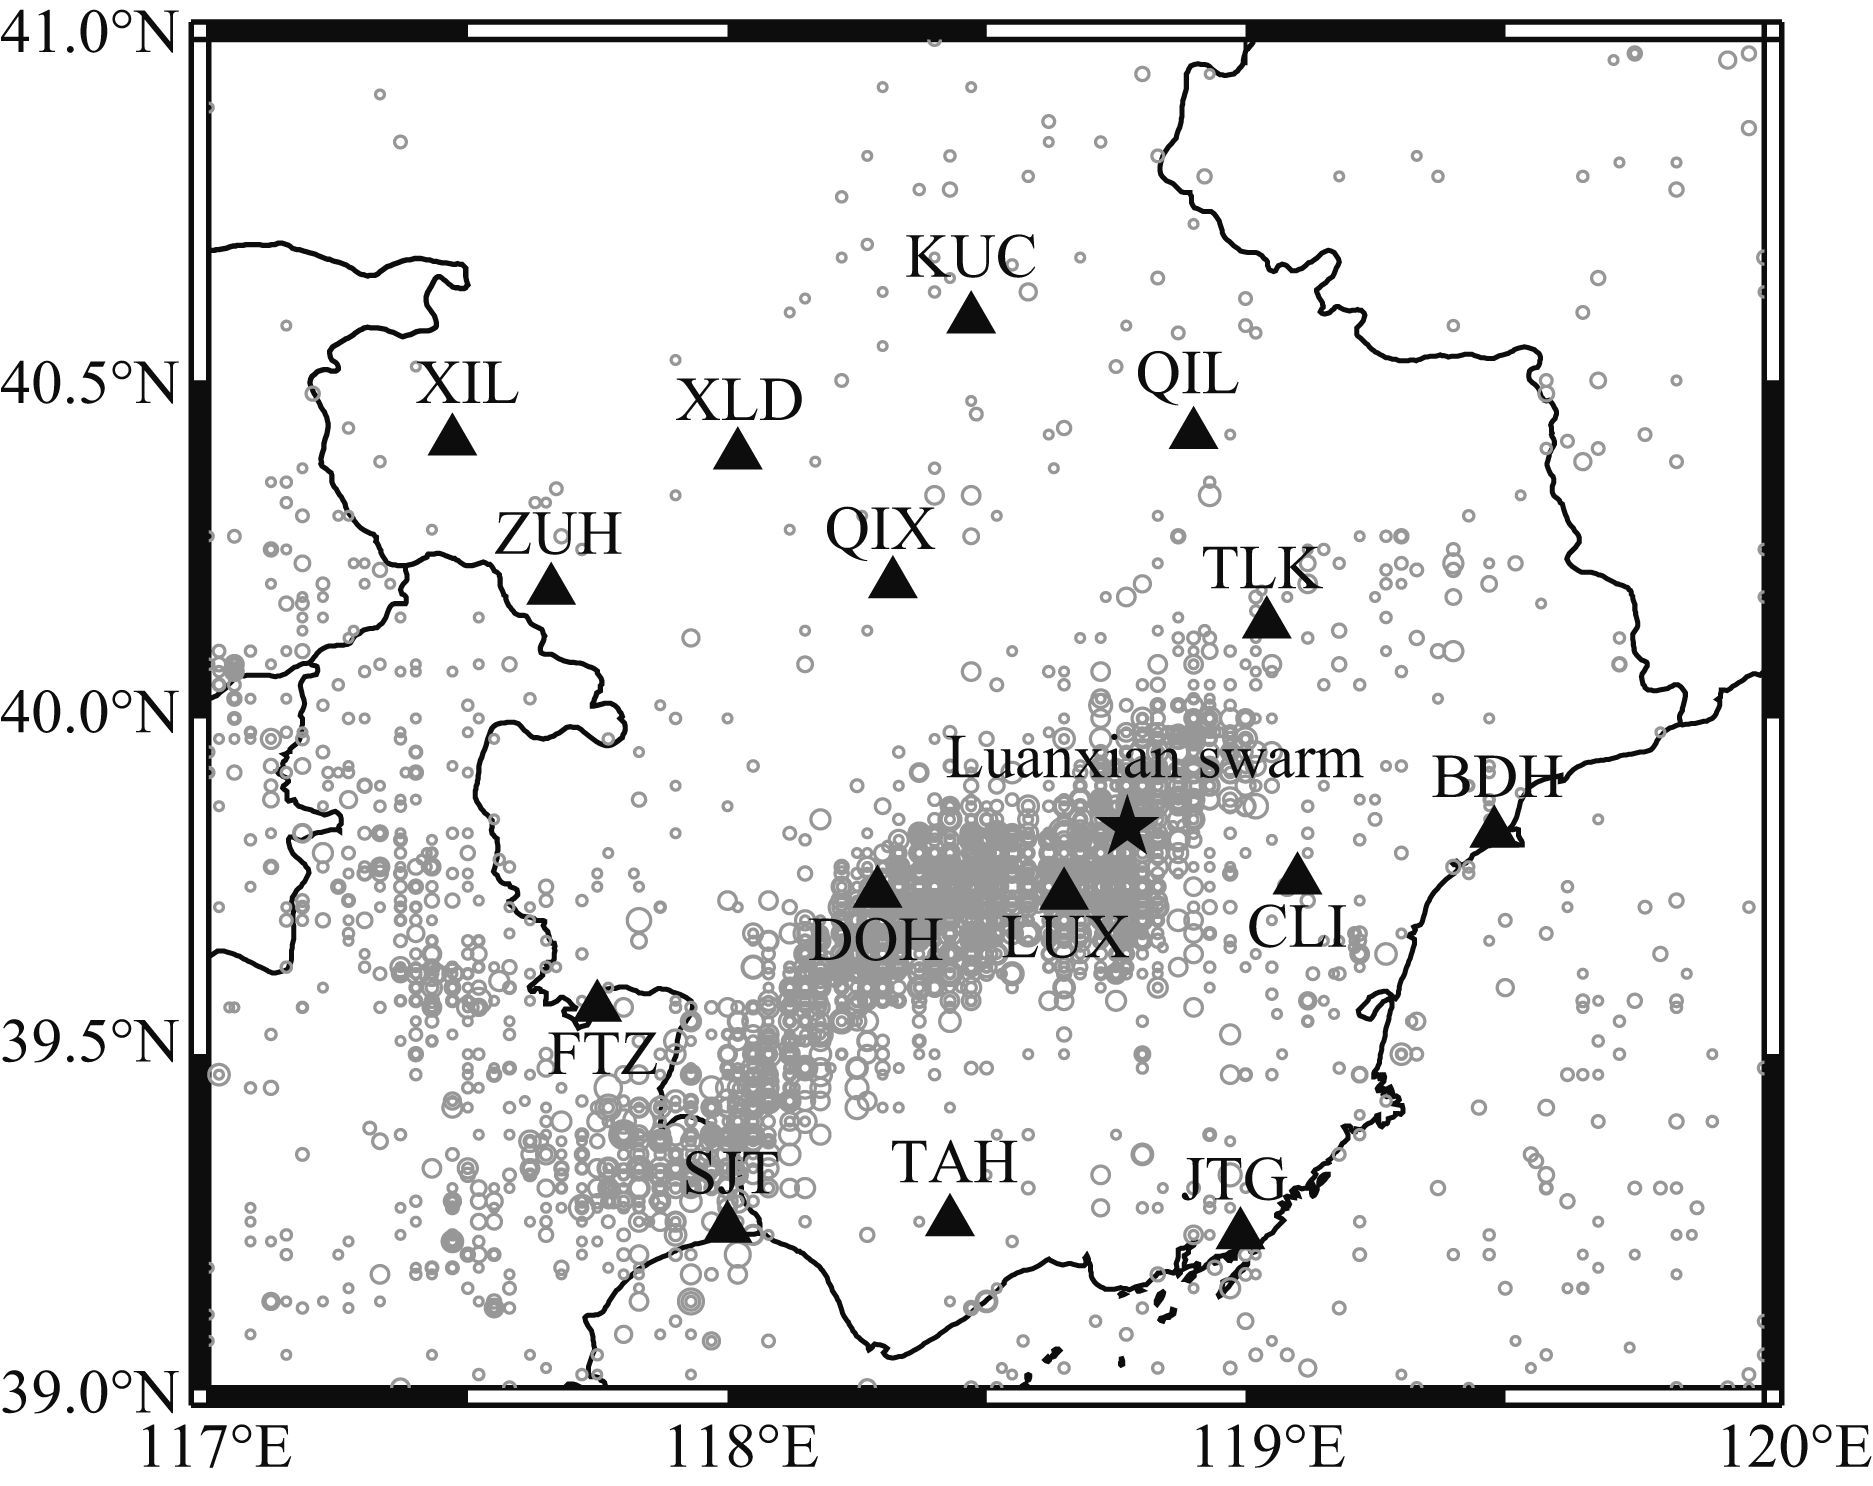
小震震群活动频次明显增加是华北地区2011年以来显著的地震活动特征之一(全国7级地震与地震形势跟踪组,2014;谭毅培等,2014;曲均浩等,2015;倪红玉等,2015).2015年1月11日至2月3日,河北滦县地区发生震群活动,震中位置处于1976年唐山地震余震区内(如图 1所示).《河北省测震台网地震观测报告》记录到此次震群发生地震222次,最大地震震级为ML3.2.对滦县震群的精细研究,可在一定程度上弥补首都圈强震数字化资料的不足,为分析首都圈地震活动和强震危险性提供依据.本文首先补充震群活动期间目录遗漏的地震,再基于震中扩展形态和重复地震识别分析滦县震群的发震机理.
|
图 1 滦县震群震中位置与周边测震台站分布图 五角星为震群震中位置,三角形为台站位置,灰色圆圈为2008年以来河北台网记录到的中小地震事件. Fig. 1 Epicenters location of Luanxian swarm and stations distribution around the swarm The black star represents the epicenter location of the swarm. The black triangles represent the stations. And the gray circles represent small earthquake epicenters recorded by Hebei seismic network from the year 2008. |
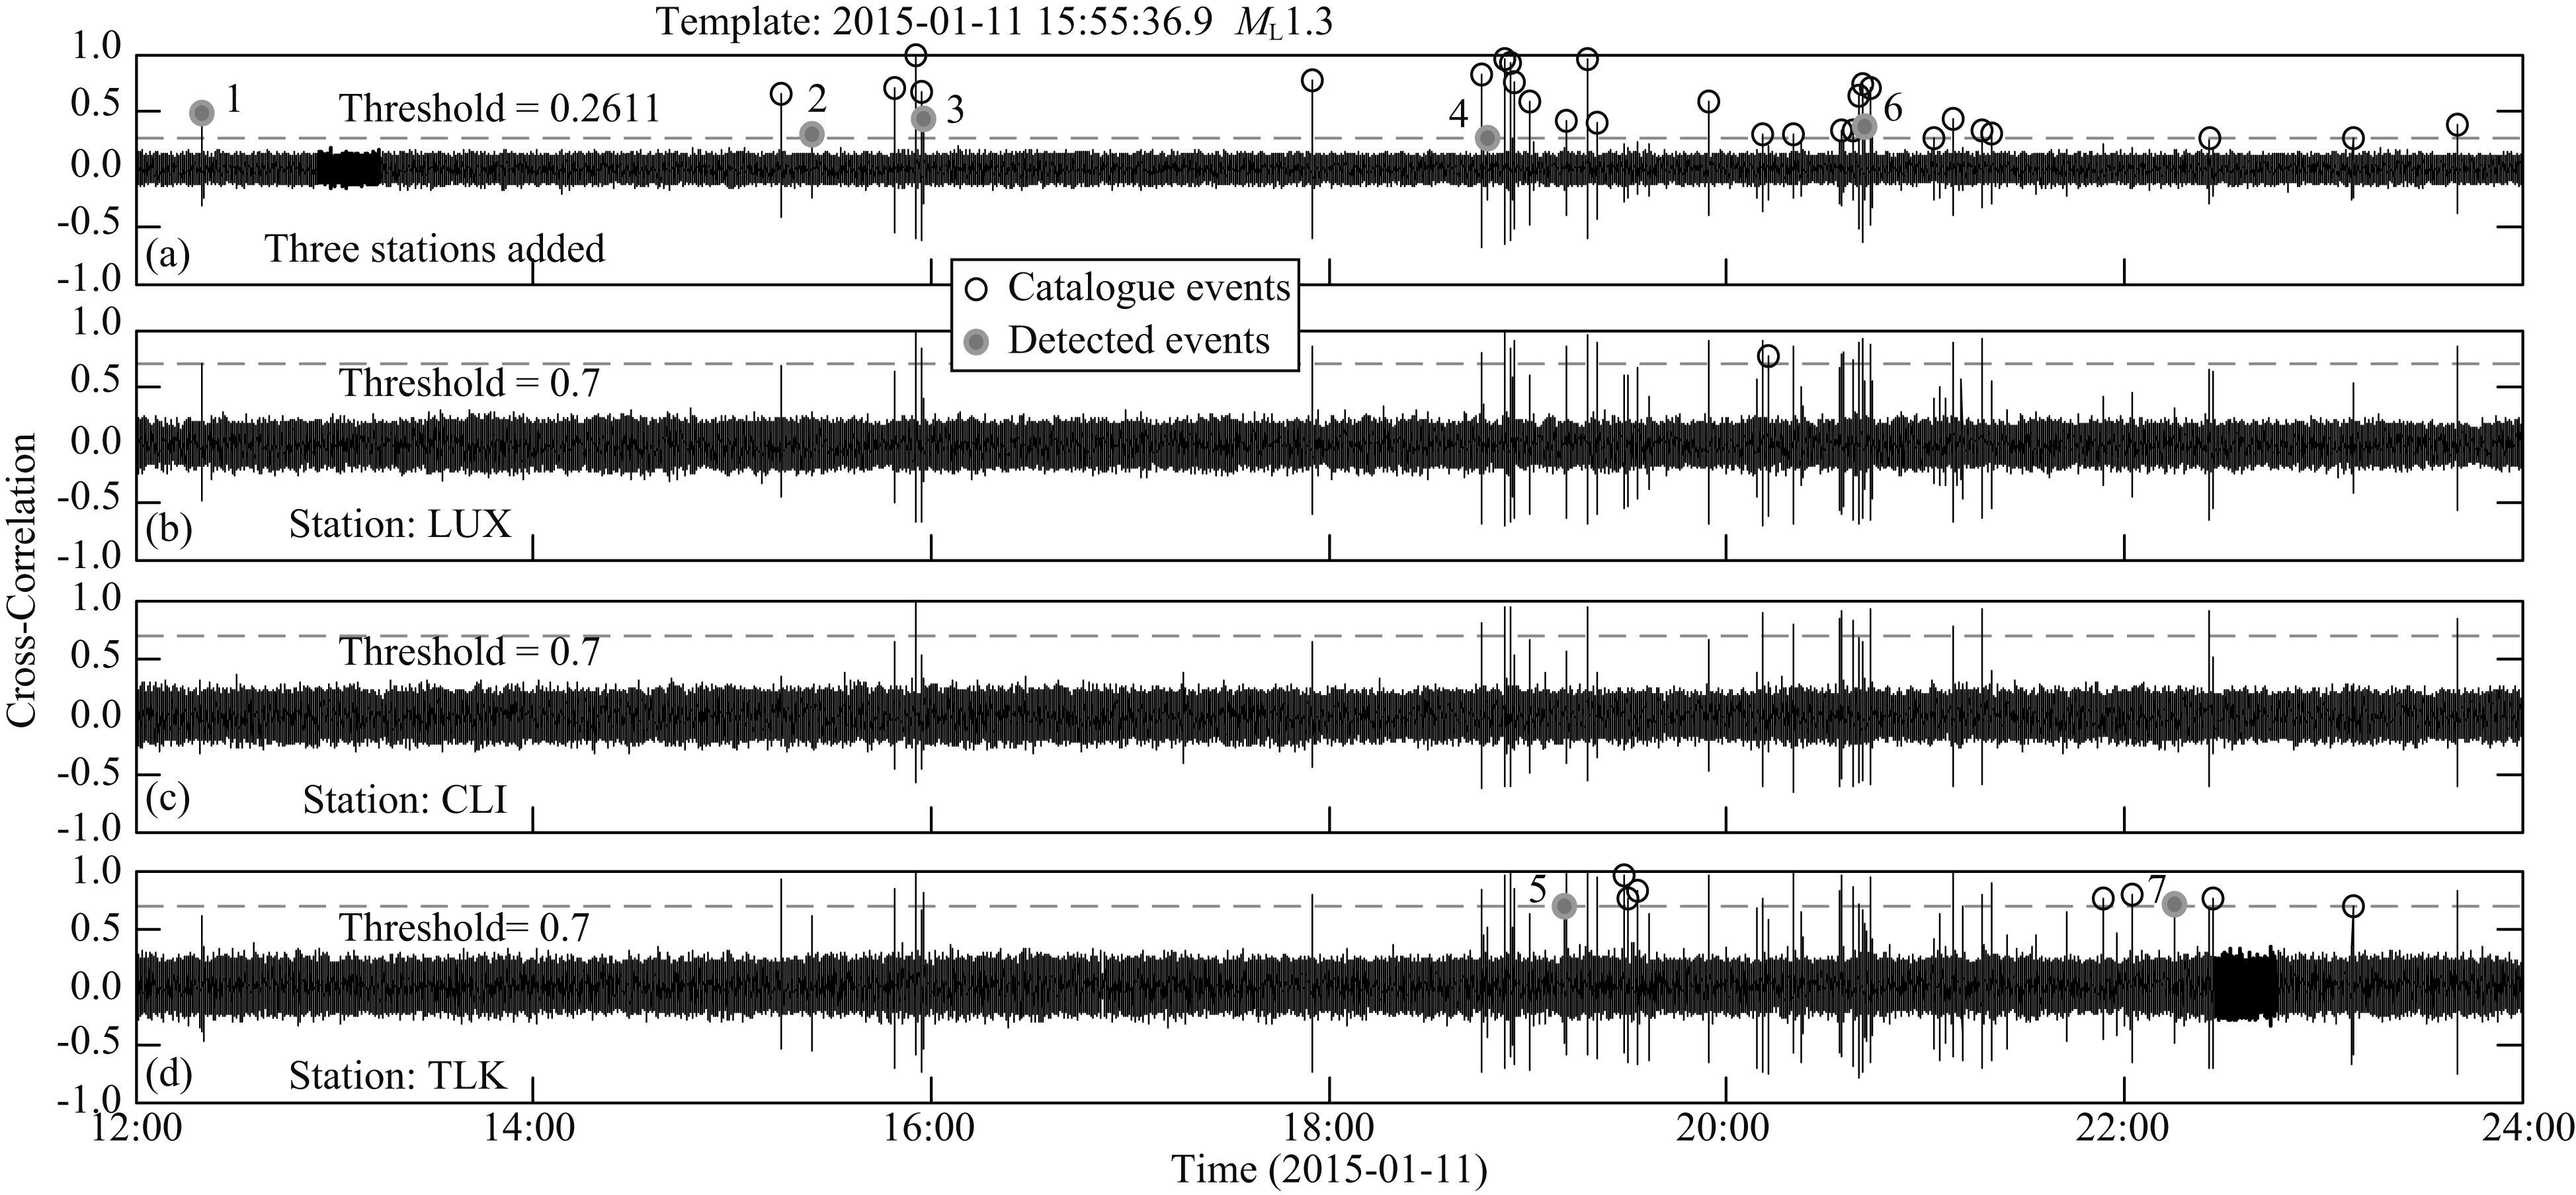
采用模板匹配识别方法(Peng and Zhao,2009)检测目录遗漏的地震事件.选取震群中ML1.0以上地震作为模板,截取距离震中最近的滦县台(LUX)、昌黎台(CLI)和桃林口台(TLK)三分量直达S波到时前2 s到后2 s的波形,经过零相移4阶Butterworth滤波器2~8 Hz滤波后,在连续波形上进行互相关扫描.
图 2为识别遗漏地震示意图.其过程分为4步:(1)将3个台站扫描得到的互相关系数序列按模板地震在此台站的走时平移;(2)计算3个台站波形互相关系数的平均数,取9倍绝对离差中位数(median absolute deviation,MAD)为阈值,挑选大于阈值或单台互相关系数大于0.7,而目录中未记录的作为疑似遗漏地震事件;(3)基于波形互相关震相检测技术检测疑似遗漏地震事件的震相,在距离震中最近的3个台至少检测到一个P波和S波震相的则确认为遗漏地震;(4)利用遗漏事件水平向波形S波段最大振幅与模板地震的振幅比估计遗漏事件的震级.
|
图 2 遗漏地震检测方法示意图 模板地震为发生在2015年1月11日15∶55∶36.9的ML1.3地震,扫描时间段为2015年1月11日12∶00至24∶00.黑色圆圈为目录给出的地震,灰色实心圆是检测到的地震.(a)三个台站互相关相加结果,根据9倍绝对离差中位数计算得到阈值为0.2611;(b)—(d)分别为三个台站波形互相关系数,阈值取为0.7. Fig. 2 The process of missing earthquakes detection The template is an ML1.3 earthquake which occurred at 15∶55∶36.9 January 11st,2015. And scanning time window is 12∶00 to 24∶00 January 11st,2015.Black circles represent earthquake events in the catalog,and the gray dots represent missing earthquake events detected.(a)Average cross-correlation sequence calculated from three stations′ waveform. The threshold is 0.2611 which is 9 times of median absolute deviation.(b)—(d)Cross-correlation sequence calculated from single station,the threshold is 0.7. |
在1月11日至2月3日时间段内共检测到目录遗漏的地震事件103个,其中ML1.0以上2个,ML0.0以上66个.补充遗漏地震得到更加完整的地震目录(包含发震时刻和震级信息,震源位置的确定见第3节),有利于提高震中扩展特征分析结果的科学性和可靠性.
3 震中扩展特征本节首先使用双差定位方法(Waldhauser and Ellsworth,2000)对震群进行精定位,再基于精定位结果分析震群震中随时间的扩展特征.
区域台网提供的震相报告存在人工量取震相到时的误差,对精定位结果的可靠性造成不利的影响.加入波形互相关信息对震相到时进行校正,可有效降低到时拾取中人工误差的影响(黄媛等,2006).鉴于滦县震群中地震事件记录波形相似程度较高,本文首先人工校核震群中最大地震的震相到时,以此地震震相到时为模板,使用波形互相关震相检测技术(谭毅培等,2014)标定其他地震事件的震相到时,无法与模板匹配的震相则被舍去.考虑到首波Pn震相的识别相对复杂,且首都圈台网台站密度较高,因此只选择震中距110 km以内的10个台站记录波形进行计算,从而避免Pn震相的干扰.
图 3以距离震中最近的滦县台为例展示了标定震相的过程.由图 3可见P波到时人工拾取误差相对较小,都在0.05 s以内,而S波到时人工拾取误差较大,有的地震事件甚至达到0.3 s.经过波形互相关震相检测后,波形相似的不同地震事件震相拾取误差降低到5 ms(采样间隔的一半)以内.利用波形互相关标定的震相到时,而不使用台网震相报告中给出的到时数据,能够有效抑制台网工作人员手动标定到时所带来的人工误差,从而提高地震精定位结果的精度和可靠性.

|
图 3 滦县台(LUX)震相标定过程示意图 蓝色短线表示台网震相报告给出的震相到时数据,红色表示基于波形互相关震相检测技术标定的震相到时,最上方黑色为所选模板地震的波形,波形经过1~10 Hz带通滤波.每条波形左侧数字为震相报告给出到时与互相关标定到时之差,单位为s.(a)震群中40个地震事件LUX垂直向记录波形,选取P波到时前0.5 s至到时后1 s的波形检测P波到时;(b)40个地震事件LUX东西向记录波形,选取S波到时前0.5 s至到时后1.5 s的波形检测S波到时. Fig. 3 The process of seismic phase recalibration of the station LUX The short blue lines represent phase arrival time in the observation report by Hebei seismic network,and the red lines represent phase arrival time recalibrated by cross-correlation phase detection method. The black waveform in the above is the template waveform. The numbers at the left of waveforms are different between phase arrival time in the observation report and recalibrated in this paper.(a)Vertical waveform of 40 earthquakes in Luanxian swarm recorded by station LUX,the P-wave arrival time is recalibrated by cross-correlation calculated from 1.5 s length waveform from 0.5 s before to 1 s after P-wave arrival time.(b)W-E direction waveform of 40 earthquakes in Luanxian swarm recorded by station LUX,the S-wave arrival time is recalibrated by cross-correlation calculated from 2 s length waveform from 0.5 s before to 1.5 s after S-wave arrival time. |
对于能标定4个以上台站震相到时的地震事件,基于含有互相关信息震相到时数据对其做精定位.双差定位计算中使用奇异值分解(SVD)方法.作为遗漏地震检测模板的ML1.0以上地震都能够得到精定位结果.对于其他未检测到4个台站震相的地震,我们参考已有研究中成功应用于分析余震和前震序列震中时空演化的方法(Peng and Zhao,2009;Tang et al.,2014;Wu et al.,2014a),将其震中置于与其互相关系数最大的模板震中位置上.参考基于深反射剖面(曾融生等,1988)、接收函数(王峻等,2009)和层析成像(于湘伟等,2010)等唐山地区地下结构研究结果,精定位所使用一维P波速度结构如表 1所示,VP/VS波速比设为1.73.
|
|
表 1 地震精定位所使用速度结构 Table 1 P-wave velocity structure used in the relocation |
通过双差定位方法计算,共得到107个地震的精定位结果(图 4所示).结果显示震中分布呈现更加明显的条带状分布(图 4a),发震构造为北东向断层,与唐山地震发震构造走向基本一致.震中在垂直走向的剖面上的分布(图 4c)显示发震构造可能为近垂直地表的断层.

|
图 4 滦县震群震中位置精定位结果 (a)震中位置在地表的投影;(b),(c)分别为震中在垂直地表的剖面AA′和BB′上的投影. Fig. 4 Epicenter distribution of relocation result of Luanxian swarm (a)Map view of epicenter distribution;(b)and(c)are projection of epicenters in the vertical profiles AA′ and BB′. |
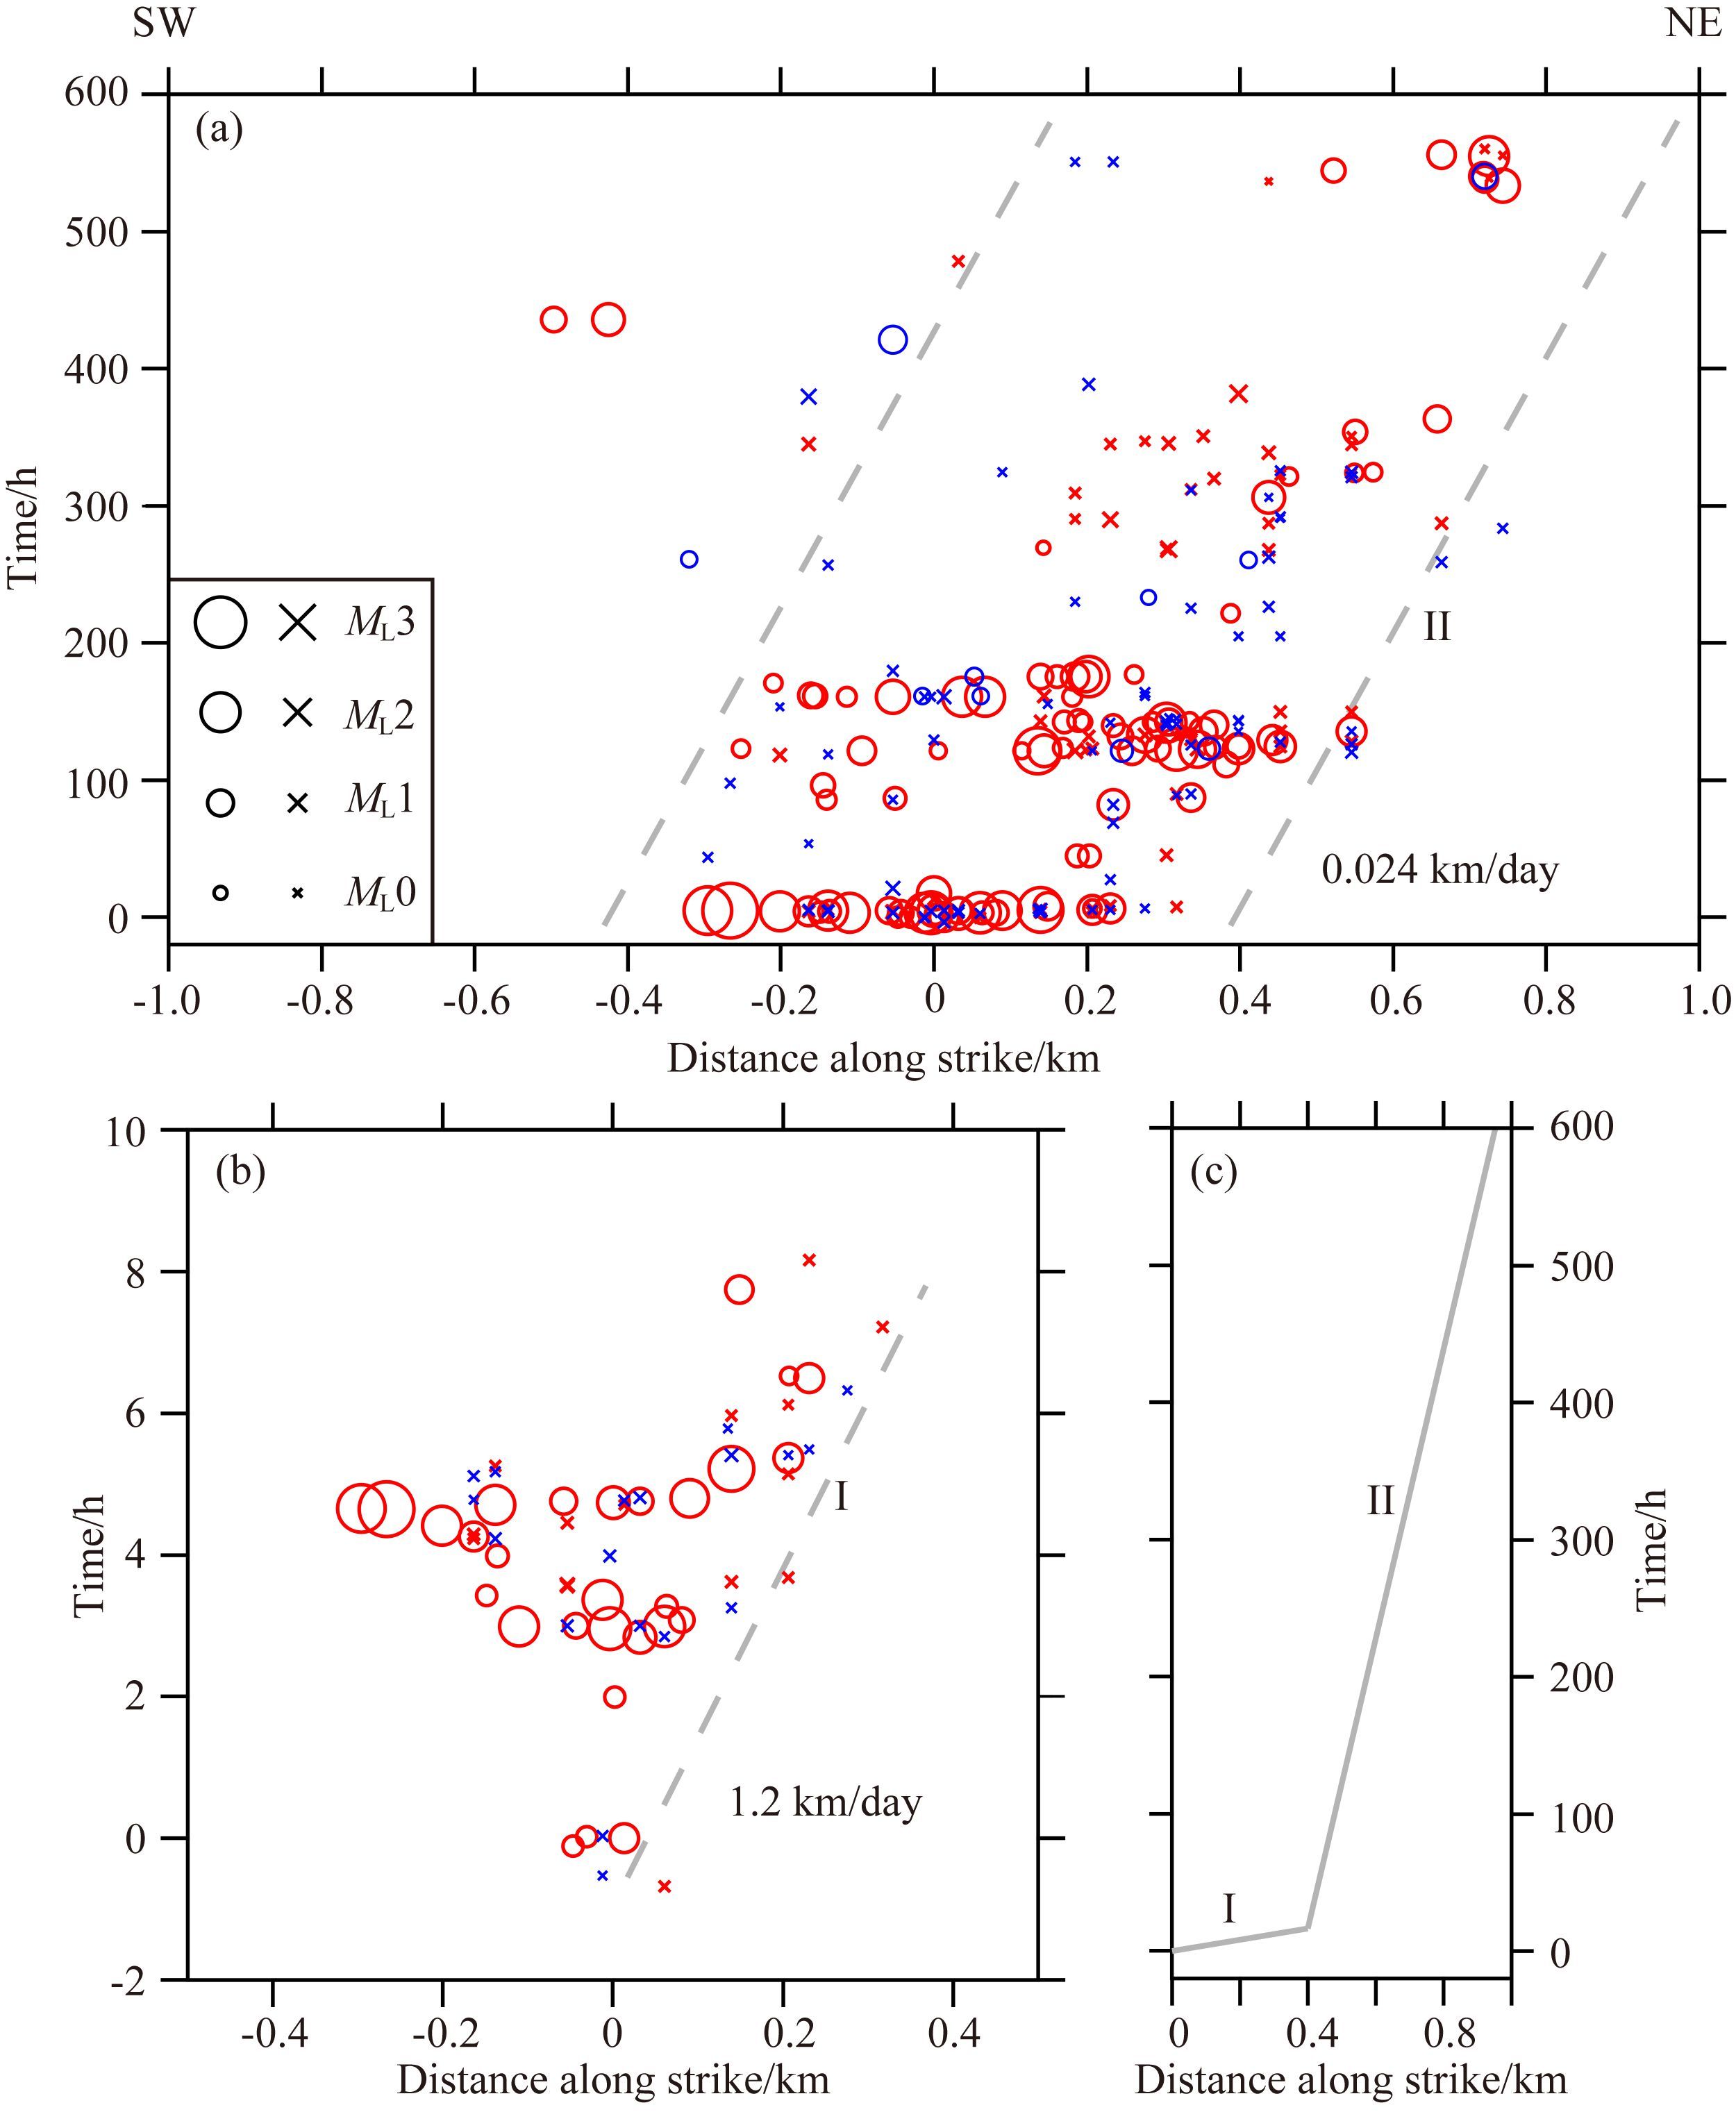
根据地震精定位结果,将震中位置投影到断层与水平面交线上,得到震中随时间的扩展图像(图 5),其中红色为目录给出的地震,蓝色为检测到的遗漏地震.横坐标的零点设为目录给出的第一个ML1.0以上地震(2015年1月11日15∶55∶36.9,ML1.3)的震中位置,纵坐标原点亦设为此地震发震时刻.如图 5a所示,在震群活动期间,地震震中整体上由南西向北东方向迁移,震中向北东方向呈现随时间线性扩展特征,速率约为每天0.024 km.仔细观察地震最为密集的10个小时(图 5b),也可观察到震中向北东方向的线性扩展,扩展速率约为每天1.2 km.总之,震中分布表现出扩展速率先快后慢的两阶段线性扩展的特征(图 5c),第一阶段持续时间较短而扩展速率较快,第二阶段持续时间相对较长.
|
图 5 滦县震群震中位置扩展图 圆圈表示可直接得到精定位结果的地震事件,十叉表示置于互相关系数最大模板震中位置的地震事件,红色为目录给出地震事件,蓝色为本文检测出的遗漏地震事件,灰色虚线为震中扩展形态示意.(a)震群活动期间震中扩展图像;(b)震群活动前10个小时震中扩展图像;(c)震中扩展尖峰形态示意图. Fig. 5 Epicenter migration of Luanxian swarm The circles represent the earthquake events can relocated directly,the cross represent the events located at the same location as the template which has the biggest cross-correlation. The red circles represent events in the catalog,and the blue represent events detected in this paper. Dashed gray lines represent the migration curve of the epicenters.(a)Epicenter migration in the all time of swarm activity.(b)Epicenter migration in the first 10 hours of the swarm.(c)Migration curve of the epicenters. |
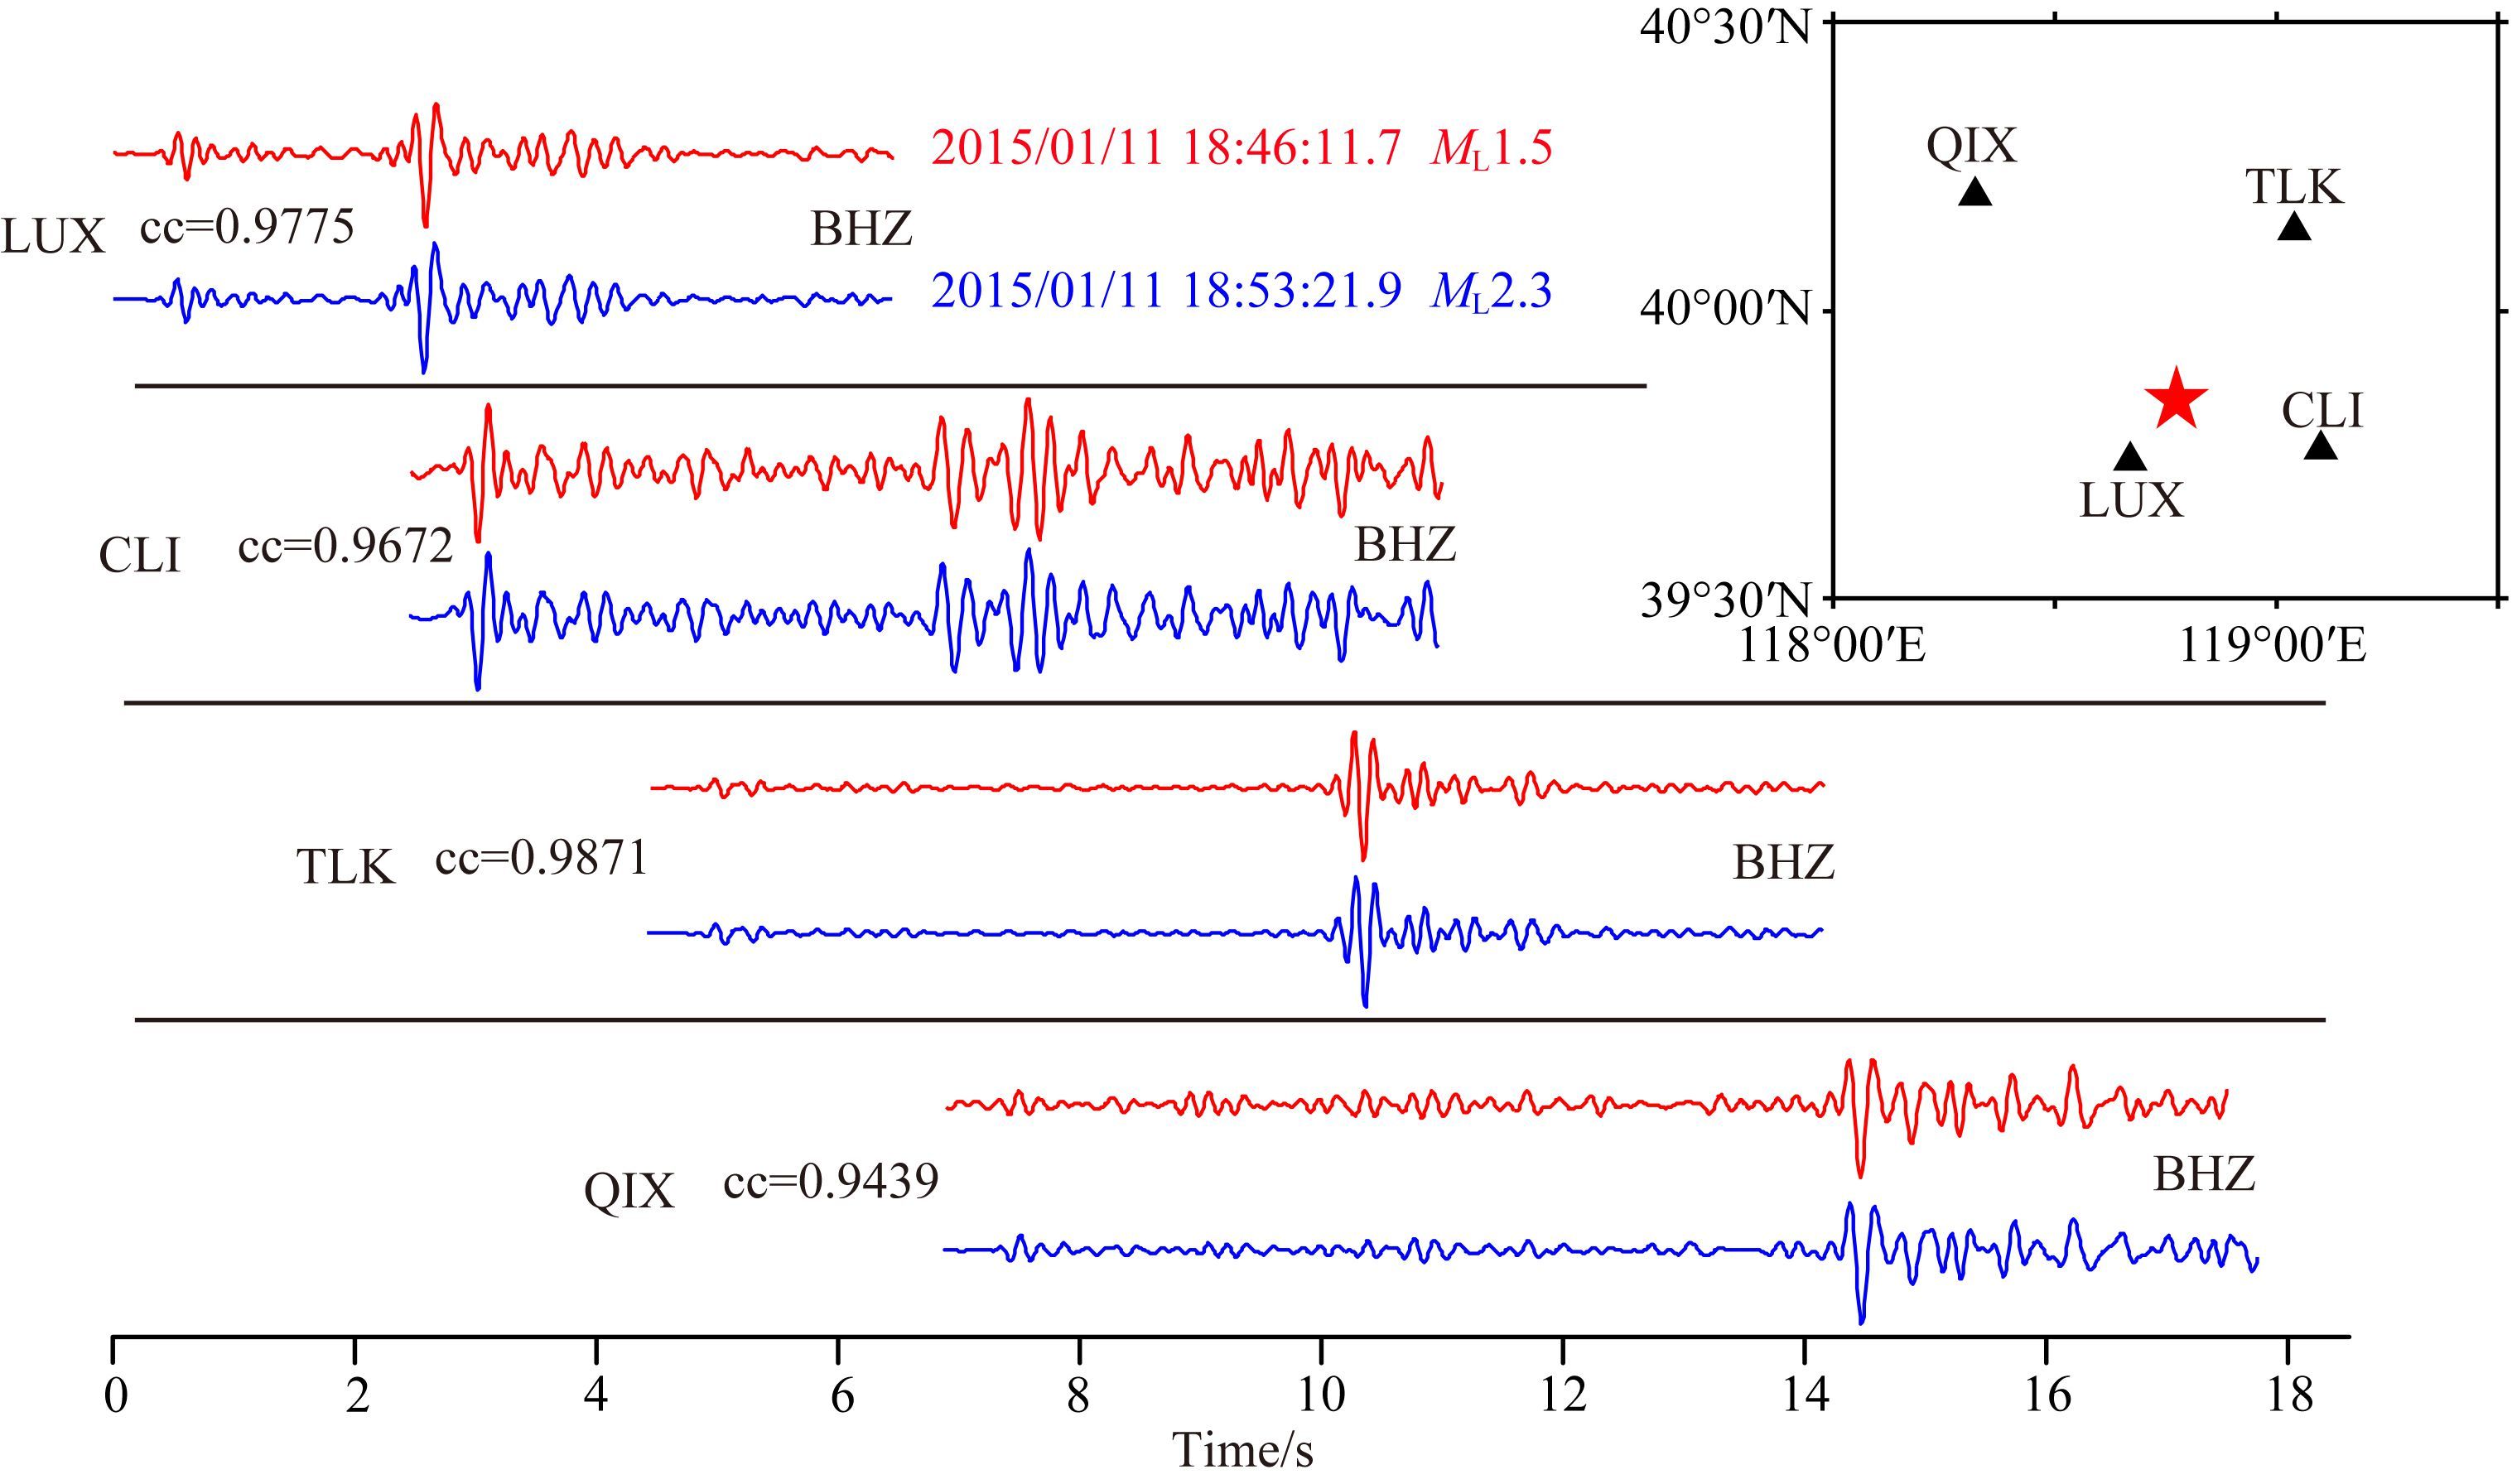
Li等(2007)对唐山地区重复地震活动进行了研究,确认了唐山地区存在重复地震活动,进而使用重复地震估计唐山断层深部滑移速率.本节采用与Li等(2007)相似的方法检测滦县震群活动期间是否存在重复地震.如图 6所示,首先选取距离震中最近的滦县台(LUX)、昌黎台(CLI)、桃林口台(TLK)和迁西台(QIX)4个台站垂直向记录波形,经过零相移4阶Butterworth滤波器1~10 Hz滤波后,截取P波到时前0.5 s至S波到时后4 s的波形两两计算波形互相关系数.我们定义其中至少有3个台互相关系数大于0.9的为相似地震.经过互相关计算共检测到22对相似地震事件.
|
图 6 基于波形互相关检测相似地震过程示意图 红色和蓝色分别为两次地震在四个台站的垂直向记录波形,选取P波到时前0.5 s到S波到时后4 s的波形,经过1~10 Hz带通滤波. Fig. 6 The process of similar earthquakes detection using waveform cross-correlation The red and blue waveforms are vertical component waveforms from 0.5 s before the P-wave arrival time to 4 s after the S-wave arrival time recorded by 4 stations of 2 earthquake events,which filtered by 1~10 Hz bandpass filter. |
下一步从相似地震中筛选重复地震,计算过程参考Li等(2011)和李乐等(2013,2015)的方法,首先对地震记录波形进行内插,使用3次样条插值将采样率由每秒100点插值为每秒10000点,再采用波形互相关震相检测技术统一标定相似地震的震相到时,利用双差定位方法对每对相似地震进行精定位,并基于圆盘破裂断层模型计算其破裂尺度和滑动量.采用近震震级与地震矩的经验关系(Abercrombie,1996) log(M0)=9.8+ML 计算地震矩.根据地震矩计算破裂半径r:

|
(1) |
其中Δσ为应力降.根据赵翠萍等(2011)对华北北部地震应力降的计算结果,将应力降设定为常量2 MPa.再利用地震矩的定义计算滑移量D:

|
(2) |
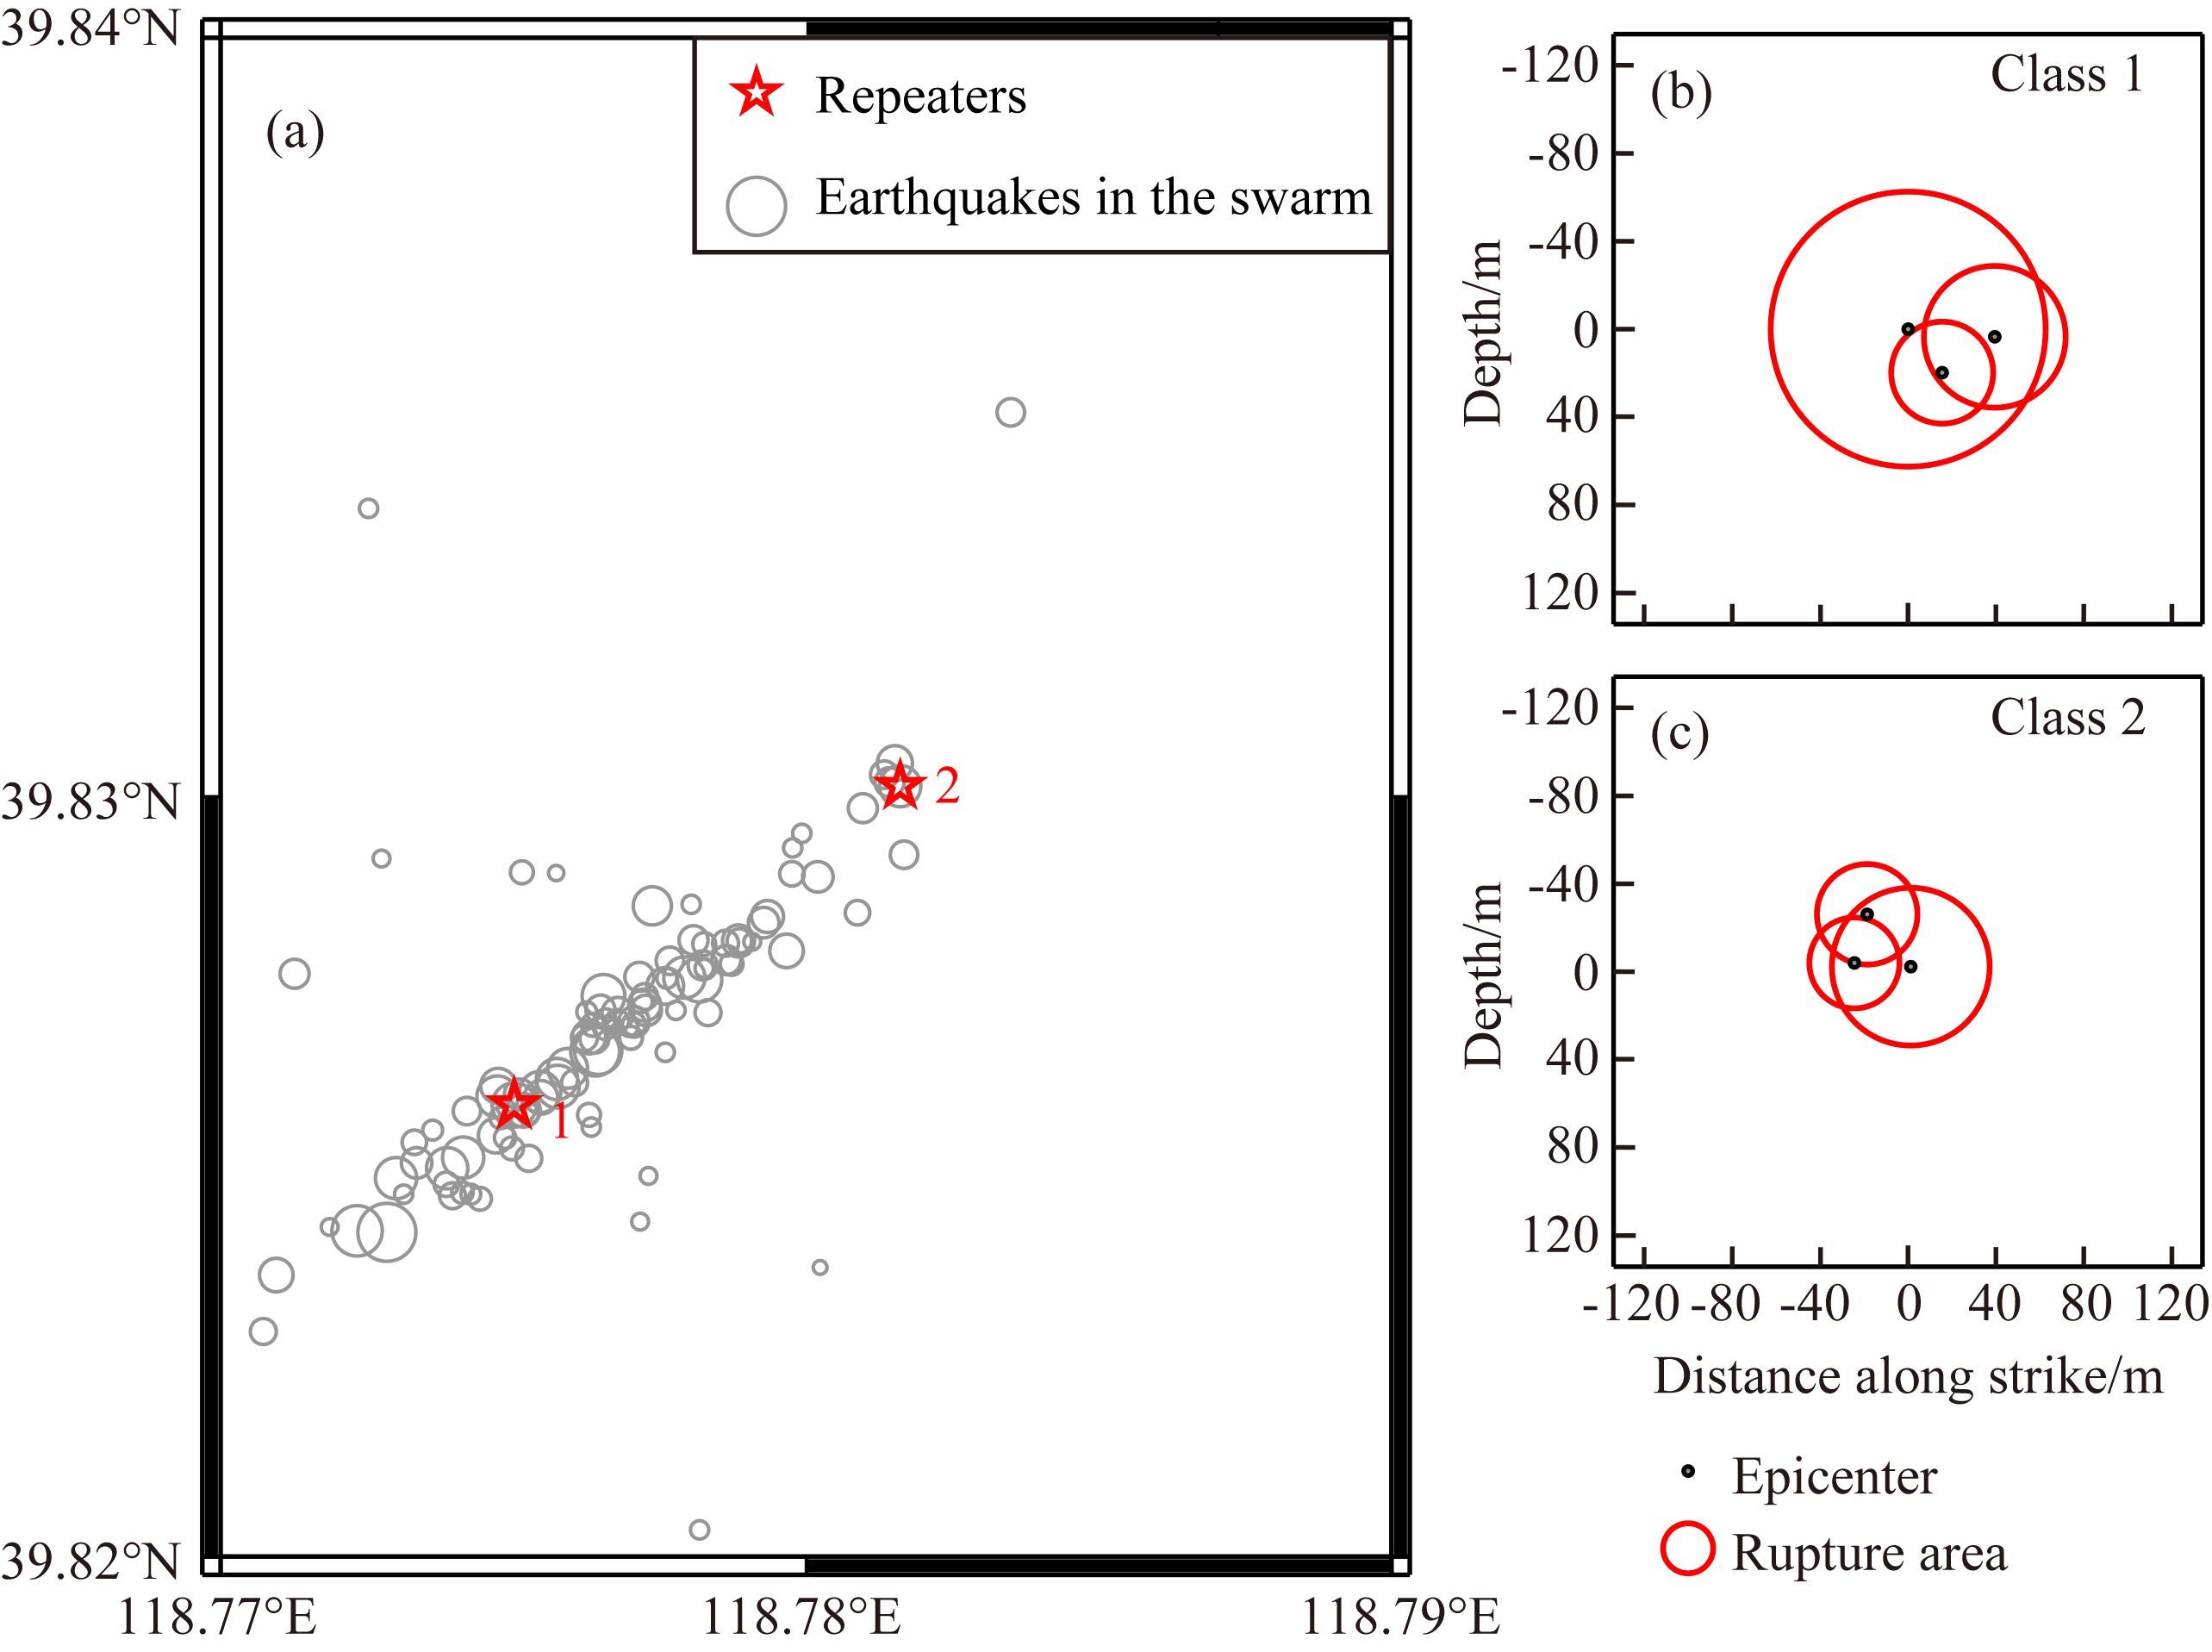
当相似地震中震级较小地震的震中位置在较大地震破裂面以内,即地震对震中间距离小于较大地震的破裂半径时,我们判定此组相似地震为重复地震.由此共检测到两组重复地震,其各包含3个地震事件.图 7展示了所检测到重复地震的震中位置和破裂面重合程度,表 2给出了两组重复地震发震时刻、相对位置、破裂半径和滑移量等信息.
|
图 7 检测到重复地震震中位置和破裂面重合程度 (a)红色五角星为重复地震震中位置,灰色圆圈为震群中其他地震震中位置; (b)—(c)红色圈圈为估算的重复地震破裂面,灰色圆点为其震中位置. Fig. 7 Epicenter distribution and overlapped rupture area of repeaters (a)Red stars represent epicenters of repeaters,and gray circles represent epicenters of other earthquakes in the swarm; (b)—(c)Red circles represent rupture area of repeaters,and the gray dots represent their epicenter locations. |
|
|
表 2 两组重复地震参数列表 Table 2 Seismic parameters of two classes of repeaters |
在遗漏地震检测部分选择地震事件三分量S波到时前2 s到后2 s记录波形作为检测遗漏地震的模板,主要是参考Peng和Zhao(2009)、Kato和Nakagawa(2014)以及Kato et al(2014)的方法.也有学者选择垂直向直达P波到时前2 s到后2 s、水平向直达S波到时前2 s到后2 s波形作为模板(如Wu et al.,2014a;Tang et al.,2014).如图 6所示,LUX和TLK两个台站垂直向波形记录S波段能量大于P波段能量,CLI台垂直向波形记录S波段能量与P波段基本相当.考虑到选择能量较大的震相波形更有利于检测到信噪比较低的遗漏地震信号,因而本文在垂直向波形仍选择S波到时前2 s到后2 s作为模板.
震中扩展特征分析中,双差定位算法使用SVD方法,程序给出震群水平定位平均误差约为5.8 m,深度定位平均误差约为30.0 m.震中在断层与水平面交线投影仅由震中位置计算得到,其误差与水平定位精度直接相关,深度定位的误差对震中扩展特征分析影响不大,因而图 5中震中位置的误差即为水平定位平均误差~6 m.鉴于震中扩展范围为百米级,远大于震中位置的误差,定位精度可以满足震中扩展特征分析的要求.
将无法得到精定位结果的地震置于互相关最大的模板地震震中位置,已应用于一些余震序列和前震序列的震中扩展特征分析中(Peng and Zhao,2009;Tang et al.,2014;Wu et al.,2014a),其结果对分析断层余滑和余震触发机理等科学问题起到了重要的作用.因此我们认为使用此办法给出震中位置并应用于震群震中扩展特征分析是可行的.Zhang和Wen(2015)使用能量反投影方法对检测到的遗漏地震进行定位.若今后通过与利用震相定位结果的对比和测试,能量反投影方法可以得到可靠的定位结果,则可将其应用于地震序列震中扩展的分析研究中.
重复地震检测部分中,双差定位算法给出相似地震水平定位平均误差约为3.5 m,深度定位平均误差约为10.9 m.由此计算得到在断层面上的定位误差约为11.4 m.表 2中给出重复地震的破裂半径都在24 m以上,大于误差的两倍,在定位误差范围内本节检测出的重复地震事件破裂面仍然有所重叠.赵翠萍等(2011)计算华北北部地震应力降使用样本为ML≥2.5地震,并且通过统计分析认为我国大陆中小地震应力降与震级呈现显著的正相关关系.本文检测到重复地震震级范围为ML1.0至2.3,根据应力降与震级的正相关关系外推,其平均应力降应小于本文设定的2 MPa,造成本文计算的破裂半径偏小,即地震实际的破裂半径应大于本文计算结果,因而不影响本文检测到的两组重复地震破裂面相互交叠的结论.综上所述,在考虑定位误差和参数设定误差的情况下,滦县震群中存在重复地震活动的结果是基本可靠的.
5.2 震群发震机理分析本节基于第1节中提到的Vidale和Shearer(2006)归纳的三种常见的震群活动发震机理模型对滦县震群发震机理进行分析.
Nadeau和Johnson(1998)将重复地震的发生机理解释为稳滑区域包围的较强凹凸体的重复破裂,而震群地震间相互应力触发很难解释这种同一凹凸体重复破裂机制.因此,重复地震活动的存在表明推动震群持续活动的因素除了地震应力触发作用外,可能还存在其他的物理过程.凹凸体在周围稳定蠕滑的加载下有可能会发生重复破裂(Anooshehpoor and Brune,2001;Beeler et al.,2001;Sammis and Rice,2001),Uchida等(2016)利用重复地震间隔估计断层的滑动速率变化,认为断层滑动速率加快使得重复地震间隔时间减小.因而断层慢滑动是滦县震群短时间内发生重复地震活动的一个可能的解释.
Chen和Shearer(2011)通过对美国加州71次震群活动的研究,总结了断层慢滑动与流体侵入引发震群在震中扩展特征的差别.断层慢滑动引发的震群活动震中随时间线性扩展,其扩展尖峰近似为直线;而流体侵入引发的震群活动震中扩展速率随时间逐渐减慢,扩展尖峰近似为二次型曲线,可用流体扩散方程解释(Horálek and Fischer,2008).本文观测到滦县震群震中呈现出由南西向北东方向的线性扩展特征,符合断层慢滑动引发的震群震中随时间的扩展形态.
综合以上分析,三种常见震群活动发震机理中,断层慢滑动模型能够解释所观测到的震中线性扩展特征和重复地震活动现象.因此我们认为滦县震群的发震机理可能符合断层慢滑动模型,即滦县震群活动可能伴随着发震断层的慢滑动.
级联触发模型认为震群中较早发生的地震改变了局部应力状态,是触发后续地震活动的决定性因素.断层慢滑动模型和流体侵入模型并不否认应力触发的作用,而是强调在这种应力触发作用之外,还存在某种物理过程对震群活动的持续发展同样起到推动作用.有学者研究发现动态或静态应力变化有可能触发重复地震的间隔时间缩短(Chen et al.,2013;Wu et al.,2014b).Kato等(2014)观测到2011年东日本MW9.0地震产生的应力变化触发了日本Boso半岛海域断层的慢滑动.针对2011年东日本MW9.0地震和2014年智利MW8.2地震的前震序列,不同学者使用不同方法分别获得了支持断层慢滑动模型和级联触发模型的证据(Kato et al.,2012;Marsan and Enescu,2012;Kato and Nakagawa,2014;Herman et al.,2016).Borghi等(2016)利用形变资料证实了2009年意大利L'Aquila地震前震序列断层慢滑动过程的存在,并通过计算断层慢滑动产生的静态库伦应力变化,发现主震和大部分余震发生在应力加载区内.综合以上研究结果,地震序列的发震机理可能是断层慢滑动和应力触发作用的综合结果,而不是单一的模型能够完全解释的.本文根据观测现象认为滦县震群发震机理符合断层慢滑动模型,同样也不否认应力触发作用,而是在应力触发之外可能存在发震断层的慢滑动,这种慢滑动对滦县震群的触发和持续活动也起到了一定作用.
除上文提到的三种常见模型外,对震群发震机理还有其他解释.鉴于震中扩展和重复地震现象基本可以通过断层慢滑动模型进行解释,本文未讨论断层慢滑动、级联触发和流体侵入以外的模型.若针对其他地震序列的研究观测到三种模型都无法解释的现象,则需考虑其他的可能性.
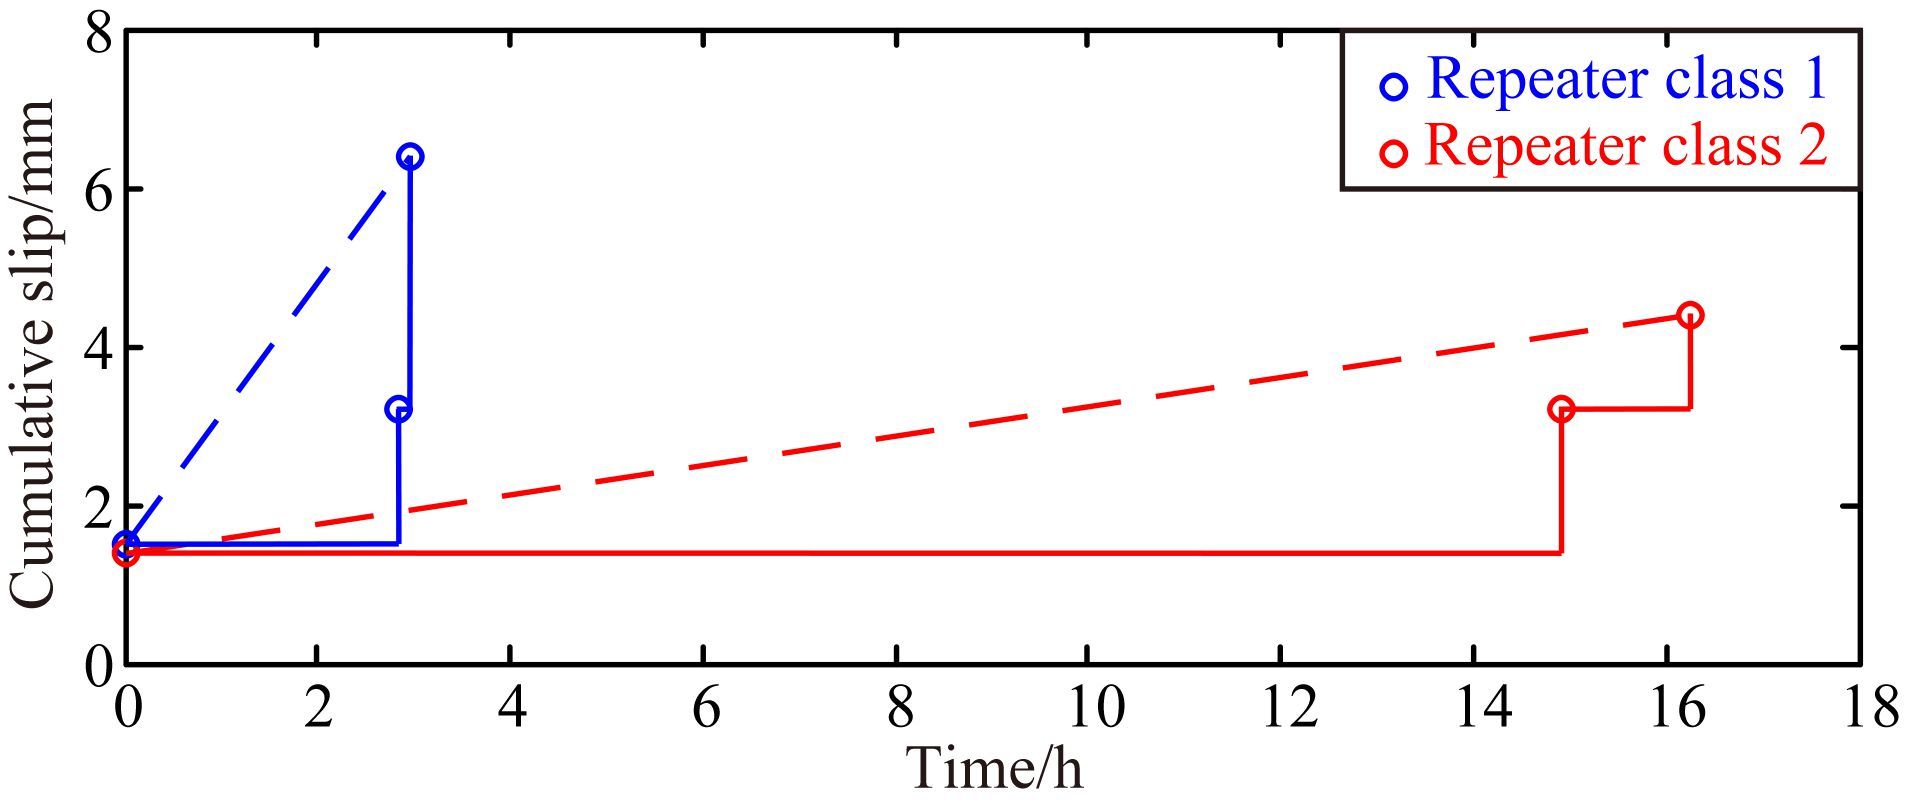
5.3 与前震序列研究结果的比较表 2给出了两组重复地震的累计滑移量,图 8比较了由累计滑移量和重复地震间隔估算的平均滑移速率.第一组重复地震累积滑移量较大而地震间隔较短,反之第二组重复地震累积滑移量较小而地震间隔较长,显示出第一组重复地震发生期间断层平均滑动速率较快.滦县震群活动期间检测到的重复地震数量较少,由于样本量较少无法给出可靠的定量化断层平均滑移速率,我们只能推测震群活动期间断层滑动速率可能存在由快而慢的变化.
|
图 8 重复地震累积滑移量分布图 蓝色表示第一组重复地震,红色表示第二组重复地震.横坐标表示每组重复地震与本组第一个地震的发震时刻之差,虚线的斜率表示根据重复地震估算的断层平均滑移速率. Fig. 8 Cumulative slip of two classes of repeaters The blue represents repeater class 1,and the red represents repeater class 2. The X-axis represents the difference between origin time of repeaters in a class and the first repeater in this class. The slope of the dashed lines represent the average slip rate calculated from the repeaters. |
我们注意到Igarashi等(2003)将重复地震活动分为“持续性”(continual-type)和“突发性”(burst-type)两类.“持续性”重复地震资料被广泛应用于断层滑动速率估算中(Nadeau and Johnson,1998;Igarashi et al.,2003;Li et al.,2011;李乐等,2013,2015).“突发性”重复地震多出现在震群活动和中强地震余震活动过程中,我们认为其可应用于断层慢滑动伴随震群活动中断层滑移速率的定性估计.
将检测到的重复地震活动与震中扩展分析结果相对照,第一组重复地震发生在震中扩展速度较快的第一阶段,而第二组重复地震发生在震中扩展速度较慢的第二阶段.滦县震群震中扩展速率出现由快变慢的趋势,断层滑移速率可能也存在由快变慢的变化,可能意味着震群发震断层的慢滑动在震群活动期间出现减速.
对板块边界俯冲带及板块内中强地震前震序列研究结果中,有些观测到发震断层慢滑动震中扩展速率存在由慢变快(Kato et al.,2012;Kato and Nakagawa,2014)或滑移速率由慢变快的加速现象(Bouchon et al.,2011),有些则未观测到震中扩展的加速(Sugan et al.,2014;Meng et al.,2015),但鲜有与本文对滦县震群观测到的震中扩展减速类似现象的报道.前震序列和震群在震中扩展特征上的差别是否具有一定的普遍性,即震中扩展形态能否成为有助于识别震群和前震序列的特征现象,尚需更多震例的研究.
6 结论本文基于模板匹配方法,在滦县震群活动期间检测到目录遗漏地震103个,其中ML1.0以上2个.震群精定位结果显示,发震构造可能为北东向近垂直的断层构造.震中分布表现出扩展速率先快后慢的两阶段线性扩展特征,第一阶段持续时间较短而扩展速率较快,第二阶段持续时间相对较长而扩展速率较慢.基于波形互相关和破裂面重合标准,在震群活动期间检测到两组重复地震活动.
基于三种常见的震群活动发震机理——断层慢滑动模型、级联触发模型和流体侵入模型,分析认为断层慢滑动模型能够较好地解释本文观测到的震中线性扩展和重复地震活动现象.因而认为此次滦县震群活动可能伴随着北东向断层的慢滑动,断层慢滑动在滦县震群的触发和持续活动过程中起到了一定作用.
致谢感谢两位审稿专家宝贵的建设性意见,感谢中国地震局监测预报司预报管理处提供的支持和鼓励,感谢中国地震局马宏生博士、张浪平博士、中国地震台网中心周龙泉研究员、中国地震局地震预测研究所邵志刚研究员、李乐博士、中国地震局地球物理研究所韩立波博士、四川省地震局张致伟等专家的指导和建议,感谢地震分析预报青年工作组地震序列小组成员有益的讨论,感谢天津市地震台网中心提供的数据资料支持.本文部分图件采用GMT软件包(Wessel and Smith,1995)绘图.
| Abercrombie R E. 1996. The magnitude-frequency distribution of earthquakes recorded with deep seismometers at Cajon Pass, southern California. Tectonophysics , 261 (1-3) : 1-7. DOI:10.1016/0040-1951(96)00052-2 | |
| Anooshehpoor A, Brune J N. 2001. Quasi-static slip-rate shielding by locked and creeping zones as an explanation for small repeating earthquakes at Parkfield. Bull. Seism. Soc. Amer. , 91 (2) : 401-403. DOI:10.1785/0120000105 | |
| Beeler N M, Lockner D L, Hickman S H. 2001. A simple stick-slip and creep-slip model for repeating earthquakes and its implication for microearthquakes at Parkfield. Bull. Seism. Soc. Amer. , 91 (6) : 1797-1804. DOI:10.1785/0120000096 | |
| Borghi A, Aoudia A, Javed F, et al. 2016. Precursory slow-slip loaded the 2009 L'Aquila earthquake sequence. Geophys. J. Int. , 205 (2) : 776-784. DOI:10.1093/gji/ggw046 | |
| Bouchon M, Karabulut H, Aktar M, et al. 2011. Extended nucleation of the 1999 MW7. 6 Izmit earthquake. Science , 331 (6019) : 877-880. | |
| Brodskey E E, Lay T. 2014. Recognizing foreshocks from the 1 April 2014 Chile earthquake. Science , 344 (6185) : 700-702. DOI:10.1126/science.1255202 | |
| Chen H L, Zhao C P, Xiu J G, et al. 2009. Study on precise relocation of Longtan reservoir earthquakes and its seismic activity. Chinese J. Geophys. (in Chinese) , 52 (8) : 2035-2043. DOI:10.3969/j.issn.0001-5733.2009.08.011 | |
| Chen K H, Bürgmann R, Nadeau R M. 2013. Do earthquakes talk to each other? Triggering and interaction of repeating sequences at Parkfield. J. Geophys. Res. , 118 (1) : 165-182. DOI:10.1029/2012JB009486 | |
| Chen X, Shearer P M. 2011. Comprehensive analysis of earthquake source spectra and swarms in the Salton Trough, California. J. Geophys. Res. , 116 (B9) : B09309. | |
| Chen X, Shearer P M, Abercrombie R E. 2012. Spatial migration of earthquakes within seismic clusters in Southern California:Evidence for fluid diffusion. J. Geophys. Res. , 117 (B4) : B04301. | |
| El Hariri M, Abercrombie R E, Rowe C A, et al. 2010. The role of fluids in triggering earthquakes:Observations from reservoir induced seismicity in Brazil. Geophys. J. Int. , 181 (3) : 1566-1574. | |
| Ellsworth W L. 2013. Injection-induced earthquakes. Science , 341 (6142) . DOI:10.1126/science.1225942 | |
| Felzer K R, Abercrombie R E, Ekström G. 2004. A common origin for aftershocks, foreshocks, and multiplets. Bull. Seism. Soc. Amer. , 94 (1) : 88-98. DOI:10.1785/0120030069 | |
| Helmstetter A, Sornette D. 2003. Foreshocks explained by cascades of triggered seismicity. J. Geophys. Res. , 108 (B10) : 2457. DOI:10.1029/2003JB002409 | |
| Helmstetter A, Sornette D, Grasso J R. 2003. Mainshocks are aftershocks of conditional foreshocks:How do foreshock statistical properties emerge from aftershock laws. J. Geophys. Res. , 108 (B1) : 2046. DOI:10.1029/2002JB001991 | |
| Hensch M, Riedel C, Reinhardt J, et al. 2008. Hypocenter migration of fluid-induced earthquake swarms in the Tjörnes Fracture zone (North Iceland). Tectonophysics , 447 (1-4) : 80-94. DOI:10.1016/j.tecto.2006.07.015 | |
| Herman M W, Furlong K P, Hayes G P, et al. 2016. Foreshock triggering of the 1 April 2014 MW 8. 2 Iquique, Chile, earthquake. Earth Planet Sci. Lett. , 447 : 119-129. DOI:10.1016/j.epsl.2016.04.020 | |
| Hirose H, Matsuzawa T, Kimura, et al. 2014. The Boso slow slip events in the 2007 and 2011 as a driving process for the accompanying earthquake swarm. Geophys. Res. Lett. , 41 (8) : 2778-2785. DOI:10.1002/2014GL059791 | |
| Horálek J, Fischer T. 2008. Role of crustal fluids in triggering the west Bohemia/Vogtland earthquake swarms:Just what we know (a review). Stud. Geophys. Geod. , 52 (4) : 455-478. DOI:10.1007/s11200-008-0032-0 | |
| Huang Y, Yang J S, Zhang Z T. 2006. Relocation of the Bachu-Jiashi, Xinjiang earthquake sequence in 2003 using the double-difference location algorithm. Chinese J. Geophys. (in Chinese) , 47 (1) : 162-169. DOI:10.3321/j.issn:0001-5733.2006.01.022 | |
| Igarashi T, Matsuzawa T, Hasegawa A. 2003. Repeating earthquakes and interplate aseismic slip in the northeastern Japan subduction zone. J. Geophys. Res. , 108 (B5) : 2249. DOI:10.1029/2002JB001920 | |
| Jiang H K, Yang M L, Sun X J, et al. 2011. A typical example of locally triggered seismicity in the boundary area of Lingyun and Fengshan following the large rainfall event of June 2010. Chinese J. Geophys. (in Chinese) , 54 (10) : 2606-2619. DOI:10.3969/j.issn.0001-5733.2011.10.018 | |
| Kassaras I, Kapetanidis V, Karakonstantis A, et al. 2014. Constraints on the dynamics and spatio-temporal evolution of the 2011 Oichalia seismic swarm (SW Peloponnesus, Greece). Tectonophysics , 614 : 100-127. DOI:10.1016/j.tecto.2013.12.012 | |
| Kato A, Sakai S, Iidaka T, et al. 2010. Non-volcanic seismic swarms triggered by circulating fluids and pressure fluctuations above a solidified diorite intrusion. Geophys. Res. Lett. , 37 (15) : L15302. | |
| Kato A, Obara K, Igarashi T, et al. 2012. Propagation of slow slip leading up to the 2011 MW9. 0 Tohoku-Oki earthquake. Science , 335 (6069) : 705-708. | |
| Kato A, Igarashi T, Obara K. 2014. Detection of a hidden Boso slow slip event immediately after the 2011 MW9. 0 Tohoku-Oki earthquake, Japan. Geophys. Res. Lett. , 41 (16) : 5868-5874. | |
| Kato A, Nakagawa S. 2014. Multiple slow-slip events during a foreshock sequence of the 2014 Iquique, Chile MW8. 1 earthquake. Geophys. Res. Lett. , 41 (15) : 5420-5427. DOI:10.1002/2014GL061138 | |
| Lei X L, Ma S L, Chen W K, et al. 2013. A detailed view of the injection-induced seismicity in a natural gas reservoir in Zigong, southwestern Sichuan Basin, China. J. Geophys. Res. , 118 (8) : 4296-4311. DOI:10.1002/jgrb.50310 | |
| Li L, Chen Q F, Cheng X, et al. 2007. Spatial clustering and repeating of seismic events observed along the 1976 Tangshan fault, North China. Geophys. Res. Lett. , 34 (23) : L23309. | |
| Li L, Chen Q F, Niu F L, et al. 2011. Deep slip rates along the Longmen Shan fault zone estimated from repeating microearthquakes. J. Geophys. Res. , 116 (B9) : B09310. DOI:10.1029/2011JB008406 | |
| Li L, Chen Q F, Niu F L, et al. 2013. Estimates of deep slip rate along the Xiaojiang fault with repeating microearthquake data. Chinese J. Geophys. (in Chinese) , 56 (10) : 3373-3384. DOI:10.6038/cjg20131013 | |
| Li L, Chen Q F, Niu F L, et al. 2015. Quantitative study of the deep deformation along the southern segment of the Xianshuihe fault zone using repeating microearthquakes. Chinese J. Geophys. (in Chinese) , 58 (11) : 4138-4148. DOI:10.6038/cjg20151121 | |
| Lindenfeld M, Rümpker G, Link K, et al. 2012. Fluid-triggered earthquake swarms in the Rwenzori region, East African Rift-evidence for rift initiation. Tectonophysics , 566-567 : 95-104. DOI:10.1016/j.tecto.2012.07.010 | |
| Marsan D, Enescu B. 2012. Modeling the foreshock sequence prior to the 2011, MW9. 0 Tohoku, Japan, earthquake. J. Geophys. Res. , 117 (B6) : B06316. DOI:10.1029/2011JB009039 | |
| McGarr A, Bekins B, Burkardt N, et al. 2015. Coping with earthquakes induced by fluid injection. Science , 347 (6224) : 830-831. DOI:10.1126/science.aaa0494 | |
| Meng L S, Huang H, Bürgmann R, et al. 2015. Dual megathrust slip behaviors of the 2014 Iquique earthquake sequence. Earth Planet Sci. Lett. , 411 : 177-187. DOI:10.1016/j.epsl.2014.11.041 | |
| Nadeau R M, Johnson L R. 1998. Seismological studies at Parkfield VI:Moment release rates and estimates of source parameters for small repeating earthquakes. Bull. Seism. Soc. Amer. , 88 (3) : 790-814. | |
| Ni H Y, Shen X Q, Hong D Q, et al. 2015. Characteristics of the ML3. 9 Jinzhai, Anhui, earthquake swarm sequence in 2014. Acta Sesmologica Sinica (in Chinese) , 37 (6) : 925-936. | |
| Peng Z G, Zhao P. 2009. Migration of early aftershocks following the 2004 Parkfield earthquake. Nature Geoscience , 2 (12) : 877-881. DOI:10.1038/ngeo697 | |
| Qu J H, Jiang H K, Li J, et al. 2015. Preliminary study for seismogenic structure of the Rushan earthquake sequence in 2013-2014. Chinese J. Geophys. (in Chinese) , 58 (6) : 1954-1962. DOI:10.6038/cjg20150611 | |
| Sammis C G, Rice J R. 2001. Repeating earthquakes as low-stress-drop events at a border between locked and creeping fault patches. Bull. Seism. Soc. Amer. , 91 (3) : 532-537. DOI:10.1785/0120000075 | |
| Sugan M, Kato A, Miyake H, et al. 2014. The preparatory phase of the 2009 MW6. 3 L'Aquila earthquake by improving the detection capability of low-magnitude foreshocks. Geophys. Res. Lett. , 41 (17) : 6137-6144. | |
| Sumy D F, Cochran E S, Keranen K M, et al. 2014. Observations of static Coulomb stress triggering of the November 2011 M5. 7 Oklahoma earthquake sequence. J. Geophys. Res. , 119 (3) : 1904-1923. | |
| Tan Y P, Cao J Q, Liu W B, et al. 2014. Missing earthquakes detection and seismogenic structure analysis of the Zhuolu micro-earthquake swarm in March 2013. Chinese J. Geophys. (in Chinese) , 57 (6) : 1847-1856. DOI:10.6038/cjg20140616 | |
| TangC C, LinC H, PengZ G. 2014. Spatial-temporal evolution of early aftershocks following the 2010 ML6. 4 Jiashian earthquake in southern Taiwan. Geophys. J. Int. , 199 (3) : 1772–1783. DOI:10.1093/gji/ggu361 | |
| Tracking Group of National M7 Earthquake and Earthquake Situation. 2014. The Tracking and Trend Forecasting Research Report of Earthquake Situation in China (in Chinese). Beijing:Seismological Press , 175 . | |
| Uchida N, Iinuma T, Nadeau R M, et al. 2016. Periodic slow slip triggers megathrust zone earthquakes in northeastern Japan. Science , 351 (6272) : 488-492. DOI:10.1126/science.aad3108 | |
| Vidale J E, Shearer P M. 2006. A survey of 71 earthquake bursts across southern California:Exploring the role of pore fluid pressure fluctuations and aseismic slip as drivers. J. Geophys. Res. , 111 (B5) . | |
| Waldhauser F, Ellsworth W L. 2000. A double-difference earthquake location algorithm:Method and application to the northern Hayward Fault, California. Bull. Seism. Soc. Amer. , 90 (6) : 1353-1368. DOI:10.1785/0120000006 | |
| Wang J, Liu Q Y, Chen J H, et al. 2009. Three-dimensional S-wave velocity structure of the crust and upper mantle beneath the Capital Circle Region from receiver function inversion. Chinese J. Geophys. (in Chinese) , 52 (10) : 2472-2482. DOI:10.3969/j.issn.0001-5733.2009.10.006 | |
| Wei S J, Avouac J P, Hudnut K W, et al. 2015. The 2012 Brawley swarm triggered by injection-induced aseismic slip. Earth Planet Sci. Lett. , 422 : 115-125. DOI:10.1016/j.epsl.2015.03.054 | |
| Wessel P, Smith W H F. 1995. New version of the generic mapping tools. EOS , 76 (33) : 329. | |
| Wu C Q, Meng X F, Peng Z G, et al. 2014a. Lack of spatio temporal localization of foreshocks before the 1999 MW7. 1 Düzce, Turkey, earthquake. Bull. Seism. Soc. Amer. , 104 (1) : 560-566. DOI:10.1785/0120130140 | |
| Wu C Q, Gomberg J E, Ben-Naim E, et al. 2014b. Triggering of repeating earthquakes in central California. Geophys. Res. Lett. , 41 (5) : 1499-1505. DOI:10.1002/2013GL059051 | |
| Wu J P, Ming Y H, Zhang H R, et al. 2007. Earthquake swarm activity in Changbaishan Tianchi volcano. Chinese J. Geophys. (in Chinese) , 50 (4) : 1089-1096. DOI:10.3321/j.issn:0001-5733.2007.04.016 | |
| Yu X W, Chen Y T, Zhang H. 2010. Three-dimensional crustal P-wave velocity structure and seismicity analysis in Beijing-Tianjin-Tangshan Region. Chinese J. Geophys. (in Chinese) , 53 (8) : 1817-1828. DOI:10.3969/j.issn.0001-5733.2010.08.007 | |
| Zeng R S, Lu H X, Ding Z F. 1988. Seismic refraction and reflection profilings across Tangshan epicentral region and their implication to seismogenic processes. Acta Geophys. Sin. (in Chinese) , 31 (4) : 383-398. | |
| Zhang M, Wen L X. 2015. An effective method for small event detection:match and locate (M&L). Geophys. J. Int. , 200 (3) : 1523-1537. DOI:10.1093/gji/ggu466 | |
| Zhang Z W, Cheng W Z, Liang M J, et al. 2012. Study on earthquakes induced by water injection in Zigong-Longchang area, Sichuan. Chinese J. Geophys. (in Chinese) , 55 (5) : 1635-1645. DOI:10.6038/j.issn.0001-5733.2012.05.021 | |
| Zhao C P, Chen Z L, Hua W, et al. 2011. Study on source parameters of small to moderate earthquakes in the main seismic active regions, China mainland. Chinese J. Geophys. (in Chinese) , 54 (6) : 1478-1489. DOI:10.3969/j.issn.0001-5733.2011.06.007 | |
| 陈翰林, 赵翠萍, 修济刚, 等. 2009. 龙滩水库地震精定位及活动特征研究. 地球物理学报 , 52 (8) : 2035–2043. DOI:10.3969/j.issn.0001-5733.2009.08.011 | |
| 黄媛, 杨建思, 张天中. 2006. 2003年新疆巴楚-伽师地震序列的双差法重新定位研究. 地球物理学报 , 47 (1) : 162–169. DOI:10.3321/j.issn:0001-5733.2006.01.022 | |
| 蒋海昆, 杨马陵, 孙学军, 等. 2011. 暴雨触发局部地震活动的一个典型例子:2010年6月广西凌云-凤山交界3级震群活动. 地球物理学报 , 54 (10) : 2606–2619. DOI:10.3969/j.issn.0001-5733.2011.10.018 | |
| 李乐, 陈棋福, 钮凤林, 等. 2013. 基于重复微震的小江断裂带深部滑动速率研究. 地球物理学报 , 56 (10) : 3373–3384. DOI:10.6038/cjg20131013 | |
| 李乐, 陈棋福, 钮凤林, 等. 2015. 鲜水河断裂带南段深部变形的重复地震研究. 地球物理学报 , 58 (11) : 4138–4148. DOI:10.6038/cjg20151121 | |
| 倪红玉, 沈小七, 洪德全, 等. 2015. 2014年金寨ML3. 9震群序列特征研究. 地震学报 , 37 (6) : 925–936. | |
| 曲均浩, 蒋海昆, 李金, 等. 2015. 2013-2014年山东乳山地震序列发震构造初探. 地球物理学报 , 58 (6) : 1954–1962. DOI:10.6038/cjg20150611 | |
| 全国7级地震与地震形势跟踪组. 中国大陆地震大形势跟踪与趋势预测研究报告. 北京: 地震出版社, 2014 : 175 -177. | |
| 谭毅培, 曹井泉, 刘文兵, 等. 2014. 2013年3月涿鹿微震群遗漏地震事件检测和发震构造分析. 地球物理学报 , 57 (6) : 1847–1856. DOI:10.6038/cjg20140616 | |
| 王峻, 刘启元, 陈九辉, 等. 2009. 根据接收函数反演得到的首都圈地壳上地幔三维S波速度结构. 地球物理学报 , 52 (10) : 2472–2482. DOI:10.3969/j.issn.0001-5733.2009.10.006 | |
| 吴建平, 明跃红, 张恒荣, 等. 2007. 长白山天池火山区的震群活动研究. 地球物理学报 , 50 (4) : 1089–1096. DOI:10.3321/j.issn:0001-5733.2007.04.016 | |
| 于湘伟, 陈运泰, 张怀. 2010. 京津唐地区地壳三维P波速度结构与地震活动性分析. 地球物理学报 , 53 (8) : 1817–1828. DOI:10.3969/j.issn.0001-5733.2010.08.007 | |
| 曾融生, 陆涵行, 丁志峰. 1988. 从地震折射和反射剖面结果讨论唐山地震成因. 地球物理学报 , 31 (4) : 383–398. | |
| 张致伟, 程万正, 梁明剑, 等. 2012. 四川自贡-隆昌地区注水诱发地震研究. 地球物理学报 , 55 (5) : 1635–1645. DOI:10.6038/j.issn.0001-5733.2012.05.021 | |
| 赵翠萍, 陈章立, 华卫, 等. 2011. 中国大陆主要地震活动区中小地震震源参数研究. 地球物理学报 , 54 (6) : 1478–1489. DOI:10.3969/j.issn.0001-5733.2011.06.007 | |
 2016, Vol. 59

