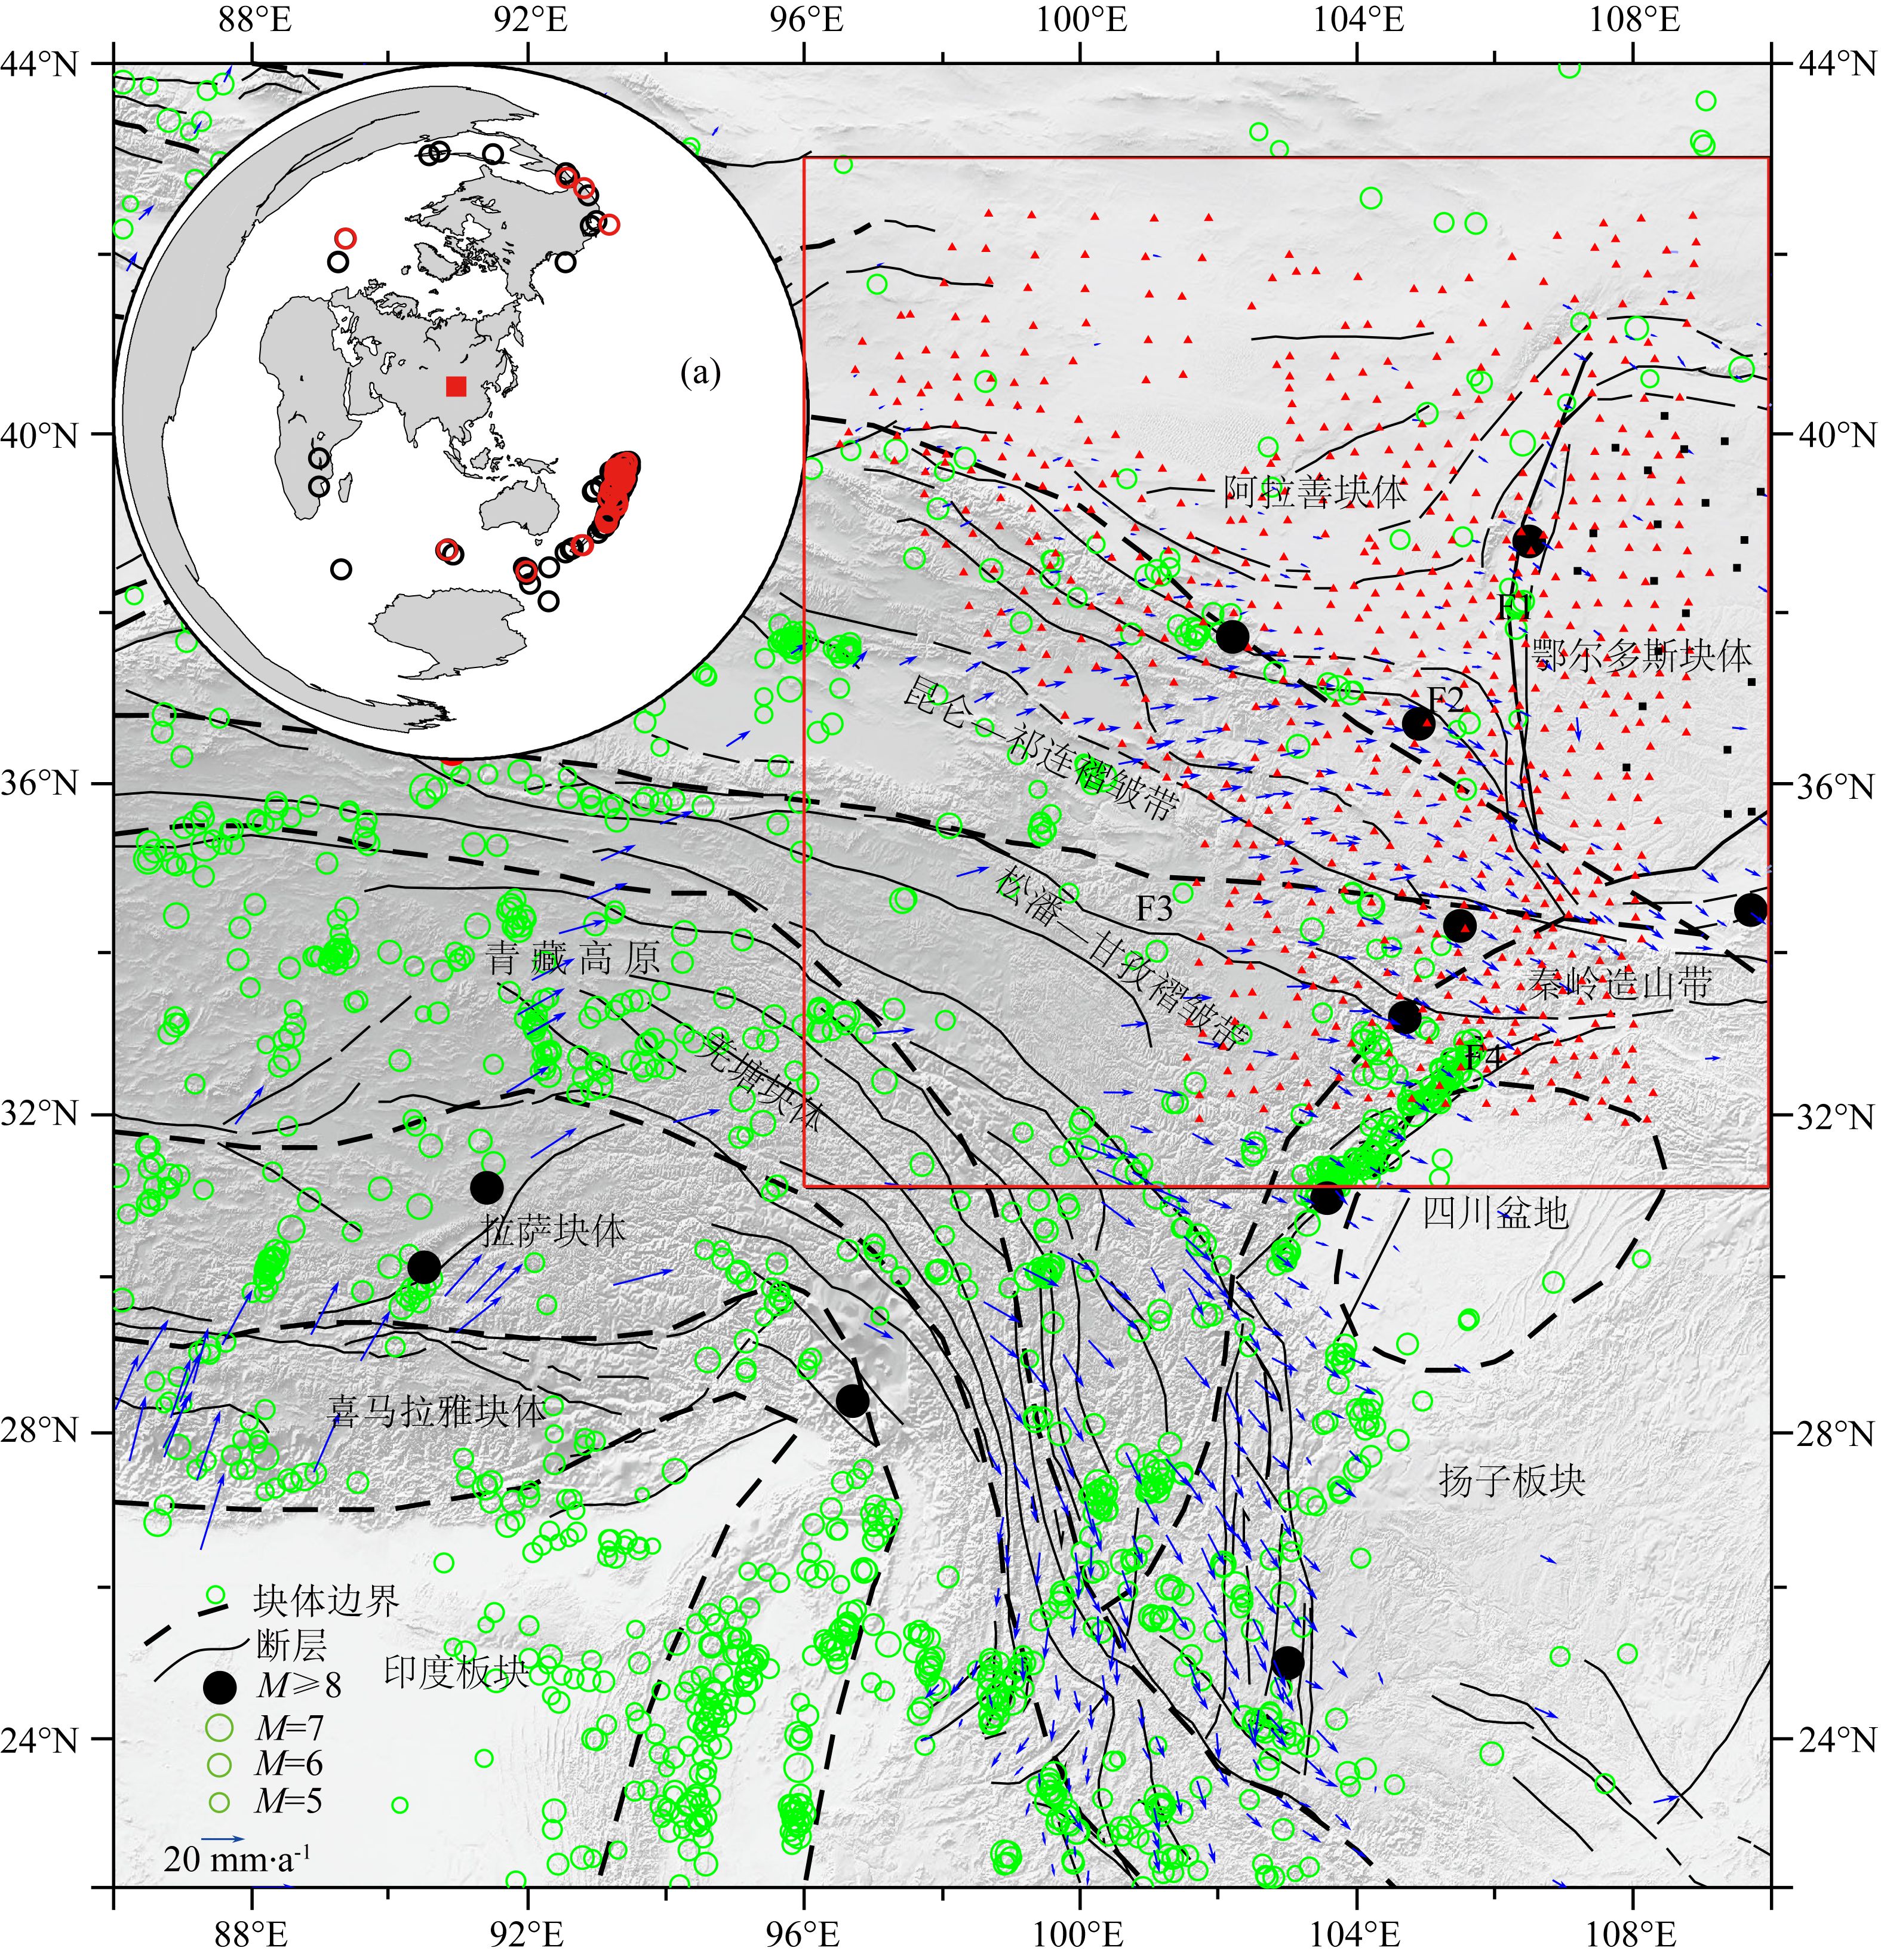
南北构造带,也被称为南北地震带,它地处中国大陆中部,是一条重要的近N—S经向地质、地貌分界线和大地构造过渡带,其为跨越和联合了多个性质不同的构造单元复合构造带,带内构造复杂,强震活动频繁(李善邦,1957; 李四光,1959; 马杏垣,1989; 葛肖虹等,2009).南北构造带北段位于青藏高原东北缘,这里为华北克拉通西部的鄂尔多斯块体和阿拉善块体与青藏高原东北缘相互作用的地区.地球上,陆-陆碰撞的造山过程最壮观的表现是由大约50 Ma开始的印度-欧亚板块碰撞所形成的青藏高原.碰撞导致了青藏高原的不断隆升、地壳增厚及其侧向逃逸(Molnar and Tapponnier, 1975; Royden et al., 1997; Dewey and Burke, 1973).青藏高原东北缘是高原物质挤出的一个重要通道,这里强烈的造山运动和大型走滑断裂活动使得青藏高原东北缘、鄂尔多斯块体和阿拉善块体交界带强震频发.据我国历史地震记载,该区域发生了我国1/3的8级以上大地震,如1654年天水8级地震,1739年平罗8级地震,1879年武都8级地震,1920年海原8.5级地震,1927年古浪8级地震(图 1).通过分析南北构造带北段地壳和上地幔变形特征对理解这一由多个构造单元组成的复合构造带形成的动力学过程和强震孕育的动力环境具有重要意义.
地震各向异性是地球内部物质的一个基本属性.上地幔各向异性一般被认为是由于应变作用下地幔物质变形导致橄榄岩中晶格的优势取向(LPO)所引起的.由于各向异性和应变密切相关,各向异性反映了深部构造的变形和动力过程.横波分裂现象作为各向异性在地震波记录中最明显的表现形式,两个分裂参数:快波偏振方向和快、慢波的时间延迟分别反映了地幔变形的方向和强度(Silver and Chan, 1991).因此,远震横波分裂测量获得的地幔各向异性参数是揭示地幔变形最直接有效的手段之一,可以用来探讨高原隆升机制和各个构造单元相互作用的动力学特征(丁志峰和曾融生,1996; 高原和滕吉文,2005).有关南北构造带北段的各向异性研究一直受到地学工作者的关注,一些学者在青藏高原东北缘和鄂尔多斯块体利用横波分裂分析该区域的上地幔各向异性特征(常利军等, 2008,2011; Wang et al., 2008; 马禾青等,2010; 李永华等,2010; Li et al., 2011; 张洪双等,2013; 王琼等,2013; Wu et al., 2015).然而,由于以前该区域的宽频带固定地震台站数量较少,而且分布不均,特别是阿拉善块体、鄂尔多斯块体内部.因此,对该区域的各向异性特征很难从整体上来详细分析.近期,中国地震科学探测台阵(ChinArray)项目顺利实施,2013年至2015年,由中国地震局地球物理研究所牵头的中国地震科学探测台阵——南北地震带北段项目在研究区布设了674个宽频带流动地震台站,再加上我们在2010年至2011年期间开展的鄂尔多斯地震台阵(Ordos Array)的21个宽频带流动地震台站(Wang et al., 2014),在研究区形成了密集且分布均匀的大型地震科学探测台阵(图 1),使得我们能够对该区域的上地幔各向异性特征进行进一步全面和详细的分析,并讨论其动力学含义.

|
图 1 南北构造带及邻区构造简图(据任纪舜等,1980)和台站分布图 图中红色方框为研究区,红色三角形为中国地震科学探测台阵(ChinArray)的台站,黑色正方形为鄂尔多斯地震台阵(Ordos Array)的台站,研究区主要断裂为: F1青铜峡—固原断裂;F2海源断裂;F3东昆仑断裂;F4龙门山断裂.虚线为块体边界.绿色圆圈为1970年以来5级以上地震,黑色实心圆为8级以上历史地震.蓝色箭头代表GPS测量的地表运动速度场(Gan et al., 2007).插图a为本文选取的远震事件分布图,黑色圆圈是为中国地震科学探测台阵(ChinArray)选取的72个远震事件,红色圆圈是为鄂尔多斯地震台阵(Ordos Array)选取的61个远震事件. Fig. 1 Map showing major tectonic features of the north-south tectonic belt and surrounding regions(from Ren et al., 1980), and regional geologic setting of the study area and location of stations The study area is shown by the red square. Red triangles and black squares represent seismic stations of the ChinArray and Ordos Array,respectively. Black lines are major faults. F1: Qingtongxia-Guyuan Fault; F2: Haiyuan Fault; F3: East Kunlun Fault; F4: Longmenshan Fault. Dashed lines represent boundaries between blocks. Green circles show earthquakes with M>5 since 1970s. Black solid circles mark historical earthquakes with M≥8. Blue arrows display GPS velocity vectors calculated in the stable Eurasian reference frame(Gan et al., 2007). Inset(a)shows epicenters of events used in the study. Black and red dots represent 72 events and 61 events recorded by the ChinArray and Ordos Array,respectively. |
地球科学家对高原隆升提出了多种解释模型.例如,Tapponnier等(1982)提出了“挤出说”或“逃逸说”的运动学模式,England和Houseman(1986)提出了“连续变形”的动力学模式,还有一些学者提出了下地壳塑性流动说(Royden et al., 1997),即通道流(channel flow)模型.每个模型都试图解释高原变形隆升的性质.然而,如何理解岩石圈地幔在造山过程中的作用却仍然是个问题.如果我们能够直接测量实际的地幔变形并表征它与地壳变形的关系,这将构成理解地幔变形作用在造山增长原因的基本手段.当前,这样的求值方法可以通过联合分析地表变形数据和地幔各向异性来获得(Silver and Holt, 2002; Flesch et al., 2005; Wang et al., 2008; Chang et al., 2015).本文联合南北构造带北段GPS观测的地表变形数据和由密集的宽频带地震台阵得到的横波分裂测量反映的地幔变形数据分析了高原东北缘、阿拉善块体和鄂尔多斯块体的岩石圈变形耦合程度和动力学含义.
2 横波分裂测量地震资料来自于中国地震科学探测台阵——南北地震带北段项目(“喜马拉雅”项目二期)布设的674个宽频带流动地震台站(观测时间为2013年到2015年,地震计为CMG-3ESP,频带范围为50 Hz~60 s),21个来自国家自然科学基金重点项目资助布设在鄂尔多斯地震台阵的宽频带流动地震台站(观测时间为2010年到2011年,地震计为CMG-3ESP,频带范围为50 Hz~60 s),总计695个台站记录的远震波形资料(图 1).在远震横波分裂测量中,基于中国地震台网(CSN)地震目录,选取震中距范围85°~135°,震级MS>5.8,震相清晰的XKS(SKS、SKKS和PKS)波形资料.
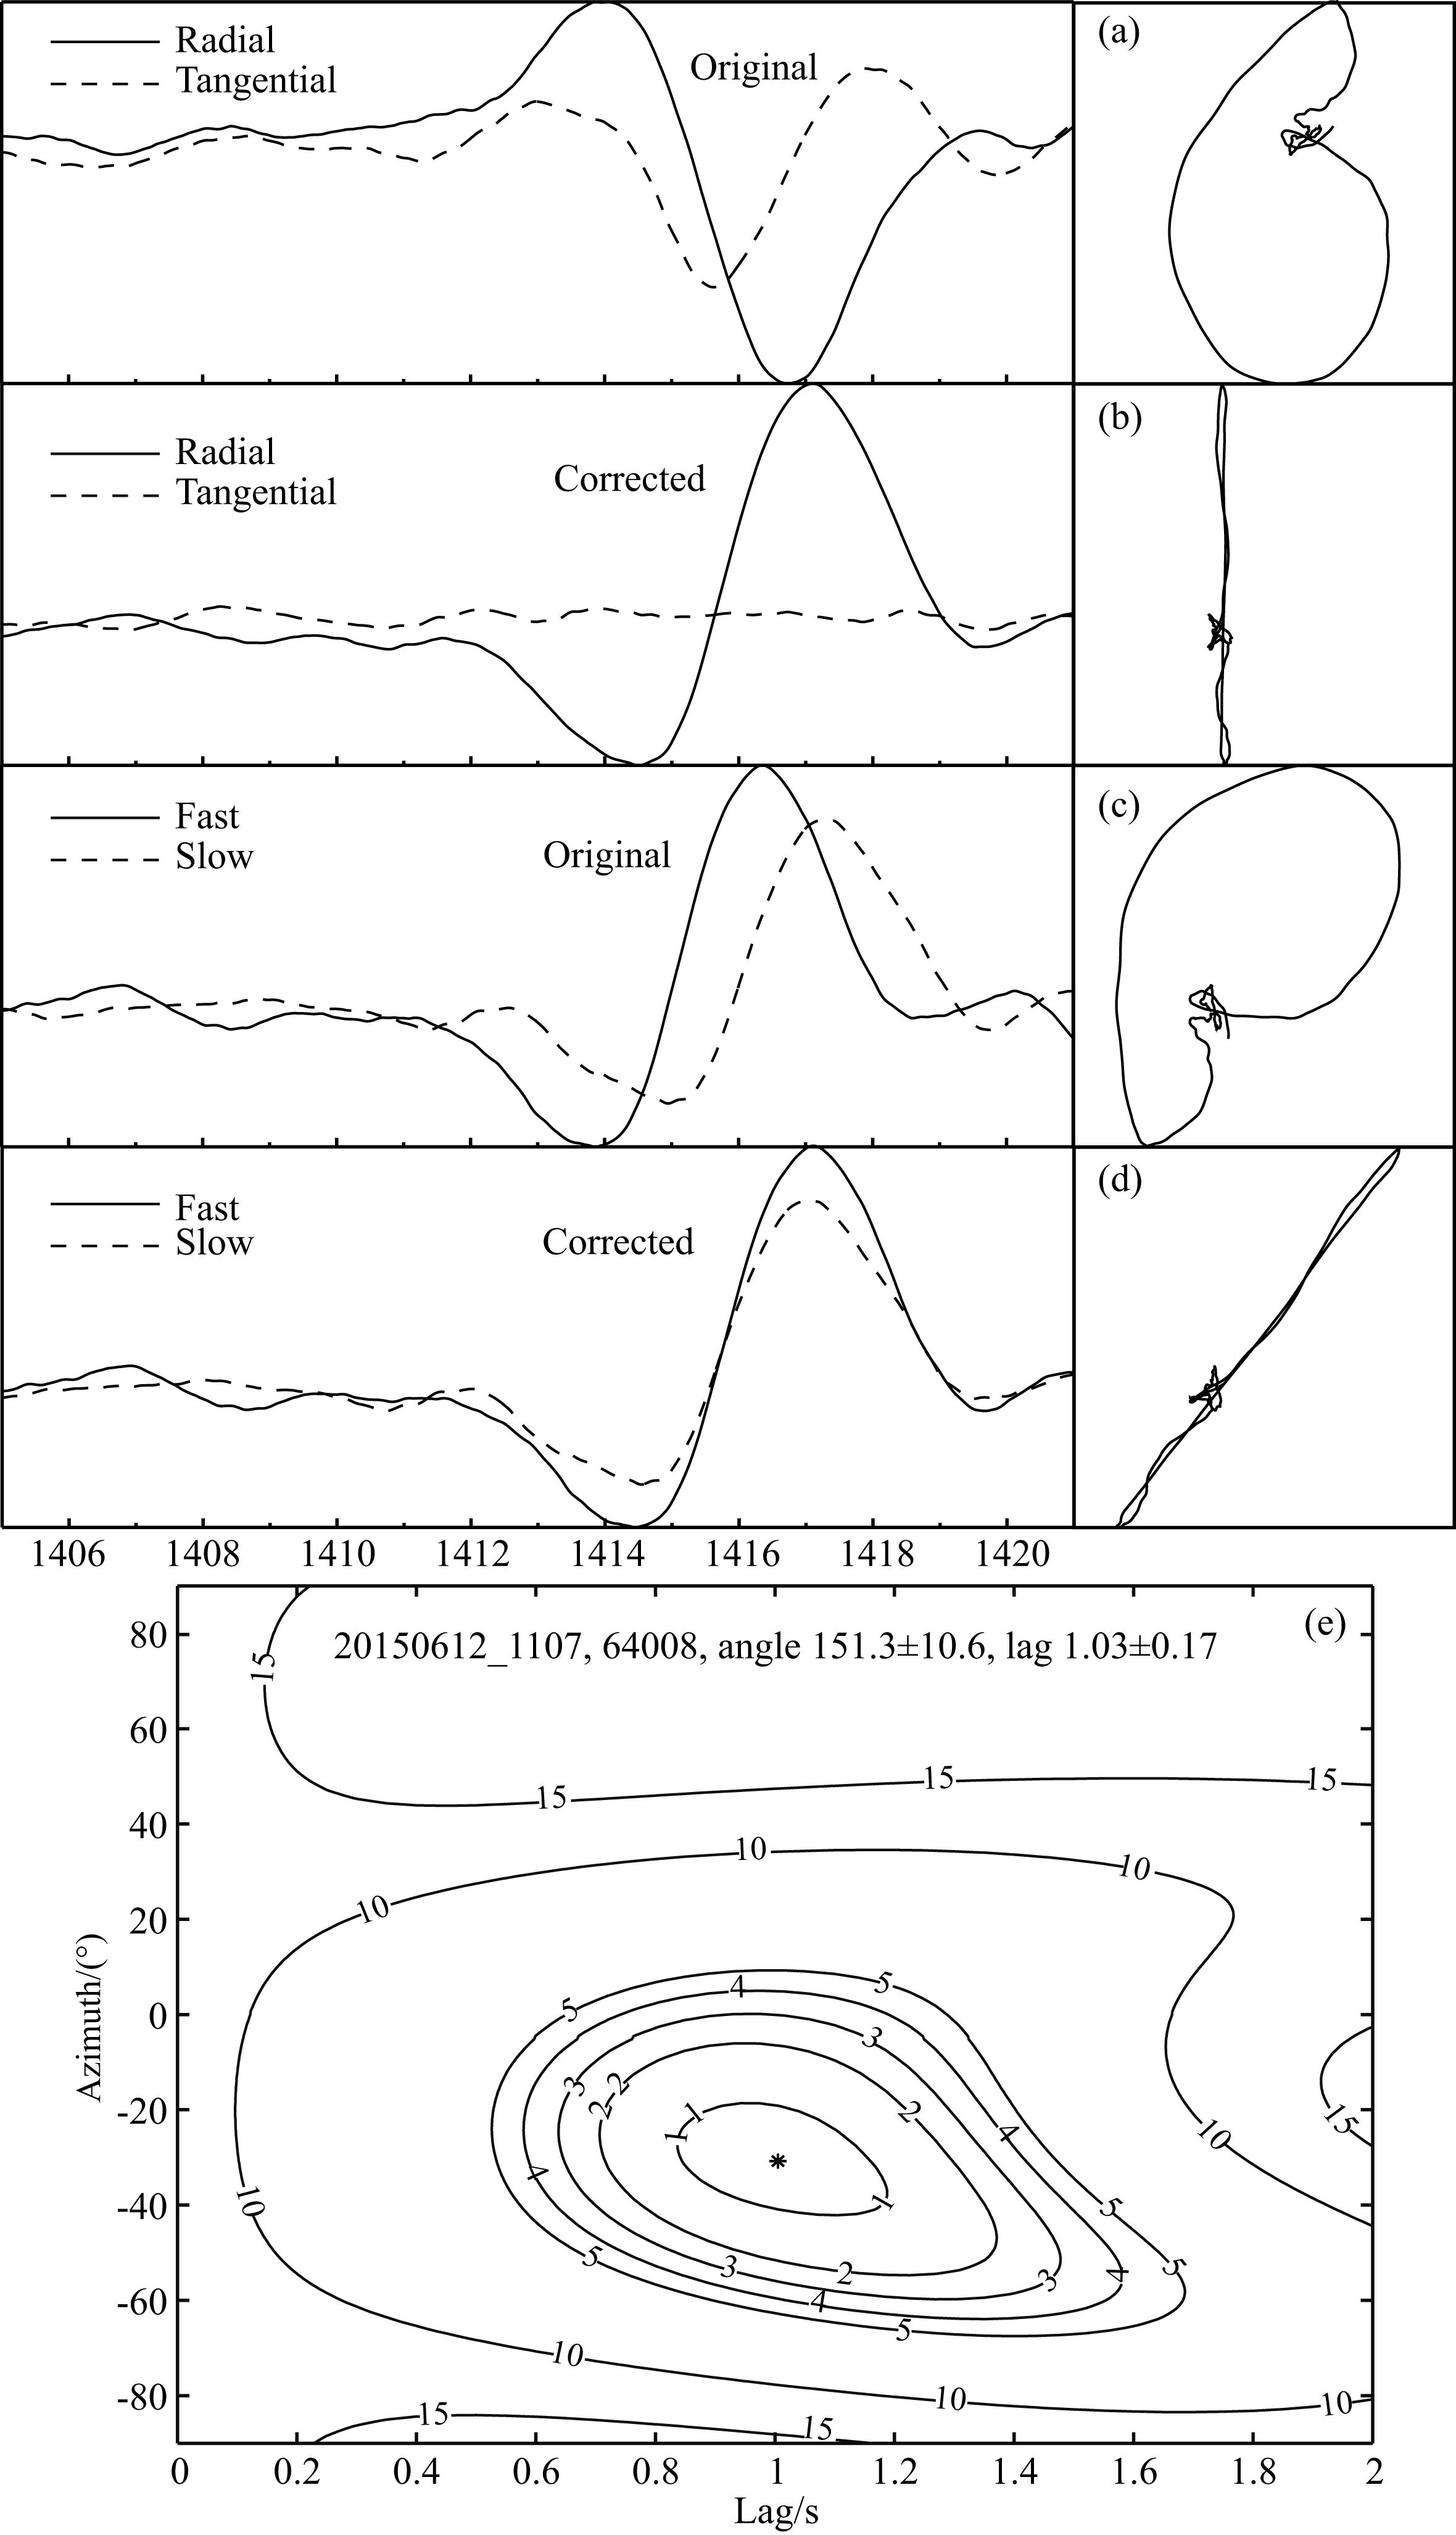
对选取的远震XKS波形记录,我们采用最小切向能量的网格搜索方法(Silver and Chan, 1991)和“叠加”处理(Wolfe and Silver, 1998)来测量每一个台站的横波分裂参数,解的误差估计用95%的置信度.数据预处理采用带通滤波(0.03~0.5 Hz),为了确保测量结果的正确,每次横波分裂测量过程严格按照下面标准去检验:(1)选取的XKS波在旋转到径向和切向坐标轴上,切向分量要明显,且质点运动图为椭圆,以表明横波具有明显的分裂特征;(2)通过横波分裂分析测量得到横波分裂参数,在进行各向异性校正后,横波旋转到径向和切向坐标轴上,切向分量变得很小,且质点运动图为近似直线;(3)各向异性校正前的快、慢波之间有明显的到时差,且质点运动图为椭圆;(4)校正后的快、慢波之间的到时差变得很小,且质点运动图近似为直线.图 2显示了对2015年6月12日11时07分汤加群岛MW6.0地震在53004台的记录所作的SKS波分裂分析.图 3显示了64008台从3个远震事件(2014年12月30日21时17分MW6.0;2015年5月30日17时18分MW5.9;2015年6月25日18时45分MW6.0)获得的SKS波分裂分析结果(图 3a、图 3b和图 3c)与使用“叠加”处理后结果(图 3d)的比较,这3个分裂参数误差较大的事件,经过叠加之后最终分裂参数的误差明显减小.

|
图 2 SKS波分裂分析示例 (a)原始的径向和切向上的波形和质点运动图;(b)经过各向异性校正后的径向和切向上的波形和质点运动图;(c)原始SKS震相转到快波和慢波轴方向的波形和质点运动图;(d)经过各向异性校正后SKS震相在快波和慢波轴方向的波形和质点运动图;(e)切向能量等值线图,星号处对应了最佳的分裂参数. Fig. 2 Shear wave splitting analysis for an SKS event recorded at station 53004 (a)Radial and tangential components;(b)Radial and tangential components after the energy in the tangential component is removed;(c)Components from Fig. 2a rotated to the fast and slow directions;(d)Fast and shifted slow components. Particle motion is shown on the right of each seismogram;(e)Contours of the energy on the corrected tangential component. Black asterisk is the best estimate. |

|
图 3 64008台单个远震事件SKS波分裂分析的切向能量等值线图(a)、(b)和 (c)以及由这三个事件叠加得到的切向能量等值线图(d) 图中星号表示最佳分裂参数的位置. Fig. 3 Tangential energy contour of SKS splitting analysis from three teleseismic events(a),(b), and(c),and the stacked tangential energy contour(d)at station 64008 The asterisk denotes the position of optimal parameter pair. |
根据上述方法,我们测量了南北构造带北段695个宽频带流动地震台记录的远震XKS波形,得到了每个台站的横波分裂参数.由于地震台阵位于中国西部,整体背景噪声较低,数据记录的整体质量较好,2年多的观测时间,获得的可用于分裂分析的远震事件较多,并且单个事件分析的基础上进行了“叠加”分析处理,因而绝大多数的流动台站的分裂测量质量比较好.总体上,绝大多数的台站经过“叠加”分析处理后,其快波方向的误差小于10°,快、慢波的时间延迟小于0.2 s.根据每个台站得到的各向异性参数离散性分析,没有大的离散,没有表现出随事件反方位角规律性的变化,体现了单层各向异性特征.
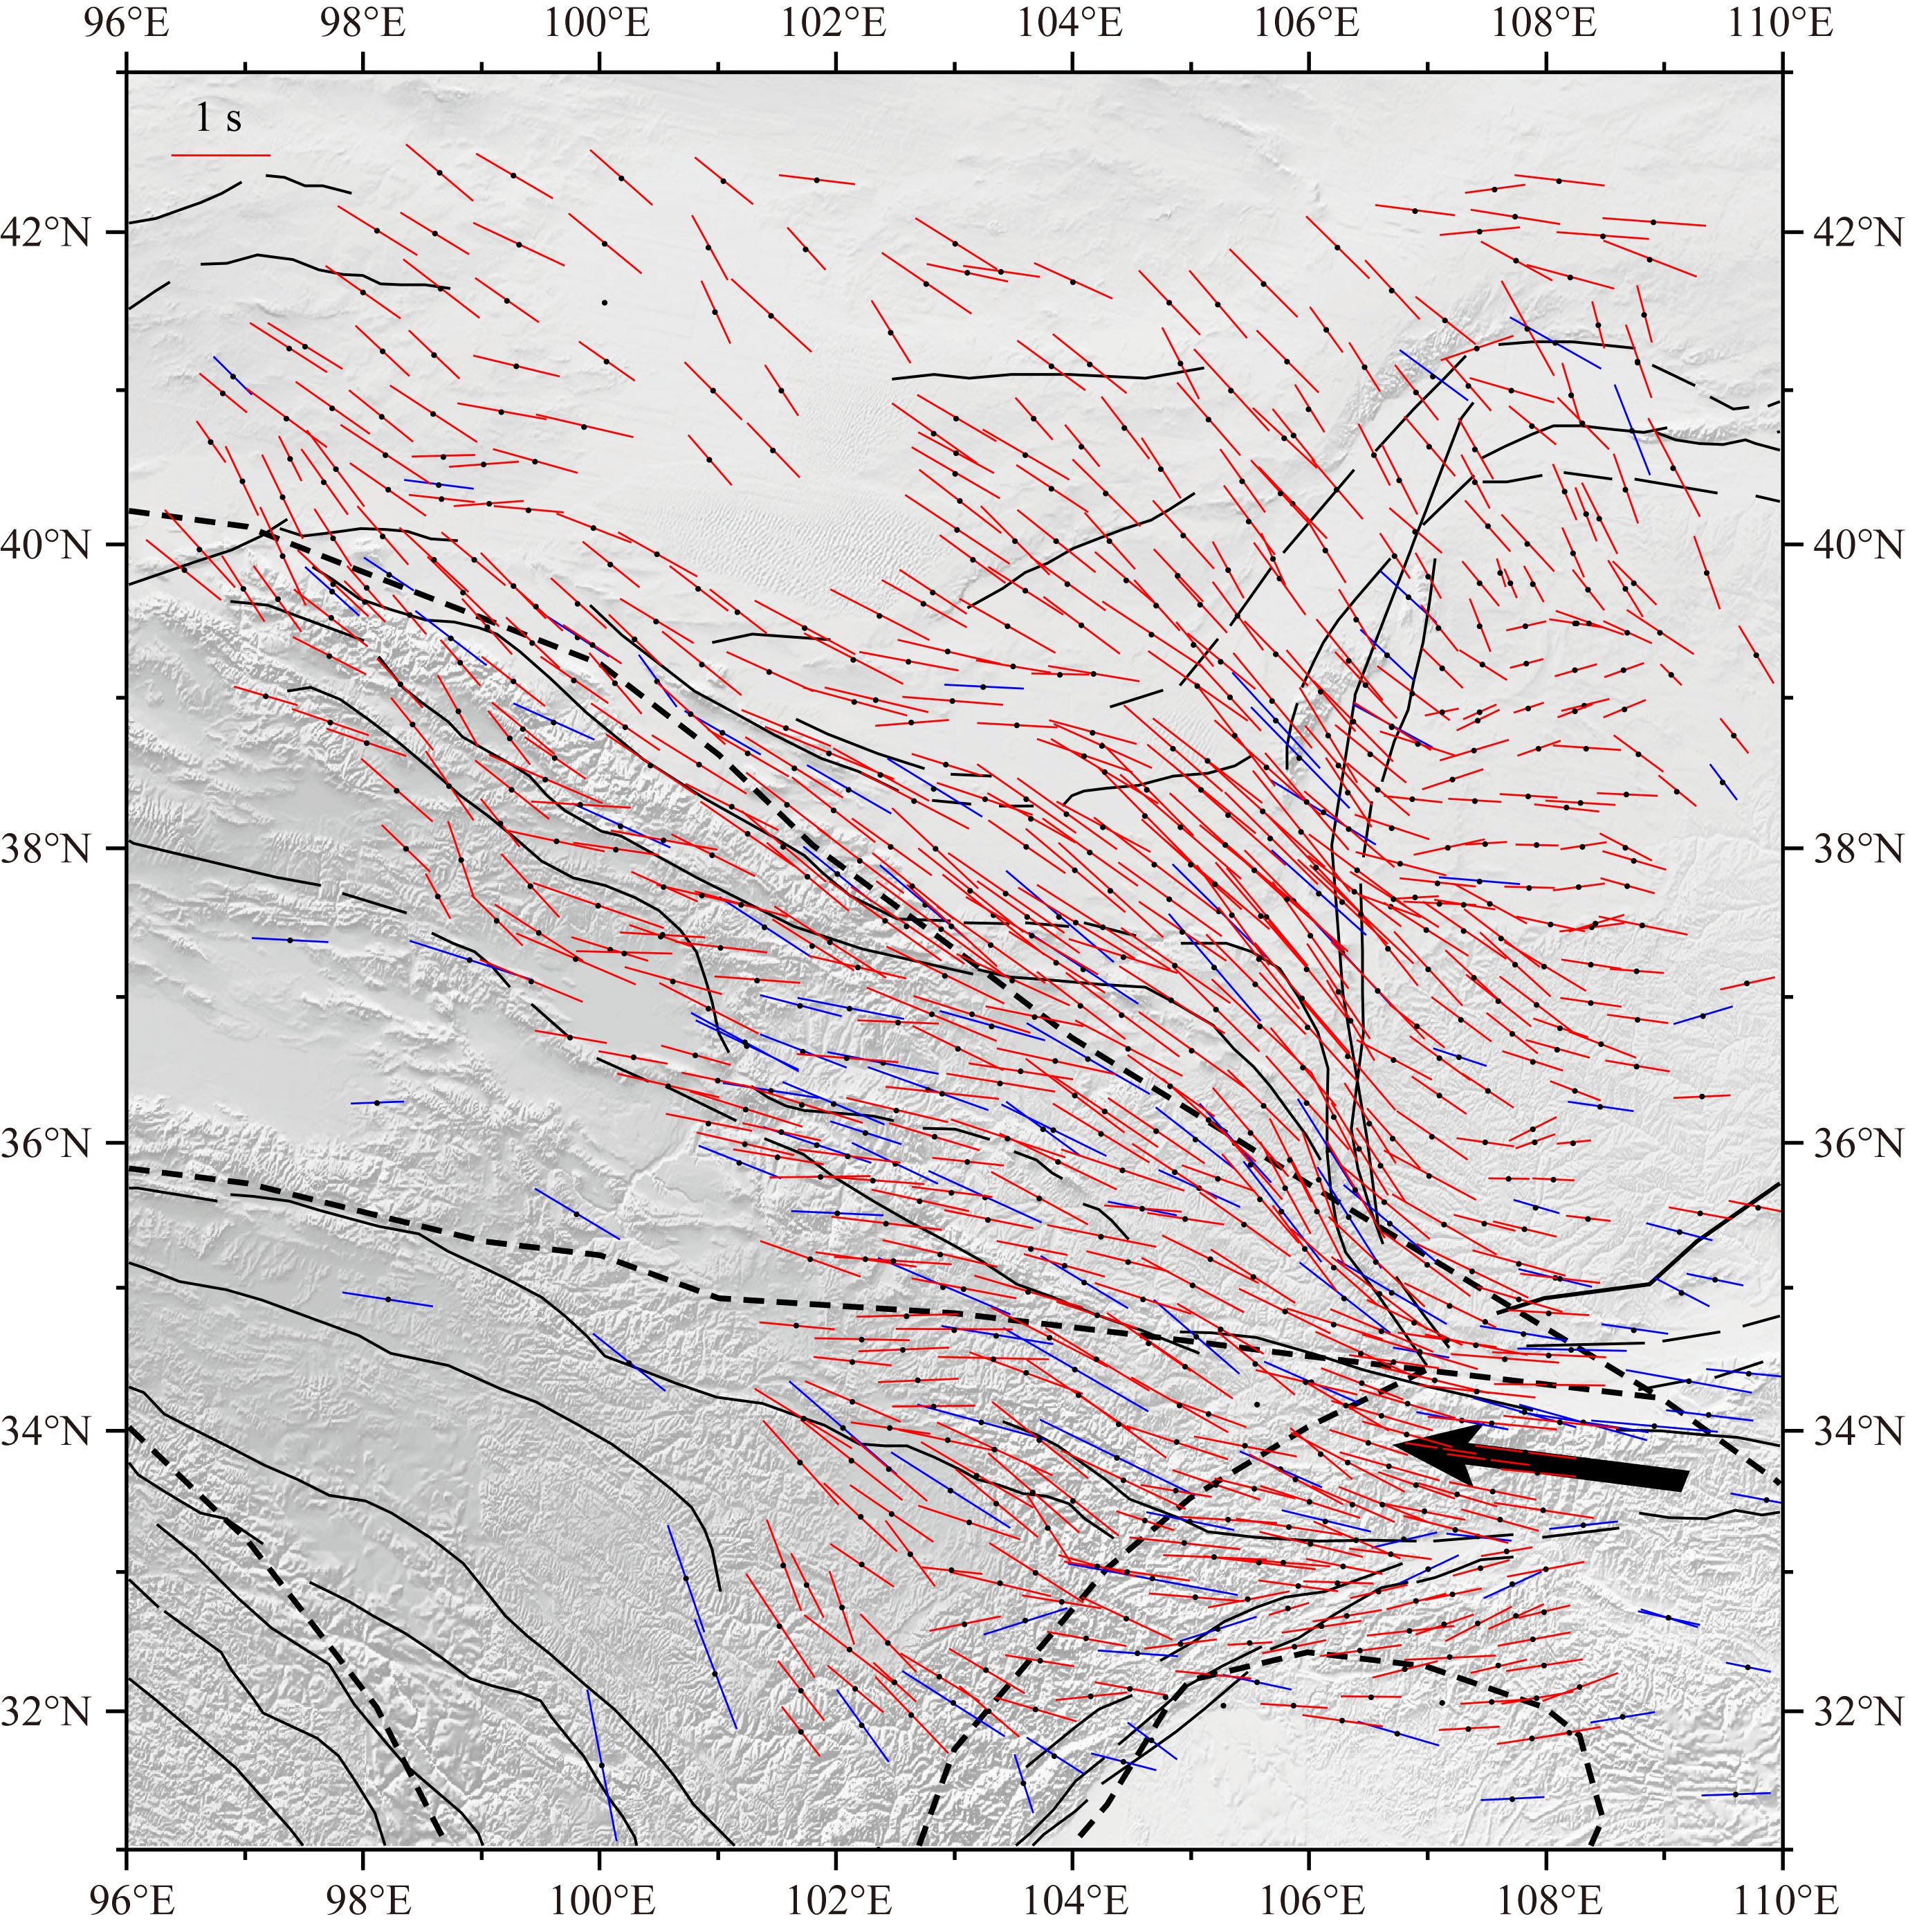
基于南北构造带北段695个流动台站测量的横波分裂参数结果,并结合我们以前在该区域获得的122个固定台站分裂结果(常利军等, 2008,2011; Wang et al., 2008),我们用这817个台站的分裂数据绘制了南北构造带北段目前最全面的上地幔各向异性图像(图 4和图 5).从图 1中看,流动台站的结果与其邻近的固定台站结果一致,密集和均匀的台站分布展现了其面状分布的特征.从快波方向分布来看(图 4),青藏高原东北缘、阿拉善块体和鄂尔多斯块体西缘的快波方向主要表现为NW—SE方向,位于鄂尔多斯块体南缘的秦岭造山带的快波方向为近E—W方向,鄂尔多斯块体内部的快波方向在北部为近N—S方向,南部表现为近E—W方向.从快、慢波的时间延迟分布来看(图 5),鄂尔多斯块体的时间延迟不仅明显小于其周缘地区,而且小于其他构造单元.特别是在高原东北缘、阿拉善块体和鄂尔多斯块体的交汇地区的时间延迟很大,其平均时间延迟达1.3 s,而鄂尔多斯块体内部时间延迟平均值仅为0.6 s.与鄂尔多斯块体同属华北克拉通西部块体的阿拉善块体其平均时间延迟约1 s,也明显大于鄂尔多斯块体.整体来看,构造活跃地区的时间延迟明显大于构造稳定地区,特别是图 5中时间延迟分布最大的区域对应了研究区内8级以上强震的分布.

|
图 4 南北构造带北段各台站XKS波分裂测量结果红色直线段为流动台阵的结果,蓝色直线段为以前固定台站的结果(常利军等, 2008,2011; Wang et al., 2008). 线段的方向表示快波方向,线段的长度表示时间延迟的大小.黑色粗箭头为绝对板块运动(APM)方向. Fig. 4 Measurements of XKS splitting in the northern segment of the north-south tectonic belt Red bars and blue bars represent splitting measurements at temporary stations and previous permanent stations(Chang et al., 2008,2011; Wang et al., 2008),respectively. The orientations and length of bars indicate the fast polarization direction and the delay time,respectively. Black thick arrowhead represents the direction of absolute plate motion(APM). |

|
图 5 南北构造带北段快、慢波时间延迟和8级以上地震分布图 Fig. 5 Distribution of delay times and megaquakes in the northern segment of the north-south tectonic belt |
XKS波分裂测量的各向异性快波偏振方向代表了地幔橄榄岩有限应变引起的晶格优势取向(LPO)(Silver and Chan, 1991).因此,快波方向φ平行于构造应力作用下橄榄岩的a轴.实验室研究显示,在缺少部分熔融或富含水的情况下,对于A-型的LPO,在简单剪切变形中,橄榄岩的a轴平行于有限应变的最大剪切方向(Zhang and Karato, 1995);在纯剪切变形中,A-型橄榄岩的a轴平行于有限应变的拉张方向(Nicolas et al., 1973).
由于简单剪切下,地表瞬时最大剪切方向与有限应变最大剪切方向平行;纯剪切下,地表瞬时最大剪切方向与有限应变最大伸展方向平行.与有限应变对应的快波方向将平行于地表应变瞬时最大剪切(伸展)方向.因此,在简单剪切和纯剪切假设下,有限应变引起的快波方向φ分别平行于简单剪切下的地表瞬时最大剪切方向和纯剪切下的地表瞬时最大伸展方向.所以,我们可以由GPS和断裂第四纪滑动速率测量数据确定的地表运动学模型来计算最大剪切和伸展方向,并和地幔各向异性的快波方向的对比分析来评估南北构造带北段的垂直连贯变形程度.
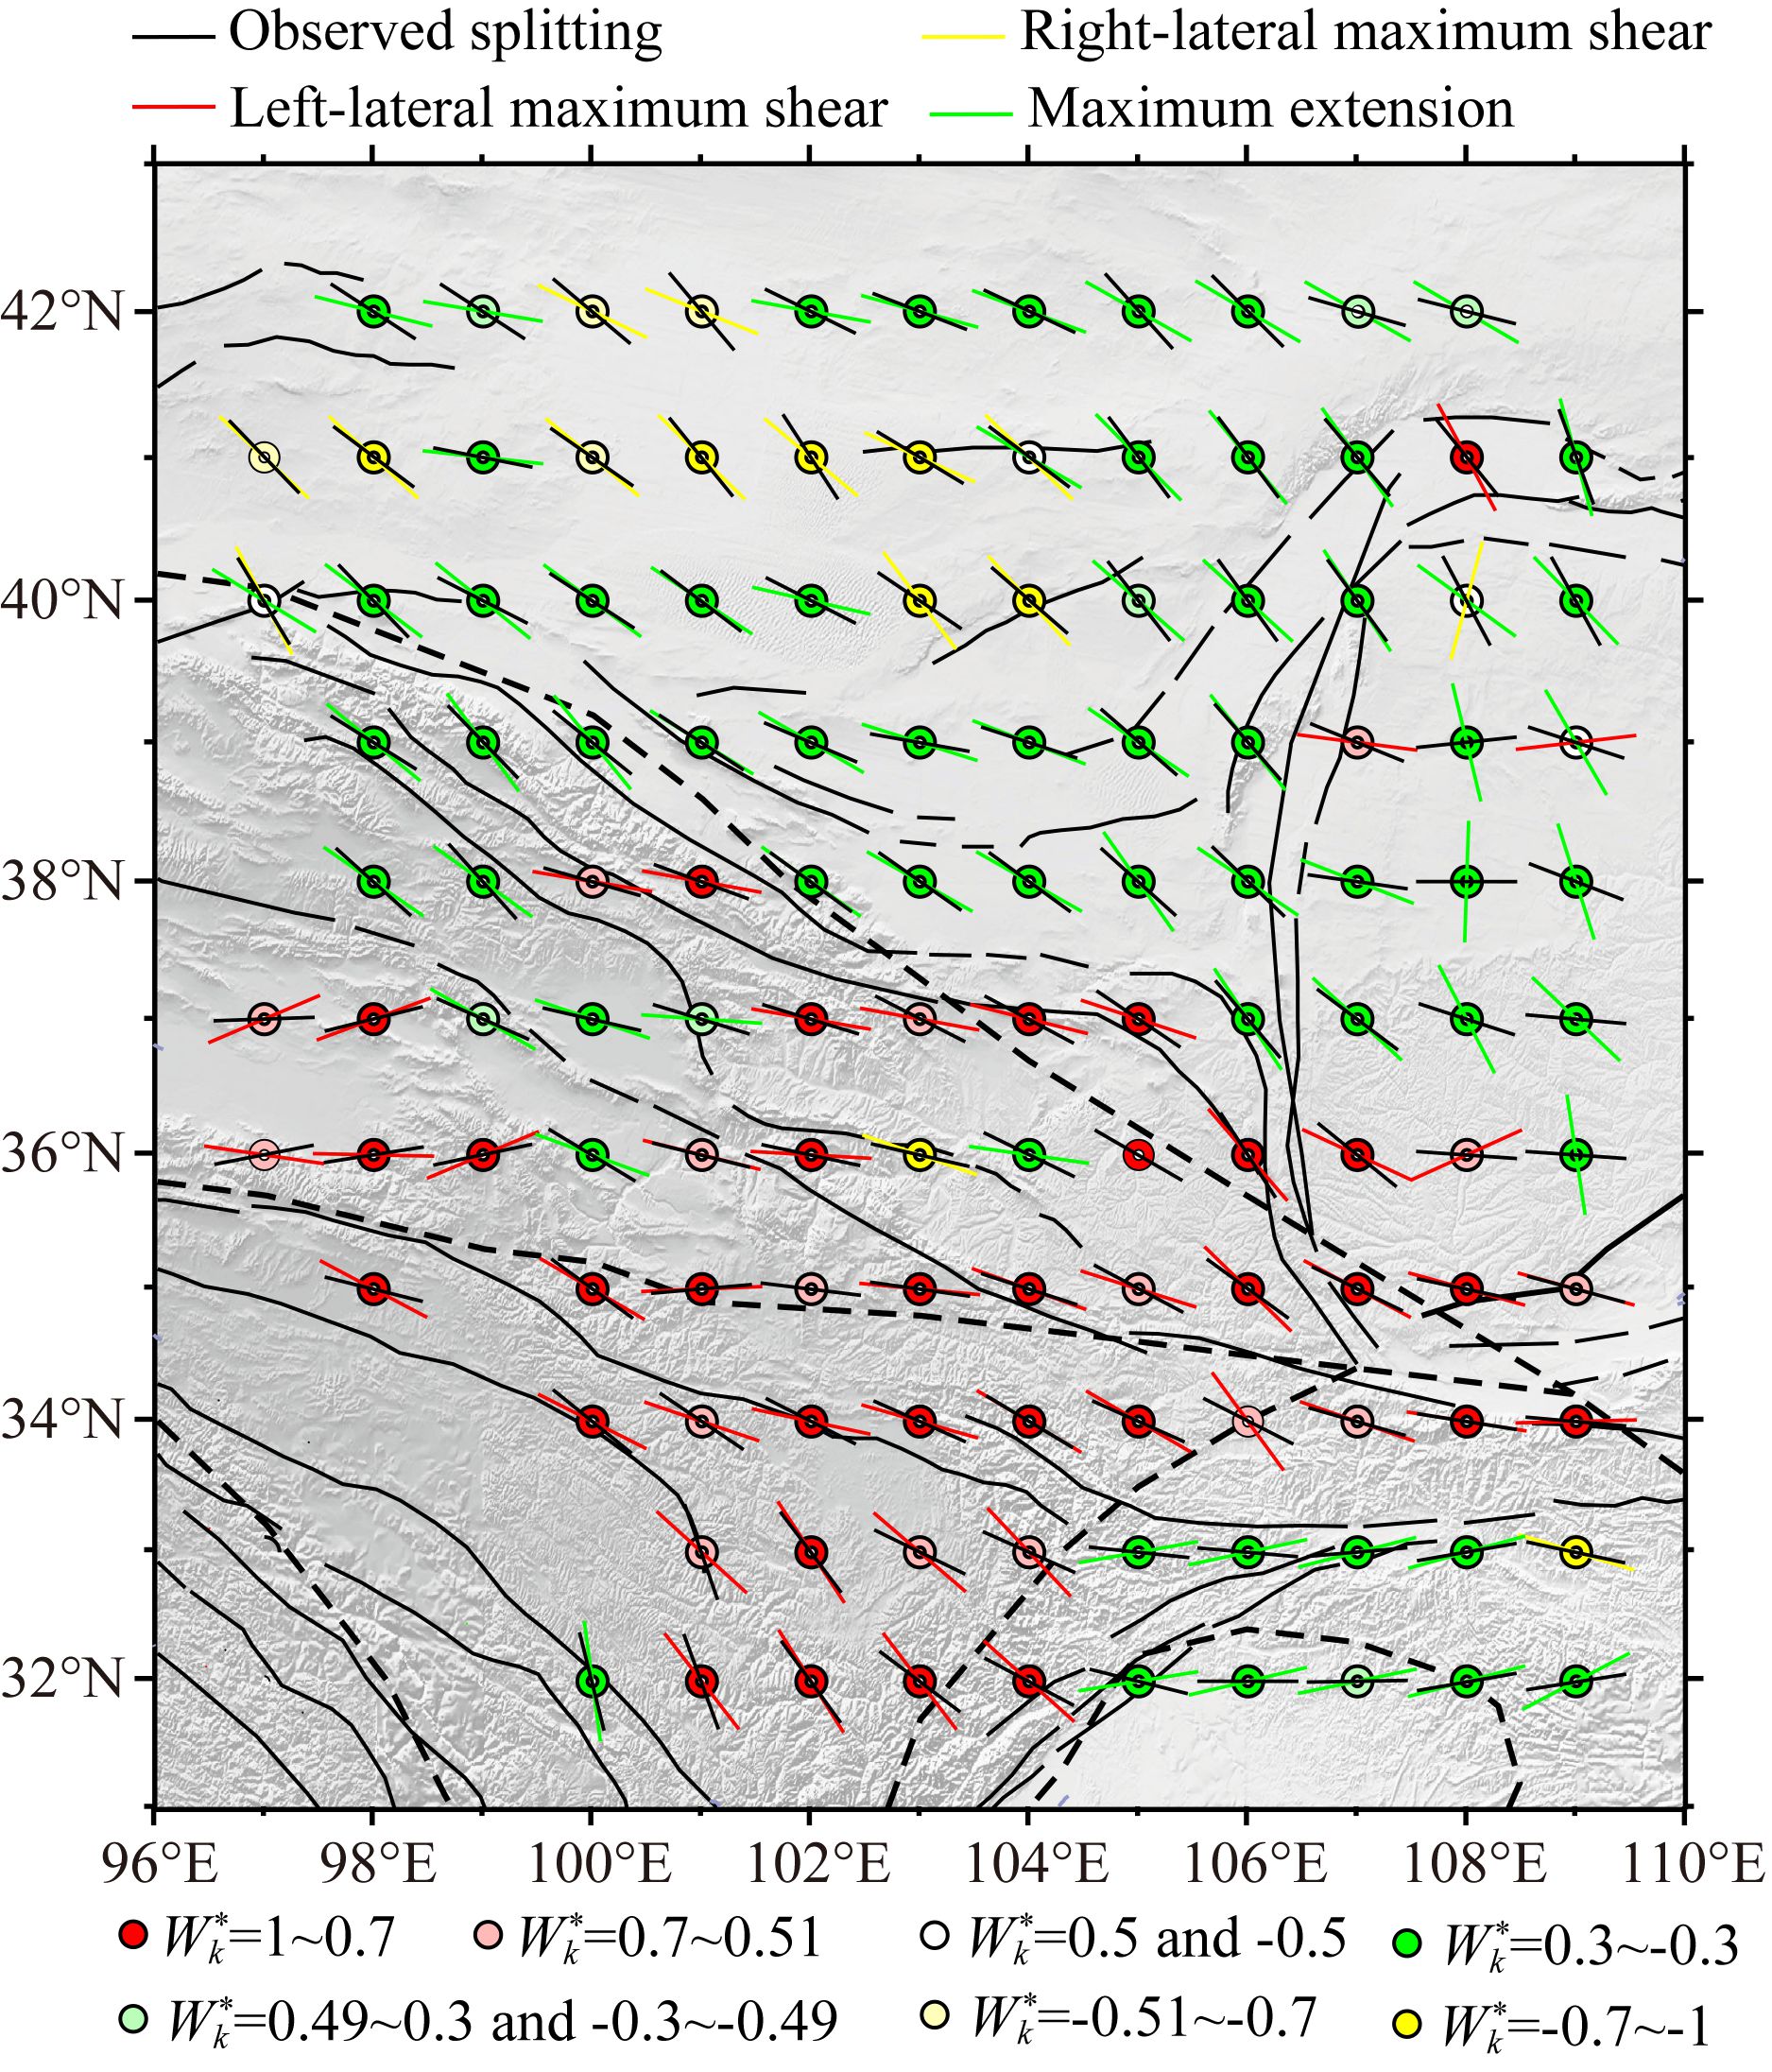
根据岩石圈变形模式分析方法(Silver and Holt, 2002; Flesch et al., 2005; Wang et al., 2008; Chang et al., 2015),我们联合分析了695个新得到的和122个以前得到的横波分裂结果(常利军等, 2008,2011; Wang et al., 2008)、GPS和断裂第四纪滑动速率数据.基于817个台站的横波分裂测量结果,得到了南北构造带北段横波分裂参数1°×1°网格平均结果(图 6),作为表征地幔变形场的数据.为了得到由地表变形场预测的地幔各向异性,我们利用Chang等(2015)基于出版的GPS和断裂第四纪滑动速率数据得到的地表连续变形场(速度场和应变率场)预测了每个测点分别称为左旋简单剪切、右旋简单剪切和纯剪切的φlss,φrss和φps.为了判定每个测点的岩石圈变形模式,我们引入了运动学涡度Wk*(McKenzie,1979; Fossen and Tikoff, 1993),并计算了每个测点的Wk*(图 6).Wk*=+1(-1)和Wk*=0分别表示左旋(右旋)简单剪切变形和纯剪切变形(Kaminski and Ribe, 2002).对于Wk*=±0.5时,同时给出了纯剪切和简单剪切下的预测的快波方向(McKenzie,1979).

|
图 6 横波分裂测量的1°×1°网格平均快波方向φ 与地表变形场预测的快波方向φc比较 基于运动学涡度Wk*确定了每个测点的预测的快波方向φc,即φc=φlss(最大左旋简单剪切方向,红色线段),φc=φrss(最大右旋简单剪切方向,黄色线段),φc=φps(纯剪切的最大拉伸方向,绿色线段). 对于Wk*=±0.5的测点,图中还同时显示了纯剪切和简单剪切下的预测的快波方向. Fig. 6 Comparison between 1°×1° grid average fast-wave direction from splitting observations and predicted fast axis orientation φc calculated from the surface deformation field The kinematic vorticity estimate,Wk*(see above)at each anisotropy measurement is used to predict φc=φlss(left-lateral simple shear,red),φc=φrss(right-lateral simple shear,yellow),or φc=φps(maximum extension pure shear,green). For Wk*=±0.5,both pure shear and simple shear predicted fast axis are displayed. |
图 6显示了南北构造带北段XKS波分裂测量的1°×1°网格平均快波方向φ与地表变形场预测的快波方向φc比较,并且给出了每一个测点的运动学涡度Wk*.除鄂尔多斯块体内部的横波分裂测量的快波方向φ与由地表运动场预测的快波方向φc之间的角度差较大(绝大部分测点的角度差大于30°),青藏高原东北缘、阿拉善块体、鄂尔多斯周缘和秦岭造山带测量的快波方向φ很好地对应了由地表运动场预测的快波方向φc.在青藏高原东北缘的东南部,绝大部分测点的φ可以被φc=φlss成功地预测,岩石圈变形模式主要表现为是左旋简单剪切变形;在青藏高原东北缘的西北部,绝大部分测点的φ可以被φc=φps成功地预测,岩石圈变形模式主要表现为是纯剪切变形;在阿拉善块体和鄂尔多斯块体西缘,大部分测点的φ可以被φc=φps成功地预测,岩石圈变形模式表现为是纯剪切变形,但在阿拉善块体中部的部分测点的φ可以被φc=φrss成功地预测,岩石圈变形模式表现为是右旋剪切变形;鄂尔多斯南缘的秦岭造山带北部至渭河地堑,φ被φc=φlss成功地预测,岩石圈变形模式主要表现为是左旋简单剪切变形;秦岭造山带南部的φ可以被φc=φps成功地预测,岩石圈变形模式表现为是纯剪切变形;在鄂尔多斯块体内部,绝大部分测点的φ不能被φc=φlss,φc=φrss和φc=φps其中的任何一种模式成功地预测,岩石圈变形模式表现复杂.
5 讨论与结论 5.1 各向异性层的分布XKS波分裂反映了横波从核幔边界到接收台站整个传播路径上的综合效应,其横向分辨率很高,但垂直分辨较差,各向异性层可能存在于地壳、上地幔岩石圈、岩石圈下的软流圈,以及下地幔的任何地方,但实际上更接近于上部.同一事件在相近台站观测到差异较大的XKS 波分裂结果,例如鄂尔多斯块体内部和西缘相邻的一些台站间的距离只有几十公里,这些台站下同一事件XKS波射线在深部几乎沿同一路径传播,只是到接近接收台站才分开,如果各向异性层来自深部,那么结果应该相同,但事实上它们的分裂参数相差很大,说明各向异性层不可能来自深的下地幔. 另外,同一台站从不同方位入射的XKS 波的路径在浅部基本相同,在地幔深部不同,如果各向异性介质存在于下地幔,则同一台站下不同方位到的XKS 波应是不同地区深部各向异性介质的影响,结果应有很大的差异,显然与我们的观测结果不符,从这一方面也说明各向异性层主要分布在上地幔及其以上范围.关于地壳各向异性的约束,全球平均尺度的地壳各向异性约0.2 s(Silver,1996).尽管研究区的地壳厚度相对较厚(从鄂尔多斯块体和阿拉善块体约为40 km逐步过渡到青藏高原约为60 km)(Tian and Zhang, 2013; Li et al., 2014),在青藏高原东北缘,Herquel等(1995)通过Moho界面的Ps转换波得到的地壳各向异性研究结果为0.2~0.3 s.常利军等(2010)、马禾青等(2011)和郭桂红等(2015)通过近垂直入射的直达S波在青藏高原东北缘和鄂尔多斯块体西缘估算的地壳各向异性延迟时间为0.1~0.3 s.Wang等(2016)利用接收函数波形提取了青藏高原东北缘少量台站的地壳各向异性,得到局部地区地壳可以产生0.36~1.06 s的时间延迟,与该区其他结果相差较大,可能这种影响是局部的.综合考虑研究区的地壳各向异性产生的分裂延迟平均值约为0.2 s,因此,南北构造带北段各向异性层主要来自于上地幔,地壳各向异性对XKS波分裂影响较小.
南北构造带北段的各向异性可能来自岩石圈,也可能来自软流圈,下面的论述将提供一些约束.在研究区,秦岭造山带的岩石圈厚度约为110 km,鄂尔多斯块体约为150 km,青藏高原东北缘和阿拉善块体约为170 km(An and Shi, 2006).假设大陆岩石圈地幔的各向异性度为4%(Mainprice and Silver, 1993),1 s的分裂时间延迟估算的各向异性层厚度约为110 km.秦岭造山带的平均时间延迟为1.2 s,去除地壳各向异性影响造成的0.2 s时间延迟后,需要110 km的地幔岩石圈对应1.0 s的时间延迟,而减去50 km厚的地壳后,秦岭地幔岩石圈厚度只有60 km,说明秦岭造山带下的各向异性来自于岩石圈和软流圈的综合效应.青藏高原东北缘,其平均时间延迟从西北部约1 s增加到东南部约1.3 s,需要从西北部的90 km到东南部120 km厚度的地幔岩石圈产生0.8 s到1.1 s的分裂时间延迟,高原东北缘的地幔岩石圈厚度约为110 km,因此,高原东北缘的各向异性主要来自岩石圈.阿拉善块体的平均时间延迟为1 s,其120 km厚的地幔岩石圈足以产生地幔内0.8 s的分裂时间延迟.鄂尔多斯块体的平均时间延迟为0.6 s,其110 km厚的地幔岩石圈也足以产生地幔内0.4 s的分裂时间延迟.通过一阶Fresnel带(Alsina and Snieder, 1995)的推断,研究区各向异性层主要分布在50~170 km之间.综上所述,南北构造带北段除秦岭造山带的各向异性层主要来自于上地幔岩石圈和软流圈外,其他构造单元的各向异性主要位于上地幔岩石圈.
5.2 各向异性成因青藏高原东北缘测量的NW—SE方向快波方向φ不仅平行于大型断裂和造山带的构造走向,而且与地表变形场预测的快波方向φc一致(图 6),说明其地表变形场和地幔变形场一致,地壳强烈地耦合于岩石圈地幔,符合岩石圈垂直连贯变形特征.青藏高原东北缘的东南部测量的快波方向φ平行于预测的快波方向φlss,很好地对应了该区域内发育的左旋走滑断裂,例如,在左旋走滑的海原断裂和东昆仑断裂附近,运动学涡度Wk*~1,体现了左旋简单剪切变形模式,这说明地表断裂的左旋简单变形影响到高原的壳幔变形.青藏高原东北缘的西北部测量的快波方向φ平行于预测的快波方向φps,运动学涡度Wk*~0,体现了纯剪切变形模式.青藏高原东北缘的西北部为祁连造山带,其为双向逆冲断裂系所夹持的挤出体(许志琴等,1999),南北两侧地块均俯冲到祁连山下.祁连造山带受到强烈的NE—SW方向的挤压作用,岩石圈发生了NW—SE方向的伸展变形,从而产生了NW—SE方向观测到的快波方向.这种岩石圈变形模式的变化可能与青藏高原受到印度板块挤压地壳和岩石圈增厚有关(Kosarev et al., 1999).
在阿拉善块体和鄂尔多斯西缘大部分区域测量的NW—SE方向快波方向φ平行于预测的快波方向φps,运动学涡度Wk*~0,与青藏高原东北缘西北部的祁连造山带一样,体现了纯剪切变形模式.印度板块和欧亚大陆板块的陆陆碰撞造就了世界上海拔最高的青藏高原,其碰撞作用影响了从青藏高原、天山造山带,一直到贝加尔裂谷数千公里的区域(Yin et al., 2010).因此,高原受到的NE—SW方向的挤压作用可能跨越了高原东北缘,使与高原相邻的阿拉善块体和鄂尔多斯块体西缘岩石圈主要沿NW—SE方向发生了伸展变形,产生了NW—SE方向观测到的快波方向.在阿拉善块体中部的部分区域测量的NW—SE方向快波方向φ平行于预测的快波方向φrss,运动学涡度Wk*~-1,体现了右旋简单剪切变形模式,表现出与周边不同的变形模式,由于该区为厚沉积层覆盖的沙漠地带,目前对其断裂特征研究不够,有待进一步研究.在阿拉善块体和鄂尔多斯块体西缘测量的NW—SE方向快波方向φ与地表变形场预测的快波方向φc是一致的,也说明其地表变形场和地幔变形场一致,地壳强烈地耦合于岩石圈地幔,符合岩石圈垂直连贯变形特征.
在鄂尔多斯块体南缘,秦岭造山带北部至渭河地堑测量的近E—W方向的快波方向φ平行于预测的快波方向φlss,运动学涡度Wk*~1,体现了左旋简单剪切变形模式,很好地对应了驱动鄂尔多斯块体逆时旋转的左旋走滑断裂(Zhang et al., 1998).该区域与青藏高原东北缘东南部相连,二者的岩石圈壳幔变形模式都表现为左旋简单剪切变形.秦岭造山带南部测量的近E—W方向的快波方向φ平行于预测的快波方向φps,运动学涡度Wk*~0,体现了纯剪切变形模式.秦岭造山带是华北块体与华南块体的碰撞缝合带,受到N—S方向挤压作用,使得从地壳到岩石圈地幔沿E—W方向发生了伸展变形,产生了秦岭造山带南部近E—W方向的快波方向.秦岭造山带测量的近E—W方向的快波方向φ不仅平行于由地表变形场预测的快波方向φc,而且与造山带的构造走向一致,说明其地壳和岩石圈地幔的变形一致,地壳强烈地耦合于岩石圈地幔,符合岩石圈垂直连贯变形特征.但是在秦岭造山带,相对较薄的岩石圈(约110 km)不足以产生较大的横波分裂时间延迟(平均值为1.2 s),岩石圈下的软流圈贡献了部分的各向异性.秦岭造山带快波方向与由HS3-NUVEL1a模型(Gripp and Gordon, 2002)求取相对于热点参考系的绝对板块运动(APM)(图 4)的方向一致,反映了其岩石圈下地幔流对产生较强的各向异性有着重要的作用(Vinnik et al., 1992).P波层析成像显示鄂尔多斯块体和四川块体下方的高速异常超过300 km,在秦岭造山带下100~300 km内是低速的(Huang and Zhao, 2006),这预示了青藏高原物质运移在鄂尔多斯块体和四川盆地这两个刚性块体间的秦岭造山带下可能存在一个软流圈地幔流通道.在秦岭造山带,地幔流被上覆岩石圈板块直接驱动,产生了与上覆岩石圈板块运动方向相同的地幔流,从而使得上地幔中橄榄岩的晶格排列方向平行于近E—W方向流动的地幔流,产生了近E—W方向的快波方向.因此,秦岭造山带的各向异性由上地幔近E—W方向的岩石圈垂直连贯变形和上覆岩石圈板块直接驱动的软流圈地幔流共同导致的.
在鄂尔多斯块体内部,绝大部分测点的φ不能被φc成功地预测(图 6),岩石圈变形模式表现复杂,并且其时间延迟相对于其他构造单元很小,平均值只有0.6 s,表现出弱的各向异性特征,反映了鄂尔多斯块体内部的刚性特性.鄂尔多斯块体位于华北克拉通西部,相对于华北克拉通中东部(中部的燕山—太行造山带和东部的华北裂谷盆地)遭受了强烈的改造,发生了巨厚岩石圈减薄(>100 km),西部的鄂尔多斯块体仍然保留了古老克拉通的性质,结构稳定(Wu et al., 2005; Chen et al., 2006).鄂尔多斯块体内部没有发生过6级以上地震,但它的周缘则地震活动强烈,历史上发生过数次8级以上地震,是中国大陆的一个强震活动带(图 1).由GPS数据模拟得到的应变率场显示鄂尔多斯块体相对于其周缘要低1个数量级(Zhang et al., 2004).这些特征都表明鄂尔多斯块体是一个构造稳定,具有很好的整体性,内部变形很弱的刚性块体.鄂尔多斯块体弱的各向异性可能保留了古老克拉通的“化石”各向异性.鄂尔多斯块体岩石圈变形模式复杂,主要是由于预测地幔各向异性快波方向的地表变形场是基于现今GPS和断裂第四纪滑动速率数据得到的,主要反映了现今的构造变形,而鄂尔多斯块体是一个古老稳定的克拉通,保留了古老的构造变形,用现今的变形去模拟古老的变形不再适合垂直连贯变形模型.
5.3 结论利用南北构造带北段密集分布的817个宽频带地震台站的分裂参数,获得了目前该区域最全面的上地幔各向异性图像.青藏高原东北缘、阿拉善块体和鄂尔多斯块体西缘的快波方向主要表现为NW—SE方向,秦岭造山带的快波方向为近E—W方向,鄂尔多斯块体内部的快波方向在北部为近N—S方向,南部表现为近E—W方向.从时间延迟分布来看,鄂尔多斯块体的时间延迟不仅明显小于其周缘地区,而且小于其他构造单元,特别是在高原东北缘、阿拉善块体和鄂尔多斯块体的交汇地区的时间延迟很大,反映了构造稳定单元的时间延迟小于构造活跃单元.比较快波方向的横波分裂测量值与地表变形场模拟的预测值,二者在青藏高原东北缘、阿拉善块体和鄂尔多斯块体西缘相一致,反映了该区域深浅变形一致,地壳强烈地耦合于地幔,符合岩石圈垂直连贯变形.在青藏高原东北缘的东南部岩石圈变形主要表现为左旋简单剪切变形模式,在高原东北缘的西北部、阿拉善块体和鄂尔多斯块体的西缘岩石圈变形主要表现为纯剪切变形模式.秦岭造山带的各向异性来自于上地幔岩石圈和软流圈的共同作用,其岩石圈近E—W方向的快波方向的测量值和预测值也是一致的,体现了岩石圈垂直连贯变形;其软流圈近E—W方向的快波方向与绝对板块的运动方向相一致,反映了软流圈被上覆岩石圈板块直接驱动产生了近E—W方向的地幔流,进而形成了观测的各向异性.鄂尔多斯块体内部快波方向的测量值和预测值相差较大,不符合垂直连贯变形,考虑其弱的各向异性、厚的岩石圈和构造稳定的特征,我们认为其各向异性可能保留了古老克拉通的“化石”各向异性.
致谢感谢所有参与中国地震科学探测台阵(ChinArray)项目的规划者和实施者为确保获取高质量的地震数据付出的努力.感谢中国地震局地球物理研究所地震科学探测台阵数据中心为本研究提供地震波形数据.
| Alsina D, Snieder R. 1995. Small-scale sublithospheric continental mantle deformation:constraints from SKS splitting observations. Geophys. J. Int. , 123 (2) : 431-448. DOI:10.1111/gji.1995.123.issue-2 | |
| An M J, Shi Y L. 2006. Lithospheric thickness of the Chinese Continent. Phys. Earth Planet. Int. , 159 (3-4) : 257-266. DOI:10.1016/j.pepi.2006.08.002 | |
| Chang L J, Wang C Y, Ding Z F, et al. 2008. Seismic anisotropy of upper mantle in the northeastern margin of the Tibetan Plateau. Chinese J. Geophys. (in Chinese) , 51 (2) : 431-438. | |
| Chang L J, Ding Z F, Wang C Y. 2010. Variations of shear wave splitting in the 2010 Yushu Ms7. 1 earthquake region. Chinese J. Geophys. (in Chinese) , 53 (11) : 2613-2619. DOI:10.3969/j.issn.0001-5733.2010.11.009 | |
| Chang L J, Wang C Y, Ding Z F. 2011. Upper mantle anisotropy in the Ordos block and its margins. Sci. China Earth Sci. , 54 (6) : 888-900. DOI:10.1007/s11430-010-4137-2 | |
| Chang L J, Flesch L M, Wang C Y, et al. 2015. Vertical coherence of deformation in lithosphere in the eastern Himalayan syntaxis using GPS, Quaternary fault slip rates, and shear wave splitting data. Geophys. Res. Lett. , 42 (14) : 5813-5819. DOI:10.1002/2015GL064568 | |
| Chen L, Zheng T Y, Xu W W. 2006. Receiver function migration image of the deep structure in the Bohai Bay Basin, eastern China. Geophys. Res. Lett. , 33 (20) : L20307. DOI:10.1029/2006GL027593 | |
| Dewey J F, Burke K C A. 1973. Tibetan, Variscan, and Precambrian basement reactivation:products of continental collision. J. Geol. , 81 (6) : 683-692. DOI:10.1086/627920 | |
| Ding Z F, Zeng R S. 1996. Observation and study of shear wave anisotropy in Tibetan Plateau. Chinese J. Geophys. (Acta Geophysica Sinica) (in Chinese) , 39 (2) : 211-220. | |
| England P, Houseman G. 1986. Finite strain calculations of continental deformation:2. Comparison with the India-Asia collision zone. J. Geophys. Res. , 91 (B3) : 3664-3676. | |
| Flesch L M, Holt W E, Silver P G, et al. 2005. Constraining the extent of crust-mantle coupling in Central Asia using GPS, geologic, and shear wave splitting data. Earth Planet. Sci. Lett. , 238 (1-2) : 248-268. DOI:10.1016/j.epsl.2005.06.023 | |
| Fossen H, Tikoff B. 1993. The deformation matrix for simultaneous simple shearing, pure shearing and volume change, and its application to transpression-transtension tectonics. J. Struct. Geol. , 15 (3-5) : 413-422. DOI:10.1016/0191-8141(93)90137-Y | |
| Gan W J, Zhang P Z, Shen Z K, et al. 2007. Present-day crustal motion within the Tibetan Plateau inferred from GPS measurements. J. Geophys. Res. , 112 : B08416. DOI:10.1029/2005JB004120 | |
| Gao Y, Teng J W. 2005. Studies on seismic anisotropy in the crust and mantle on Chinese Mainland. Progress in Geophys. (in Chinese) , 20 (1) : 180-185. | |
| Ge X H, Ma W P, Liu J L, et al. 2009. A discussion on the tectonic framework of Chinese mainland. Geology in China (in Chinese) , 36 (5) : 949-965. | |
| Gripp A E, Gordon R G. 2002. Young tracks of hotspots and current plate velocities. Geophys. J. Int. , 150 (2) : 321-361. DOI:10.1046/j.1365-246X.2002.01627.x | |
| Guo G H, Zhang Z, Cheng J W, et al. 2015. Seismic anisotropy in the crust in northeast margin of Tibetan Plateau and tectonic implication. Chinese J. Geophys. (in Chinese) , 58 (11) : 4092-4105. DOI:10.6038/cjg20151117 | |
| Herquel G, Wittlinger G, Guilbert J. 1995. Anisotropy and crustal thickness of Northern-Tibet. New constraints for tectonic modelling. Geophys. Res. Lett. , 22 (14) : 1925-1928. | |
| Huang J L, Zhao D P. 2006. High-resolution mantle tomography of China and surrounding regions. J. Geophys. Res. , 111 : B09305. DOI:10.1029/2005JB004066 | |
| Kaminski E, Ribe N M. 2002. Timescales for the evolution of seismic anisotropy in mantle flow. Geochem. Geophys. Geosyst. , 3 (8) : 1-17. DOI:10.1029/2001GC000222 | |
| Kosarev G, Kind R, Sobolev S V, et al. 1999. Seismic evidence for a detached Indian lithospheric mantle beneath Tibet. Science , 283 (5406) : 1306-1309. DOI:10.1126/science.283.5406.1306 | |
| Lee S P. 1957. The map of seismicity of China. Chinese J. Geophys. (Acta Geophysica Sinica) (in Chinese) , 6 (2) : 127-158. | |
| Li J, Wang X L, Niu F L. 2011. Seismic anisotropy and implications for mantle deformation beneath the NE margin of the Tibet plateau and Ordos plateau. Phys. Earth Planet. Int. , 189 (3-4) : 157-170. DOI:10.1016/j.pepi.2011.08.009 | |
| Li S G. 1959. The east-west trending complex tectonic zone and the north south trending tectonic zone. Collections of Geomechanics (in Chinese) (1) : 5-14. | |
| Li Y H, Wu Q J, Feng Q Q, et al. 2010. Seismic anisotropy beneath Qinghai province revealed by shear wave splitting. Chinese J. Geophys. (in Chinese) , 53 (6) : 1374-1383. DOI:10.3969/j.issn.0001-5733.2010.06.016 | |
| Li Y H, Gao M T, Wu Q J. 2014. Crustal thickness map of the Chinese mainland from teleseismic receiver functions. Tectonophysics , 611 : 51-60. DOI:10.1016/j.tecto.2013.11.019 | |
| Ma H Q, Ding Z F, Chang L J, et al. 2010. Seismic anisotropy of the upper mantle in Ningxia regions. Acta Seismol. Sin. (in Chinese) , 32 (5) : 507-516. | |
| Ma H Q, Ding Z F, Chang L J, et al. 2011. Features about seismic anisotropy of the crustal medium in Ningxia region. Progress in Geophys. (in Chinese) , 26 (1) : 61-70. | |
| Ma X Y. An Outline for Lithosphere Dynamics of China (in Chinese). (in Chinese) Beijing: Geological Publishing House, 1987 . | |
| Mainprice D, Silver P G. 1993. Interpretation of SKS-waves using samples from the subcontinental lithosphere. Phys. Earth Planet. Int. , 78 (3-4) : 257-280. DOI:10.1016/0031-9201(93)90160-B | |
| McKenzie D. 1979. Finite deformation during fluid flow. Geophys. J. Int. , 58 (3) : 689-715. DOI:10.1111/j.1365-246X.1979.tb04803.x | |
| Molnar P, Tapponnier P. 1975. Cenozoic tectonics of Asia, effects of a continental collision. Science , 189 (4201) : 419-426. DOI:10.1126/science.189.4201.419 | |
| Nicolas A, Boudier F, Boullier A M. 1973. Mechanisms of flow in naturally and experimentally deformed peridotites. Am. J. Sci. , 273 (10) : 853-876. DOI:10.2475/ajs.273.10.853 | |
| Ren J S, Jiang C F, Zhang Z K, et al. Geotectonic Evolution of China (in Chinese). (in Chinese) Beijing: Science Press, 1980 : 124 . | |
| Royden L H, Burchfiel B C, King R W, et al. 1997. Surface deformation and lower crustal flow in Eastern Tibet. Science , 276 (5313) : 788-790. DOI:10.1126/science.276.5313.788 | |
| Silver P G, Chan W W. 1991. Shear wave splitting and subcontinental mantle deformation. J. Geophys. Res. , 96 (B10) : 16429-16454. DOI:10.1029/91JB00899 | |
| Silver P G. 1996. Seismic anisotropy beneath the continents:Probing the depths of geology. Annu. Rev. Earth Planet. Sci. , 24 : 385-432. DOI:10.1146/annurev.earth.24.1.385 | |
| Silver P G, Holt W E. 2002. The mantle flow field beneath western North America. Science , 295 (5557) : 1054-1057. DOI:10.1126/science.1066878 | |
| Tapponnier P, Peltzer G, Le Dain A Y, et al. 1982. Propagating extrusion tectonics in Asia:new insights from simple experiments with plasticine. Geology , 10 (12) : 611-616. DOI:10.1130/0091-7613(1982)10<611:PETIAN>2.0.CO;2 | |
| Tian X B, Zhang Z J. 2013. Bulk crustal properties in NE Tibet and their implications for deformation model. Gondwana Res. , 24 (2) : 548-559. DOI:10.1016/j.gr.2012.12.024 | |
| Vinnik L P, Makeyeva L I, Milev A, et al. 1992. Global patterns of azimuthal anisotropy and deformations in the continental mantle. Geophys. J. Int. , 111 (3) : 433-447. DOI:10.1111/gji.1992.111.issue-3 | |
| Wang C Y, Flesch L M, Silver P G, et al. 2008. Evidence for mechanically coupled lithosphere in central Asia and resulting implications. Geology , 36 (5) : 363-366. DOI:10.1130/G24450A.1 | |
| Wang C Y, Sandvol E, Zhu L P, et al. 2014. Lateral variation of crustal structure in the Ordos block and surrounding regions, North China, and its tectonic implications. Earth Planet. Sci. Lett. , 387 : 198-211. DOI:10.1016/j.epsl.2013.11.033 | |
| Wang Q, Gao Y, Shi Y T, et al. 2013. Seismic anisotropy in the uppermost mantle beneath the northeastern margin of Qinghai-Tibet plateau:evidence from shear wave splitting of SKS, PKS and SKKS. Chinese J. Geophys. (in Chinese) , 56 (3) : 892-905. DOI:10.6038/cjg20130318 | |
| Wang Q, Niu F L, Gao Y, et al. 2016. Crustal structure and deformation beneath the NE margin of the Tibetan plateau constrained by teleseismic receiver function data. Geophys. J. Int. , 204 (1) : 167-179. | |
| Wolfe C J, Silver P G. 1998. Seismic anisotropy of oceanic upper mantle:Shear wave splitting methodologies and observations. J. Geophys. Res. , 103 (B1) : 749-771. DOI:10.1029/97JB02023 | |
| Wu C L, Xu T, Badal J, et al. 2015. Seismic anisotropy across the Kunlun fault and their implications for northward transforming lithospheric deformation in northeastern Tibet. Tectonophysics , 659 : 91-101. DOI:10.1016/j.tecto.2015.07.030 | |
| Wu F Y, Lin J Q, Wilde S A, et al. 2005. Nature and significance of the Early Cretaceous giant igneous event in eastern China. Earth Planet Sci. Lett. , 233 (1-2) : 103-119. DOI:10.1016/j.epsl.2005.02.019 | |
| Xu Z Q, Yang J S, Jiang M, et al. 1999. Continental subduction and uplifting of the orogenic belts at the margin of the Qinghai-Tibet plateau. Earth Science Frontiers (Chinese) , 6 (3) : 139-151. | |
| Yin A. 2010. Cenozoic tectonic evolution of Asia:a preliminary synthesis. Tectonophysics , 274 : 41-59. | |
| Zhang H S, Teng J W, Tian X B, et al. 2013. Lithospheric thickness and upper mantle anisotropy beneath the northeastern Tibetan Plateau. Chinese J. Geophys. (in Chinese) , 56 (2) : 459-471. DOI:10.6038/cjg20130210 | |
| Zhang P Z, Shen Z K, Wang M, et al. 2004. Continuous deformation of the Tibetan Plateau from global positioning system data. Geology , 32 (9) : 809-812. DOI:10.1130/G20554.1 | |
| Zhang S Q, Karato S. 1995. Lattice preferred orientation of olivine aggregates deformed in simple shear. Nature , 375 (6534) : 774-777. DOI:10.1038/375774a0 | |
| Zhang Y Q, Mercier J L, Vergély P. 1998. Extension in the graben systems around the Ordos (China), and its contribution to the extrusion tectonics of south China with respect to Gobi-Mongolia. Tectonophysics , 285 (1-2) : 41-75. DOI:10.1016/S0040-1951(97)00170-4 | |
| 常利军, 王椿镛, 丁志峰, 等. 2008. 青藏高原东北缘上地幔各向异 性研究. 地球物理学报 , 51 (2) : 431–438. | |
| 常利军, 丁志峰, 王椿镛. 2010. 2010年玉树7. 1级地震震源区横波分裂的变化特征. 地球物理学报 , 53 (11) : 2613–2619. DOI:10.3969/j.issn.0001-5733.2010.11.009 | |
| 常利军, 王椿镛, 丁志峰. 2011. 鄂尔多斯块体及周缘上地幔各向异性研究. 中国科学D辑 , 41 (5) : 686–699. | |
| 丁志峰, 曾融生. 1996. 青藏高原横波分裂的观测研究. 地球物理学报 , 39 (2) : 211–220. | |
| 高原, 滕吉文. 2005. 中国大陆地壳与上地幔地震各向异性研究. 地球物理学进展 , 20 (1) : 180–185. | |
| 葛肖虹, 马文璞, 刘俊来, 等. 2009. 对中国大陆构造格架的讨论. 中国地质 , 36 (5) : 949–965. | |
| 郭桂红, 张智, 程建武, 等. 2015. 青藏高原东北缘地壳各向异性的构造含义. 地球物理学报 , 58 (11) : 4092–4105. DOI:10.6038/cjg20151117 | |
| 李善邦. 1957. 中国地震区域划分图及其说明Ⅰ. 总的说明. 地球物理学报 , 6 (2) : 127–158. | |
| 李四光. 1959. 东西复杂构造带和南北构造带. 地质力学丛刊 , 1 : 5–14. | |
| 李永华, 吴庆举, 冯强强, 等. 2010. 青海地区S波分裂研究. 地球物理学报 , 53 (6) : 1374–1383. DOI:10.3969/j.issn.0001-5733.2010.06.016 | |
| 马禾青, 丁志峰, 常利军, 等. 2010. 宁夏地区上地幔地震各向异性特征. 地震学报 , 32 (5) : 507–516. | |
| 马禾青, 丁志峰, 常利军, 等. 2011. 宁夏地区地壳介质地震各向异性特征. 地球物理学进展 , 26 (1) : 61–70. | |
| 马杏垣. 中国岩石圈动力学纲要. 北京: 地质出版社, 1987 . | |
| 任纪舜, 姜春发, 张正坤, 等. 中国大地构造及其演化——1:400万中国大地构造图简要说明. 北京: 科学出版社, 1980 : 124 . | |
| 王琼, 高原, 石玉涛, 等. 2013. 青藏高原东北缘上地幔地震各向异性:来自SKS、PKS和SKKS震相分裂的证据. 地球物理学报 , 56 (3) : 892–905. DOI:10.6038/cjg20130318 | |
| 许志琴, 杨经绥, 姜枚, 等. 1999. 大陆俯冲作用及青藏高原周缘造山带的崛起. 地学前缘 , 6 (3) : 139–151. | |
| 张洪双, 滕吉文, 田小波, 等. 2013. 青藏高原东北缘岩石圈厚度与上地幔各向异性. 地球物理学报 , 56 (2) : 459–471. DOI:10.6038/cjg20130210 | |
 2016, Vol. 59

