2. 中国石油大学(北京)非常规天然气研究院, 油气资源与探测国家重点实验室, 北京 102249
2. State Key Laboratory of Petroleum Resource and Prospecting, and Unconventional Natural Gas Institute, China University of Petroleum, Beijing 102249, China
华北克拉通由其东部块体和其西部块体在1.8 Ga前碰撞拼合而成(Zhao et al.,1999).自形成以来,华北克拉通经历了晚石碳世古亚洲洋向南的俯冲、晚三叠纪华南克拉通的碰撞、中生代-新生代太平洋板块的俯冲以及新生代印度板块与欧亚大陆的碰撞等构造事件,这些事件对华北克拉通的构造和演化产生了重要的影响.位于华北克拉通西部的鄂尔多斯块体下方的岩石圈相对稳定,古老的岩石圈根没有遭到破坏; 然而,华北克拉通东部块体下方的岩石圈由于拆沉和热侵蚀的作用遭到破坏(或活化),岩石圈厚度出现了明显的减薄(Menzies et al.,1993;An and Shi,2006; 朱日祥和郑天愉,2009; 朱日祥等,2011,2012).作为华北克拉通东西两个块体之间过渡带的太行山是中国大陆地貌、重力、岩石圈等结构和地球物理场的分界线.该区域岩石圈厚度从西部~200 km迅速减薄至东部~80 km,并呈现出一定的起伏(Chen,2009,2010; Chen et al.,2009).因此,该区域的研究对于华北克拉通东西块体的差异以及华北克拉通破坏成因的探索具有重要的意义.
SKS波分裂是研究上地幔各向异性的重要方法之一,近垂直入射的SKS波在水平方向有较高的分辨率.SKS波分裂主要由上地幔各向异性矿物晶体的优势排列引起,一定程度上反映了上地幔物质的活动和变形.SKS波分裂被广泛地应用于中国大陆上地幔各向异性的研究(罗艳等,2004; 常利军等,2009; Fu et al.,2010; Huang et al.,2011).王椿镛等(2014)收集了中国及邻区共1020个台站的剪切波分裂参数的数据集,在此基础上对中国大陆上地幔各向异性及其可能的动力学机制做了综合的表述:东部各向异性主要来自于软流圈的流动;西部各向异性主要由于岩石圈的形变;中部鄂尔多斯到四川盆地区域的各向异性比较复杂,局部表现出了两层各向异性层和岩石圈内遗留的“化石”各向异性的特点.
华北克拉通东西部上地幔结构存在明显的区别,利用SKS波分裂可以得到上地幔各向异性的分布,再结合地震波速度结构层析成像等结果可以对华北克拉通上地幔构造及华北克拉通破坏的机制有更加全面的理解.之前对于鄂尔多斯块体及其周边的SKS波分裂研究主要利用固定台站记录的数据(常利军等,2011; Li et al.,2011; 胡亚轩等,2011).数据连续,记录时间长,但是台站间距比较大,水平的分辨率比较小.利用密集的流动地震观测台阵对华北克拉通中部过渡带进行SKS波分裂的研究主要位于过渡带的北部和南部(Zhao et al.,2008; Zhao and Xue,2010),中部仍然存在空缺.本文利用SKS波分裂对布设在该区域的宽频带流动地震观测台阵及固定台站进行了分析,得到了华北克拉通中部(包括鄂尔多斯块体东缘、太行山以及华北克拉通东部块体西缘)上地幔各向异性分布,进而对该区域上地幔岩石圈和软流圈的构造和活动进行详细分析.
2 数据资料及方法2.1 资料北京大学分别于2006年8月至2008年3月、2007年1月至2008年3月以及2008年4月至2009年7月在华北克拉通中部布设了三条宽频带流动地震观测台阵,共63个台站(图 1,表 1).本研究还对台阵附近北京大学近期(2012—2014)布设的13个宽频带流动地震观测台站和2009年4月至2010年1月期间6个国家数字测震台网固定台站(郑秀芬等,2009)(图 1,表 2)记录的SKS波进行了分析.本研究利用上述地震观测台站所记录的地震资料,选取震中距在85°~120°范围内、震级大于5.5级的地震事件(图 1),并根据SKS波主要能量所处的频带范围,分别在0.05~0.4 Hz和0.1~0.5 Hz频带范围内对SKS波分裂进行了分析.
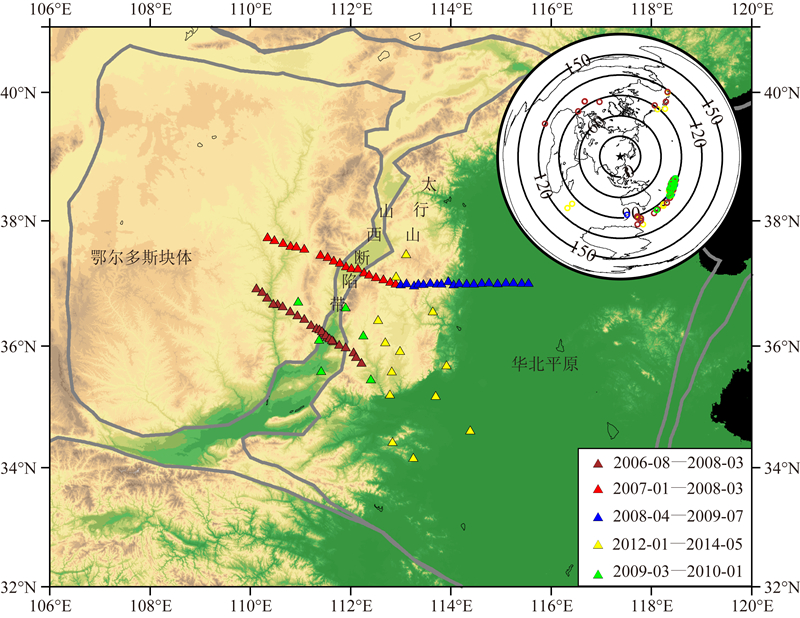 | 图 1 北京大学宽频带流动地震观测台阵分布 三角形表示北京大学宽频带流动地震观测台阵的台站位置,不同颜色分别代表了不同的记录时间区间和台站类型.灰色实线为 中国大陆活动块体边界(张培震等, 2003);右上角为所用到的地震事件分布,事件的颜色与记录台站颜色相对应. Fig. 1 Distribution of the temporary broadband seismic arrays of Peking University The triangles represent the seismic stations of the temporary seismic arrays, and the recording periods and the types of stations are distinguished by different colors. The solid grey lines are the boundaries of active tectonic blocks in China(Zhang et al., 2003). The figure in the top right cornor shows the distribution of used earthquakes and the colors are consistent with those of the recorded stations. |
| | 表 1 北京大学流动观测台阵SKS波分裂结果列表* Table 1SKS wave splitting analysis results of temporary seismic arrays* |
| | 表 2 补充台站信息及SKS波分裂结果* Table 2 Information and SKS wave splitting results of complementary stations* |
剪切波在穿过各向异性介质时会产生偏振方向垂直、速度不同的两个剪切波,即剪切波分裂现象.通常用快波偏振方向和时间延迟来描述剪切波分裂现象.SKS波在穿出核幔边界时由P波转换为SV波,因此初始的偏振方向已知,并且消除了震源部分各向异性介质的干扰,SKS波分裂完全由台站下方的地幔和地壳物质的各向异性产生.一般认为地壳各向异性对SKS波分裂的贡献比较小,SKS波分裂主要来自于地幔各向异性.
本研究计算SKS波分裂参数所利用程序是在SplitLab程序(Wüstefeld et al.,2008)基础上编写,实现了SKS波分裂参数的半自动计算.首先,利用STA/LTA方法(Earle and Shearer,1994)判断是否记录到清晰的SKS波震相.SKS波分裂时间窗长度和位置的选取对于计算结果有一定的影响,对于信噪比比较低的事件影响更加明显.在自动计算SKS波分裂参数时,如果选取了错误的时间窗,可能会丢失掉一部分可信的结果或引入错误的结论.简单地利用计算误差作为时间窗的选取标准并不稳定.Teanby等(2004)提出利用聚类分析法,根据计算结果的误差值和方差选取最优时间窗,但是该方法计算量相对较大.本研究利用改变时间窗的长度和位置,选取SKS波分裂参数变化最小的位置作为最优时间窗.该方法计算结果稳定,计算过程简单.在所选取的时间窗内,利用最小特征值法计算SKS波分裂参数和误差(Silver and Chan,1991).程序只保留校正后快慢波波形互相关系数大于0.8、偏振方向与事件后方位角方向夹角小于45°的结果.由于震相波形的复杂性和噪音干扰,上述自动计算程序所得到的结果并不完全可信.因此,之后还需要根据波形好坏以及质点运动轨迹图对自动计算得到的结果进行人工筛选.各个台站的SKS波分裂参数由该台站记录的SKS波分裂结果根据分裂参数的误差平方的倒数作为权重加权平均得出.图 2和图 3展示了单个SKS波分裂参数的计算结果和HD07台站的汇总结果.
 |
图 2 HD07所记录2008年9月1日4时00分发生的地震事件的SKS波分裂结果 (a) 蓝色虚线和红色实线分别为矫正前和矫正后的质点运动轨迹,横纵坐标分别表示径向和切向; (b) 最小特征值等值线图,横纵坐标分别表示时间延迟和快波偏振方向,两条蓝线的交点为最优解,灰色区域为误差; (c) 蓝色虚线和红色实线分别为矫正后的径向和切向SKS波波形; (d) 蓝色虚线和红色实线分别为矫正后并做振幅归一化的快波和慢波波形. Fig. 2 SKS wave splitting result of the event happened on 2008-09-01 04∶00 recorded by HD07 (a) The blue dashed line and the red solid line are tracks of particle movement before and after the correction, and the lateral axis and vertical axis are radial and transversal direction respectively. (b) Contour map of the minimum eigenvalue. The lateral axis and vertical axis are the delay time and the fast polarization direction respectively. The interaction of the two blue lines is the optimum result and the grey area is the uncertainty zone. (c) The blue dashed line and the red solid line are corrected SKS waveforms in the radial and transversal component respectively. (d) The blue dashed line and the red solid line are corrected and amplitude normalized fast and slow waveform. |
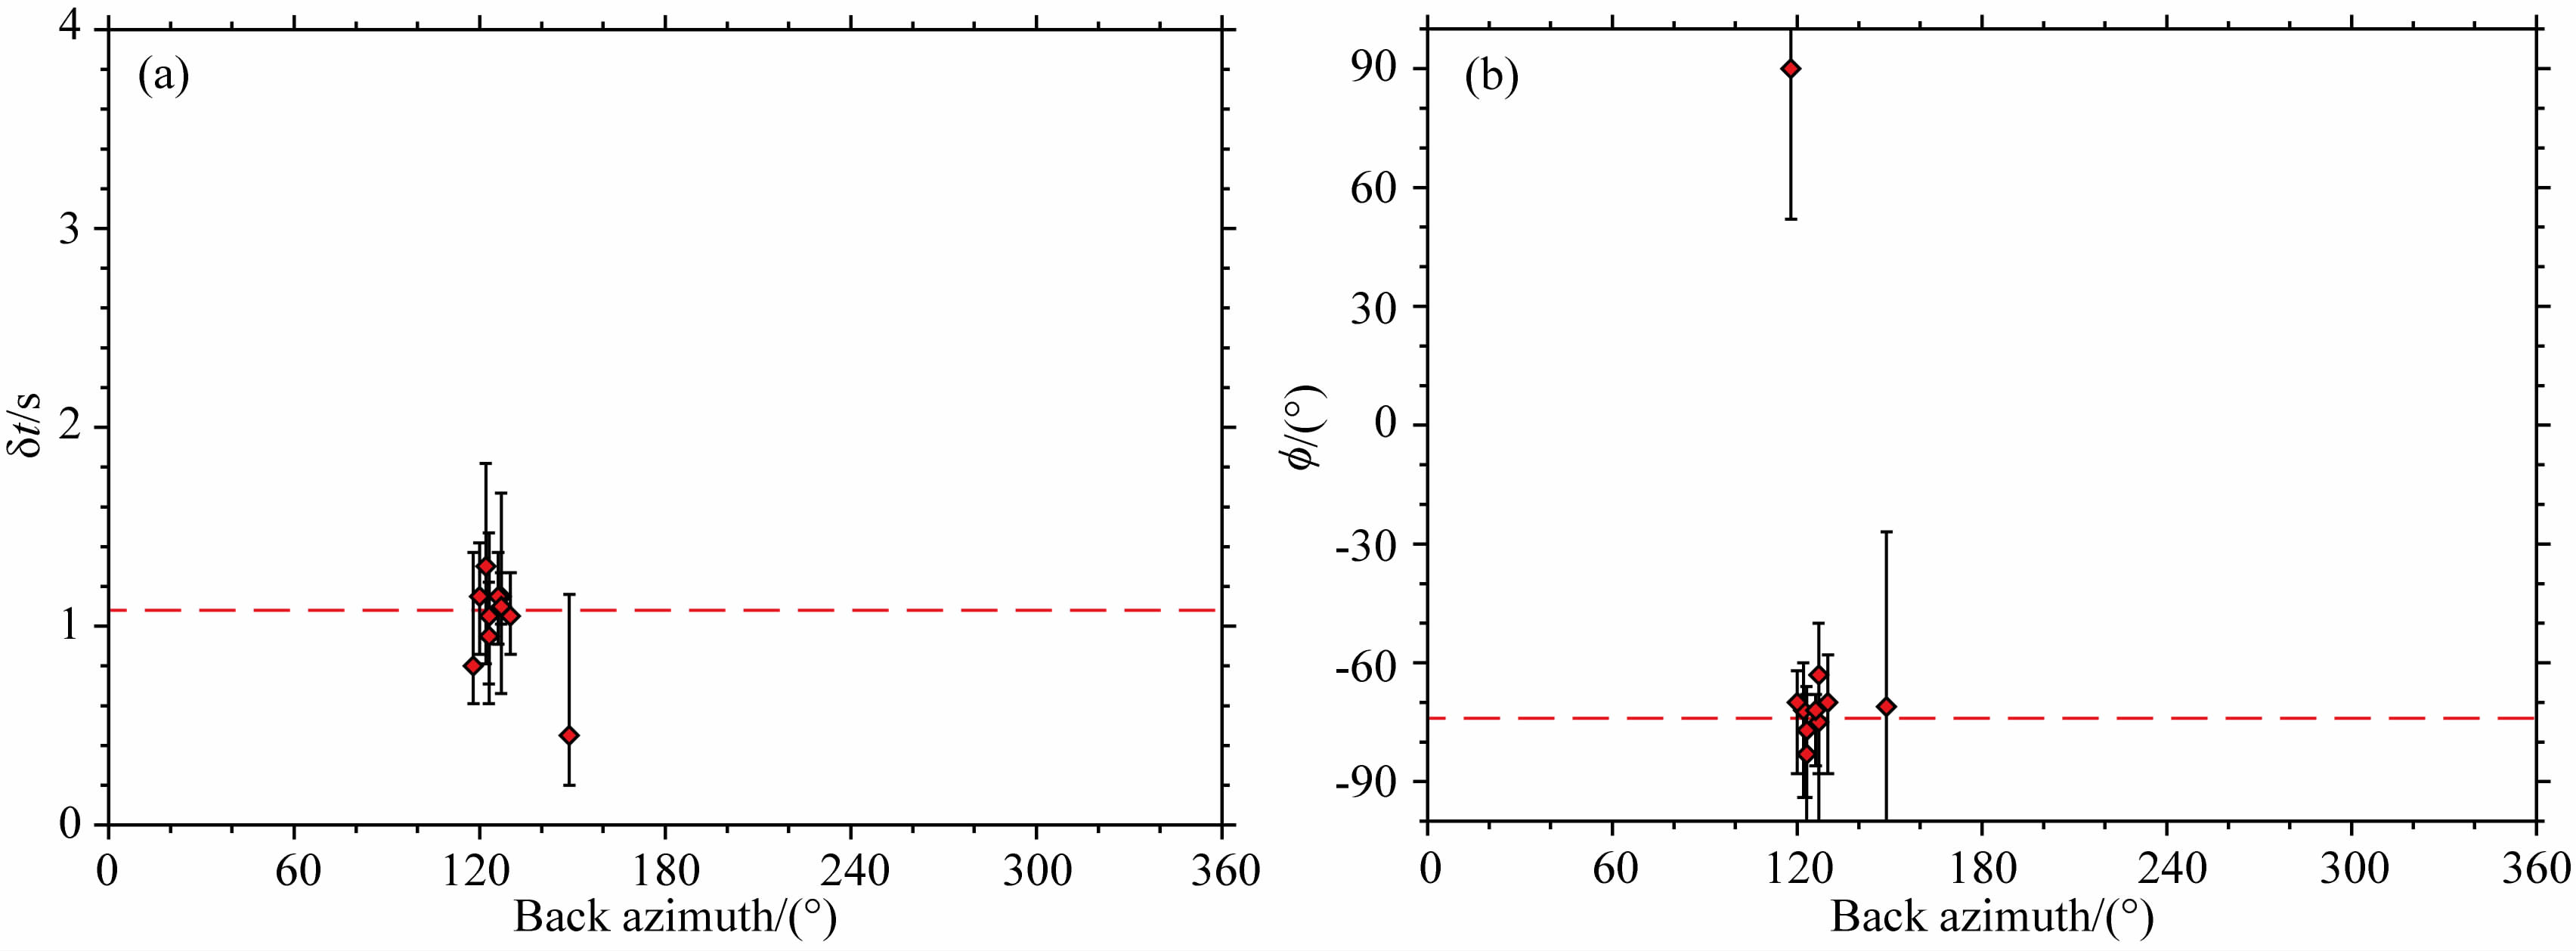 | 图 3 (a) HD07台站SKS波分裂时间延迟以及测量误差随后方位角方向的分布; (b) HD07台站SKS波分裂快波偏振方向以及测量误差随后方位角方向的分布 Fig. 3 (a) Delay times and measurement uncertainties of HD07 versus the back azimuth; (b) Fast polarization directions and measurement uncertainties of HD07 versus the back azimuth |
根据上述方法计算得到所有地震观测台站的SKS波分裂参数,并选取SKS波分裂结果数量大于2的台站(表 1,表 2,图 4).从结果(图 5)可以看出:在山西断陷带以西的鄂尔多斯块体内部,快波偏振方向主要为ESE方向,局部少数台站表现为ENE方向,时间延迟比较小,一般小于0.7 s.山西断陷带部分,南段快波偏振方向仍然为ESE方向,中段快波偏振方向为近E-W方向,时间延迟较鄂尔多斯块体内部的增大到~1.0 s.太行山的时间延迟与山西断陷带的结果相当,但其快波偏振方向主要为ENE方向.在华北平原区域,快波偏振方向主要为近E-W方向或ESE向,时间延迟大于1.2 s.研究区内快波偏振方向大体上都是ESE向,与该区域板块绝对速度(APM)方向(Gripp and Gordon,2002)基本一致,而太行山则主要呈现ENE方向,与APM方向具有一定的角度差.在鄂尔多斯块体、山西断陷带、太行山,南段的时间延迟明显大于中段的.该结果与Zhao和Xue(2010)对于华北克拉通南部以及常利军等(2009)对于华北克拉通东部SKS波分裂的部分结果相一致.
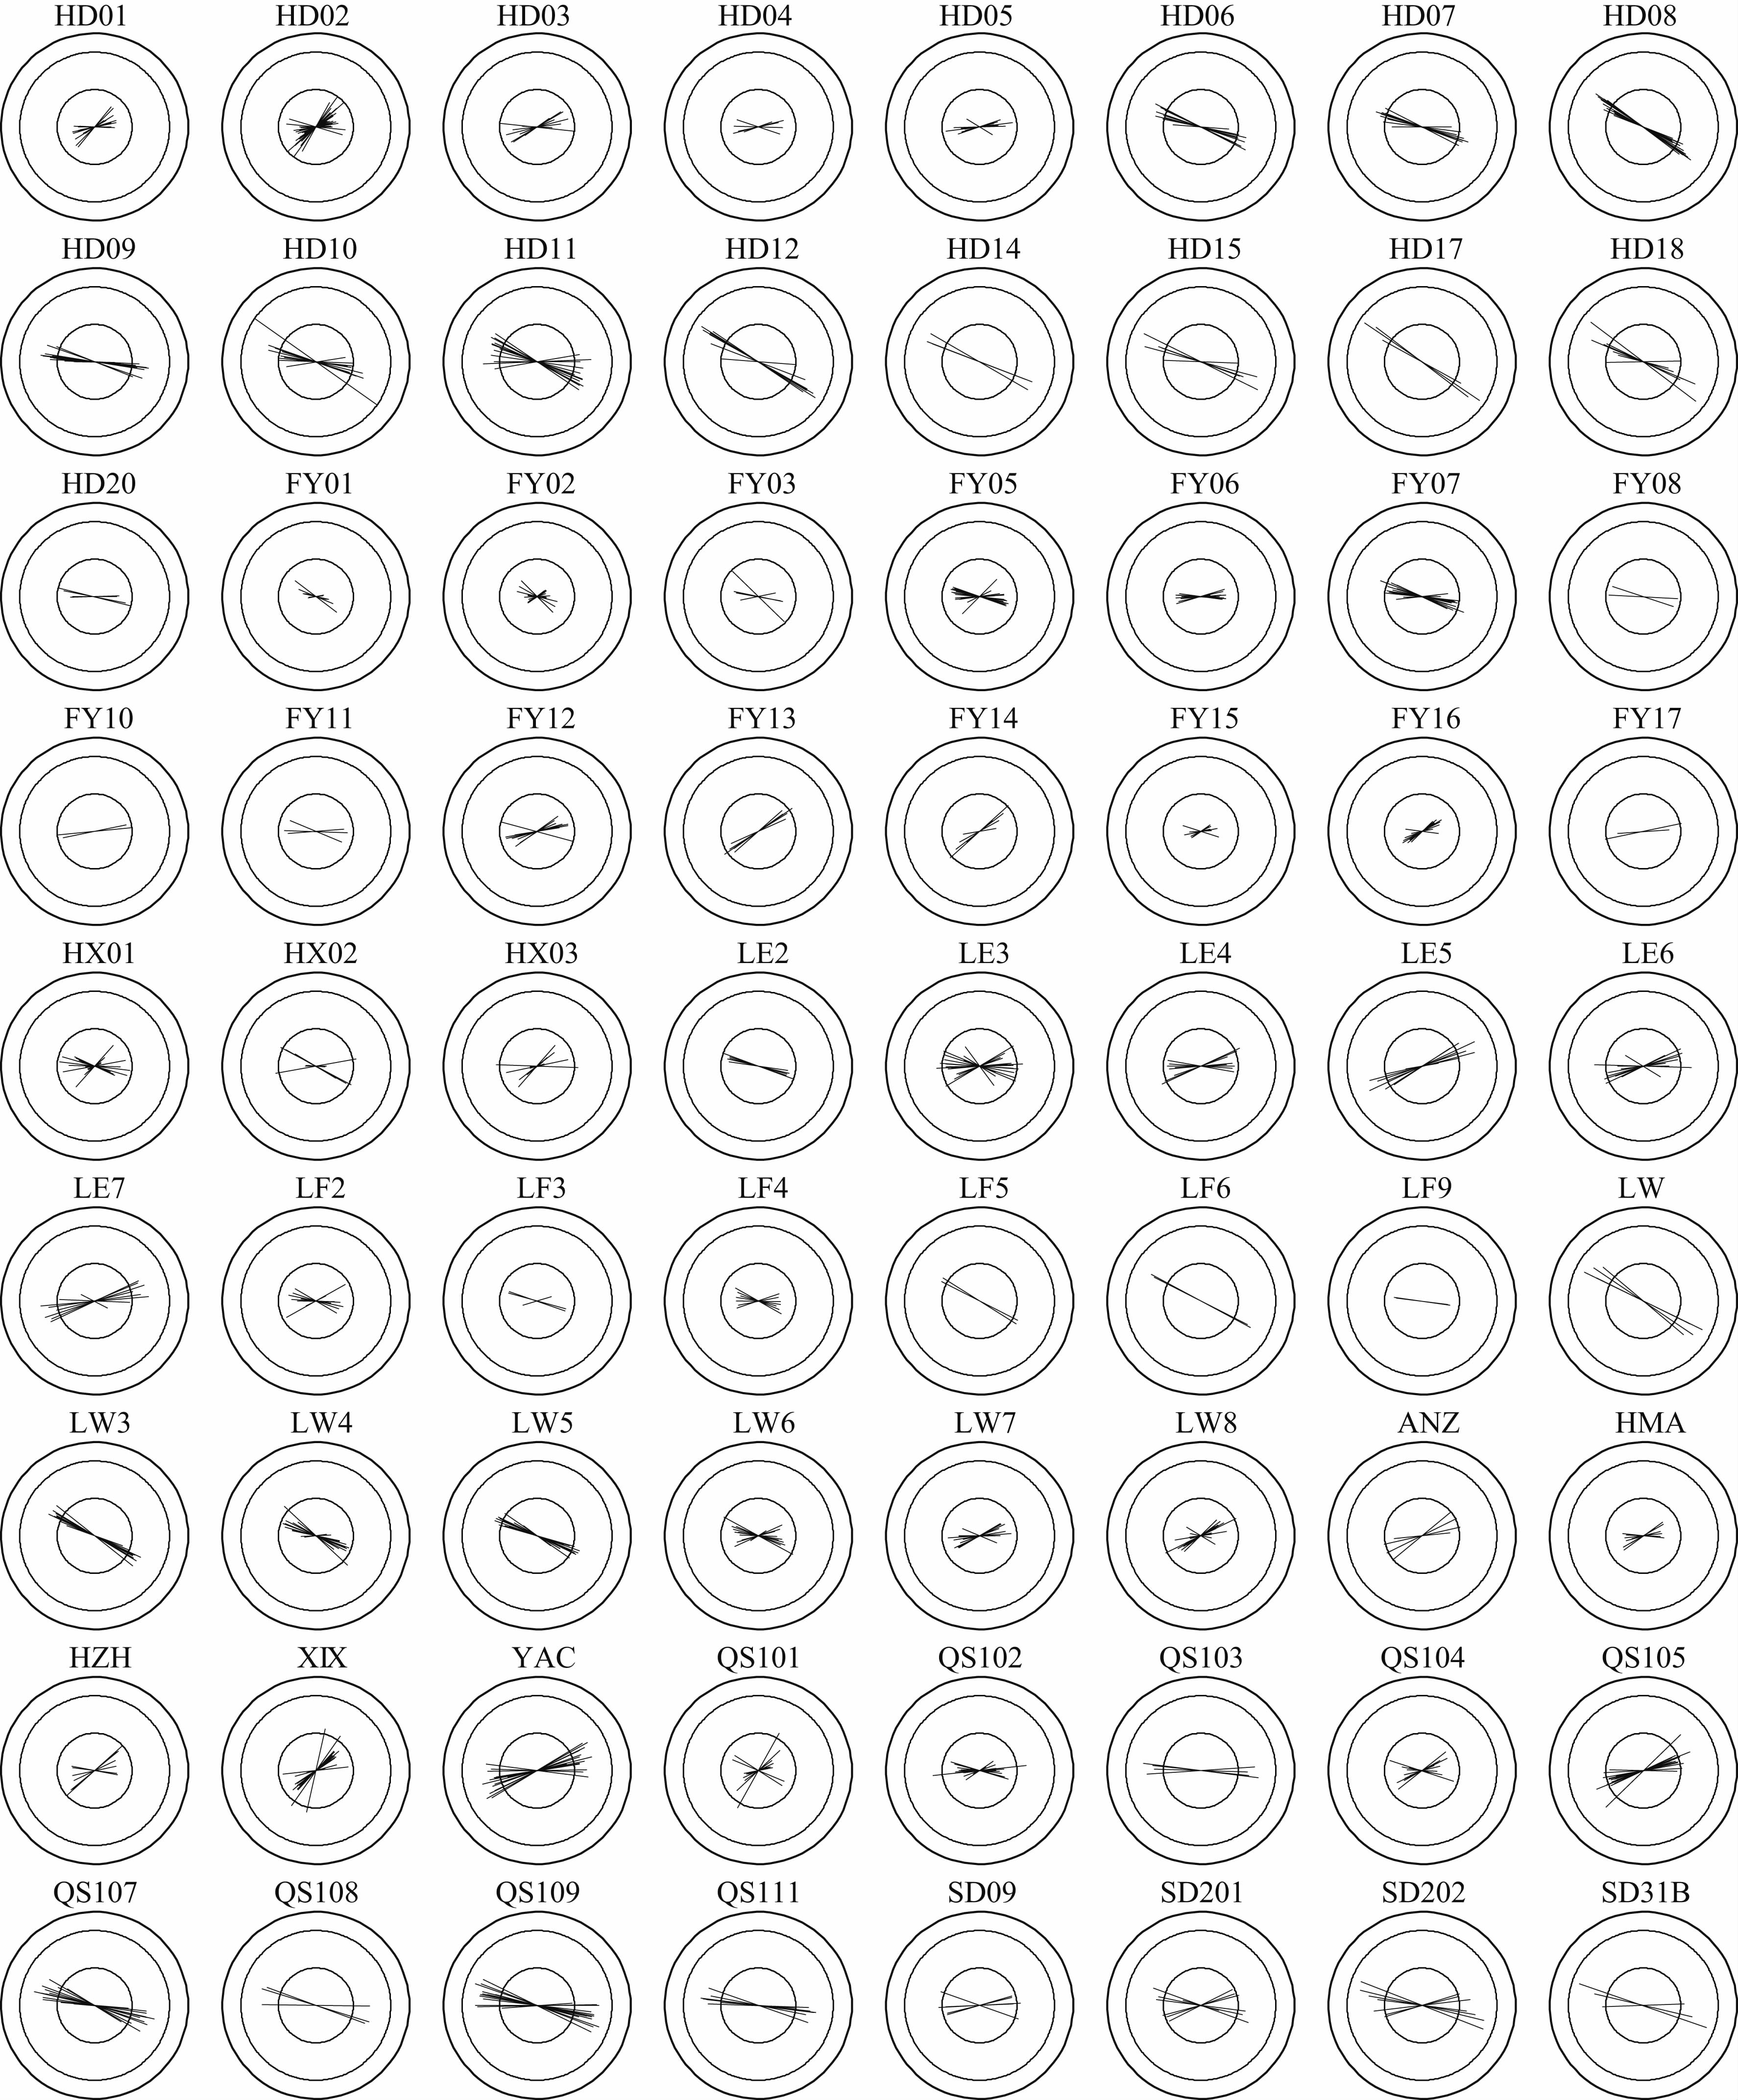 |
图 4 各台站SKS波分裂结果 每条线段表示该台站记录的SKS波分裂结果的快波分裂方向和分裂延迟,内外圈的时间延迟分别为1 s和2 s. Fig. 4 Results of the SKS wave splitting of each station The bars show the SKS wave splitting results of each event recorded by the station, and the circles indicate the delay time as long as 1 s and 2 s respectively. |
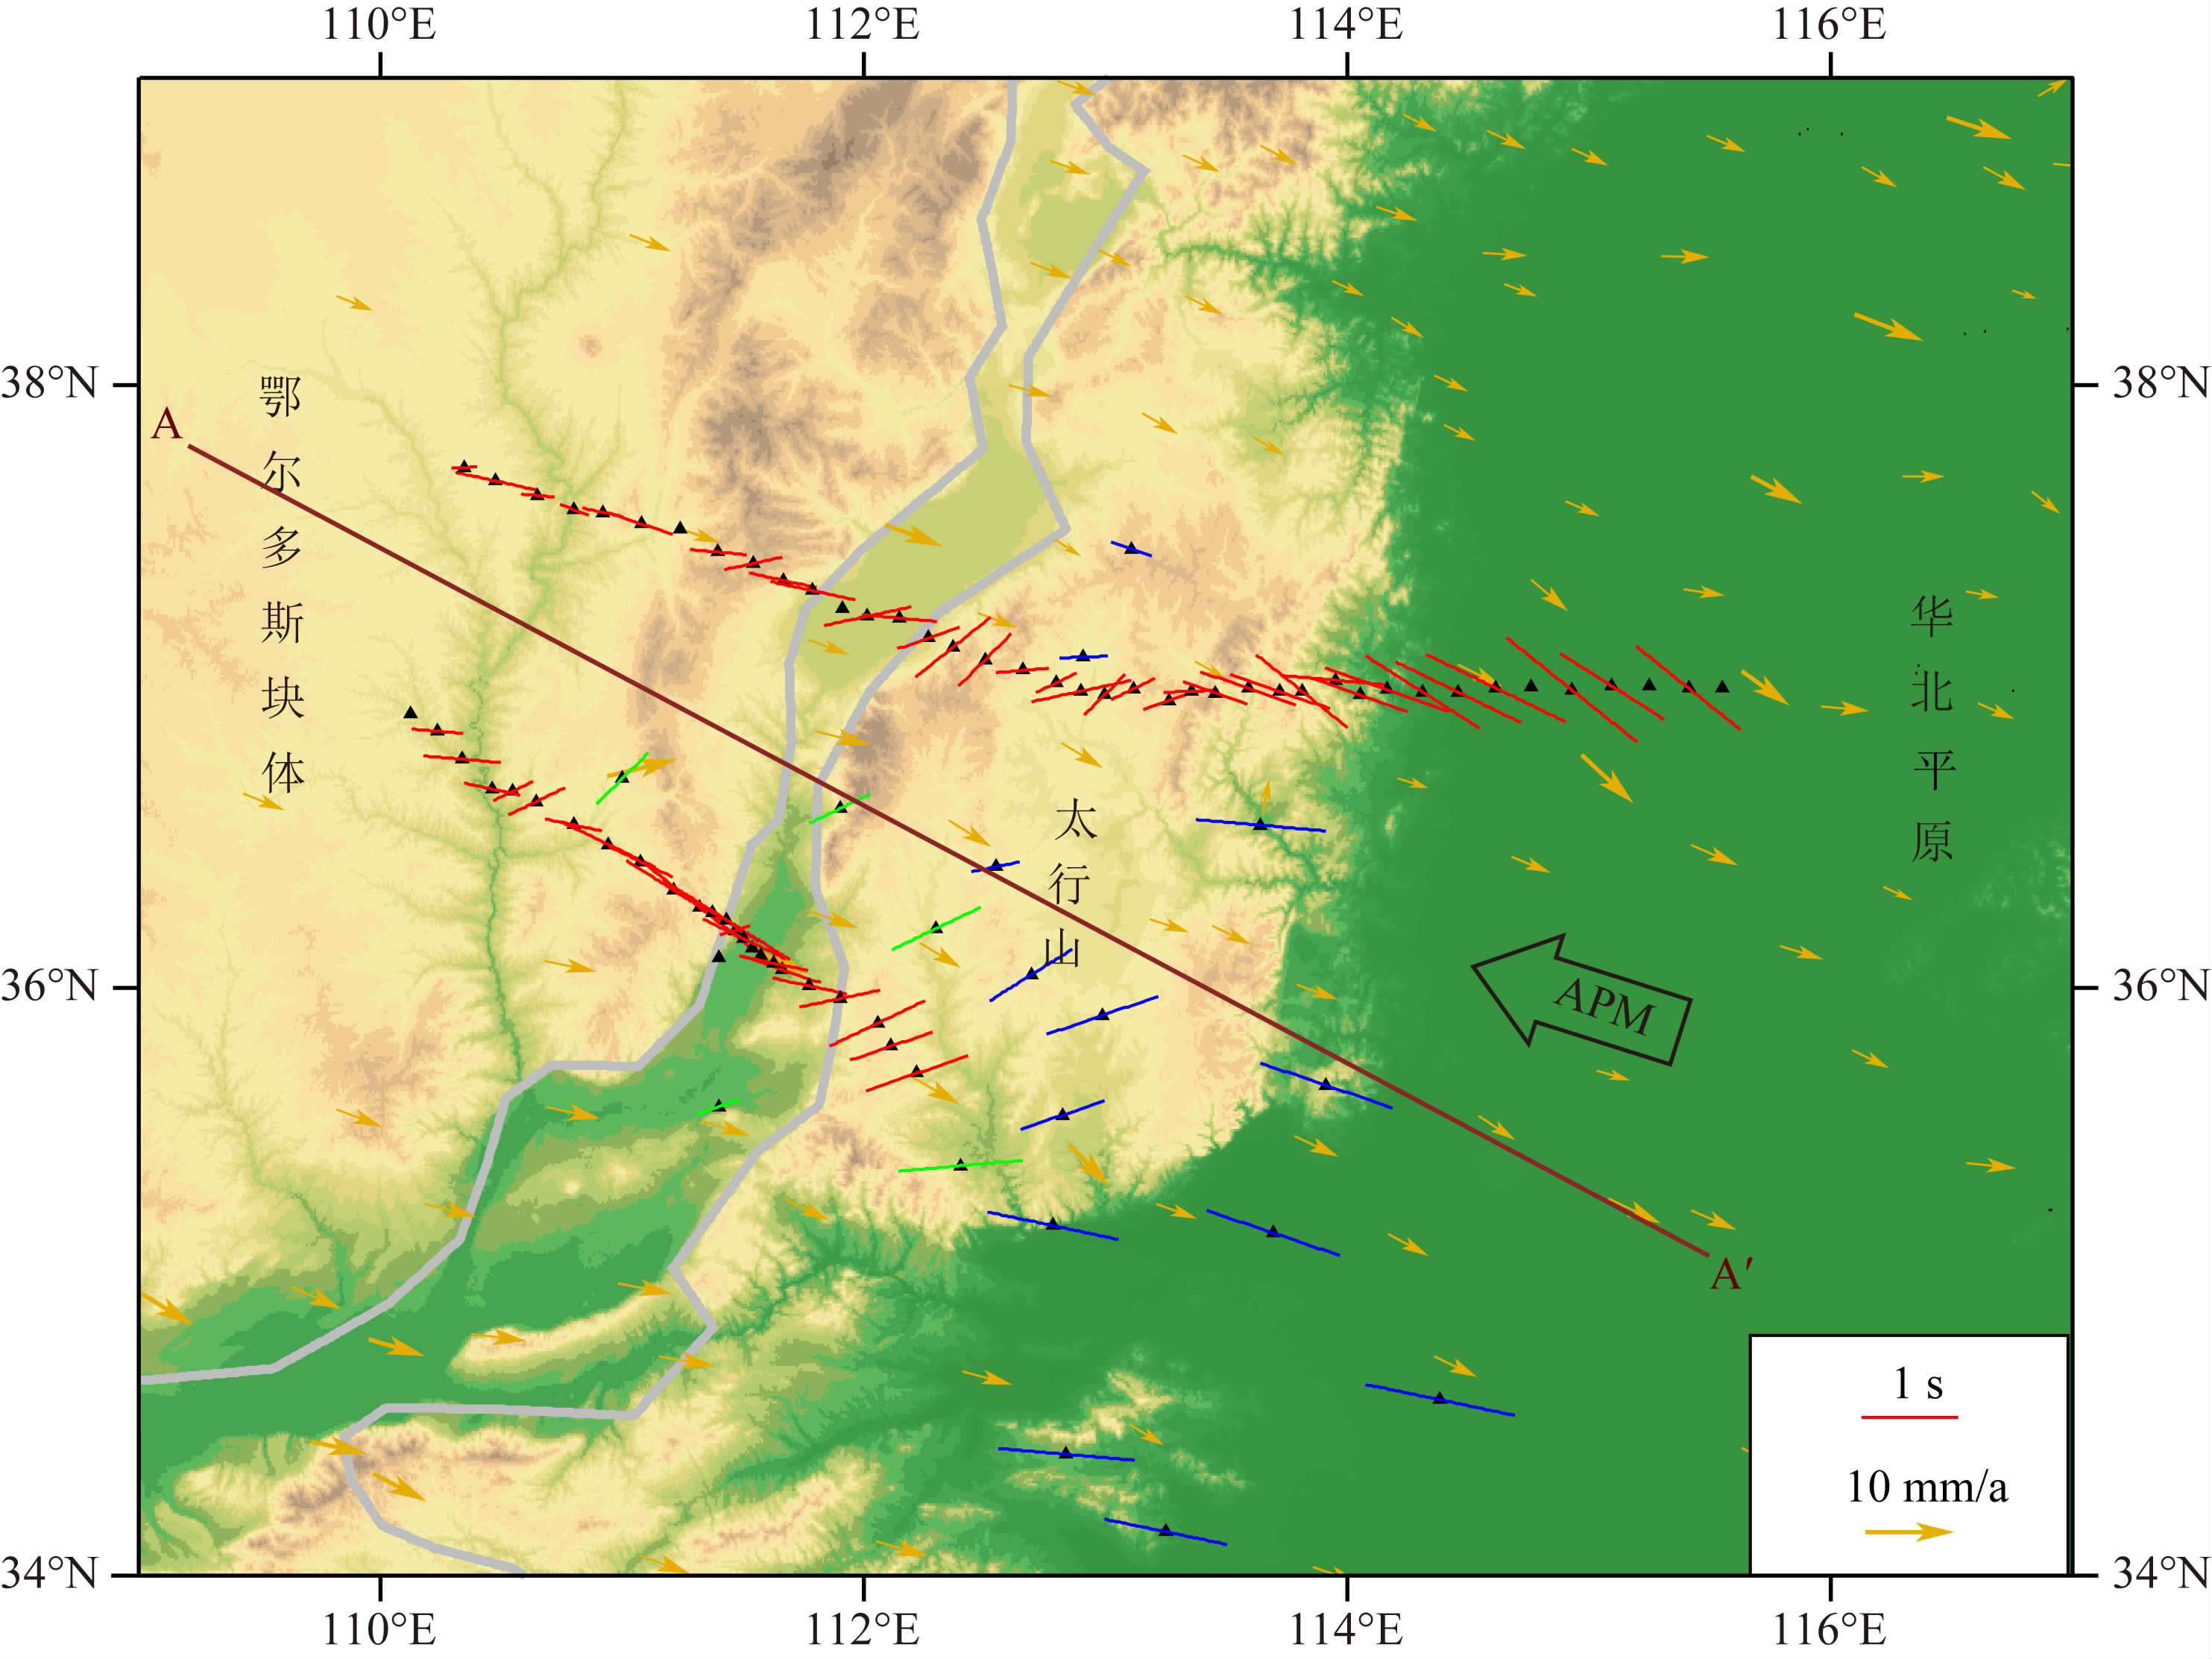 |
图 5 研究区内SKS波分裂结果 线段的长度表示时间延迟的大小,其方向表示快波偏振方向.红色为三条宽频带流动地震观测台阵的SKS波分裂结果;蓝色直线和绿色直线分别代表补充流动观测台站和固定台站的SKS波分裂结果.棕色直线AA′为图 6中展示的S波速度结构剖面位置;黄色箭头表示GPS观测到的地壳运动速度矢量(牛之俊等,2005);大黑色空心剪头表示欧亚板块绝对运动方向(Gripp and Gordon,2002). Fig. 5 Results of SKS wave splitting Delay times and fast polarization directions are expressed by the lengths and the directions of sticks. The red sticks show the SKS splitting results of the temporary seismic arrays.The SKS splitting results of complementary portable stations and permanent stations are represented by blue lines and green lines respectively.The brown line is the location of the profile of S-wave velocity structure. The yellow arrows are GPS velocity vectors(Niu et al.,2005),and the black hollow arrow represents the direction of the absolute plate movement(Gripp and Gordon,2002). |
SKS波分裂研究获得的各向异性主要来自于上地幔橄榄石矿物晶体的优势排列.地壳对SKS波分裂的时间延迟的贡献一般小于0.2 s,当时间延迟大于1.0 s时,可以认为主要反映了上地幔的各向异性(Savage,1999).上地幔各向异性的产生主要有现今上地幔软流圈物质流动和岩石圈物质形变两种解释(Silver,1996),区别在于前者是反映了目前软流圈物质流动产生的各向异性;而后者是地质时期岩石圈构造活动形变的记录,与现代构造活动无关.
4.1 板块运动控制的软流圈物质流动导致SKS波分裂
华北克拉通主要由可以追溯至3.8 Ga前的两个古老块体组成(Zhao et al.,2001):西部的鄂尔多斯块体和东部的华北平原.华北平原内的ESE快波偏振方向与欧亚板块绝对运动方向一致,呈现较大的时间延迟,约为1.2~1.6 s.时间延迟可以表示
为  ,其中,β0为剪切波平均速度,L为SKS波传过各向异性层的厚度,
  为表示各向异性的无量纲参数(Silver and Chan,1991).假设
  =0.04
(Silver and Chan,1991),则1.2~1.6 s的时间延迟对应了140~180 km厚的各向异性层.华北克拉通东部块体的岩石圈由于经历中生代的活化和破坏,其厚度仅~80 km(Menzies et al.,1993; An and Shi,2006; Chen,2009,2010; Chen et al.,2009; 朱日祥和郑天愉,2009; 朱日祥等,2011,2012),并不能够产生观测到的各向异性强度.因此,可以认为华北克拉通东部块体华北平原下方的各向异性主要来自于岩石圈下的软流圈流动,大约在地下80~260 km深度范围内.
华北克拉通西部的鄂尔多斯块体的岩石圈厚度最深可以达到200 km以下(An and Shi,2006; Chen,2009,2010; Chen et al.,2009),在该区域测量得到的时间延迟比较小,快波偏振方向在局部范围内不完全一致.鄂尔多斯块体小于0.7 s的时间延迟对应了各向异性层厚度小于80 km,而且鄂尔多斯块体是构造稳定的克拉通,其表现出来的各向异性也可能是古老克拉通遗留的“化石”各向异性.
4.2 软流圈局部物质流动鄂尔多斯块体和华北克拉通东部块体在大约1.8 Ga前发生碰撞,形成了华北克拉通中部造山带(Zhao et al.,2001).从本文的结果(图 5)可以看出,由华北平原进入太行山区域内的SKS波快波偏振方向发生明显的转动,由ESE方向变为ENE方向.Zhao等(2008)和Zhao和Xue(2010)在太行山北部和南部观测到了相同的SKS波快波偏振方向变化.Zhao等(2011)的解释是,该快波偏振方向的变化主要由于该区域下方存在上涌的地幔物质,并与岩石圈下边界相互作用,进而产生了软流圈流动方向的偏转.我们这里提出另外一种模型,这种SKS波分裂参数的变化与新生代以来青藏高原上地幔物质向东逃逸和鄂尔多斯块体的逆时针旋转有关.
显然简单的受板块运动控制的软流圈流动不能解释在华北克拉通东、西部块体之间的过渡带——太行山区域内快波偏振方向的变化.因此,我们提出软流圈局部流动来解释这种变化,即在太行山下面存在局部的ENE方向的软流圈流动,且太行山南段强于中段,体现在南段的时间延迟较中段大.自新生代早期印度板块和欧亚板块碰撞以来,欧亚板块始终受到印度板块的推挤,近2000 km南北向的地壳缩短造就了青藏高原和北部边缘的造山带,并导致了青藏高原地壳和上地幔物质向东逃逸(Herquel et al.,1995; Yin and Harrison,2000).由于秦岭大别造山带位于鄂尔多斯地块和四川盆地之间,岩石圈相对较薄(An and Shi,2006),可以为青藏高原东北部软流圈向中国大陆东部流动提供通道(Huang et al.,2008; 常利军等,2011; Li et al.,2011).
如果该假说成立的话,从青藏高原东北部向东逃逸的软流圈物质经过秦岭大别造山带后,南北两侧较深的岩石圈根逐渐变浅,软流圈物质在太行山下向有可能沿ENE方向扩散,即可能存在一个围绕鄂尔多斯块体东南角的绕流.另外,由于受到印度板块和欧亚板块近南北向碰撞造成的青藏高原向东北方向的推挤,可能导致了鄂尔多斯块体在新生代以来存在逆时针旋转(李延兴等,2005; Li et al.,2011).鄂尔多斯块体逆时针旋转也促进了其东南角软流圈的绕流.本文得出的SKS波快波偏振方向和时间延迟从太行山南部到中部逐渐减小的观测结果与软流圈物质围绕鄂尔多斯块体东南角的绕流有较好的对应.该模型也可以得到面波成像结果(Tang et al.,2013)的支持.沿近东西向贯穿研究区的地壳和上地幔S-波速度剖面(图 6)显示鄂尔多斯块体巨厚(>200 km)的岩石圈根(蓝色的高速体)在山西断陷带以东迅速减薄至太行山下面的100~120 km,最后减低为华北平原的60~80 km厚.显然,太行山已经不再具备鄂尔多斯块体的克拉通性质了,其100 km以下对应的低速可能对应本文提出的围绕鄂尔多斯块体东南角的软流圈绕流.
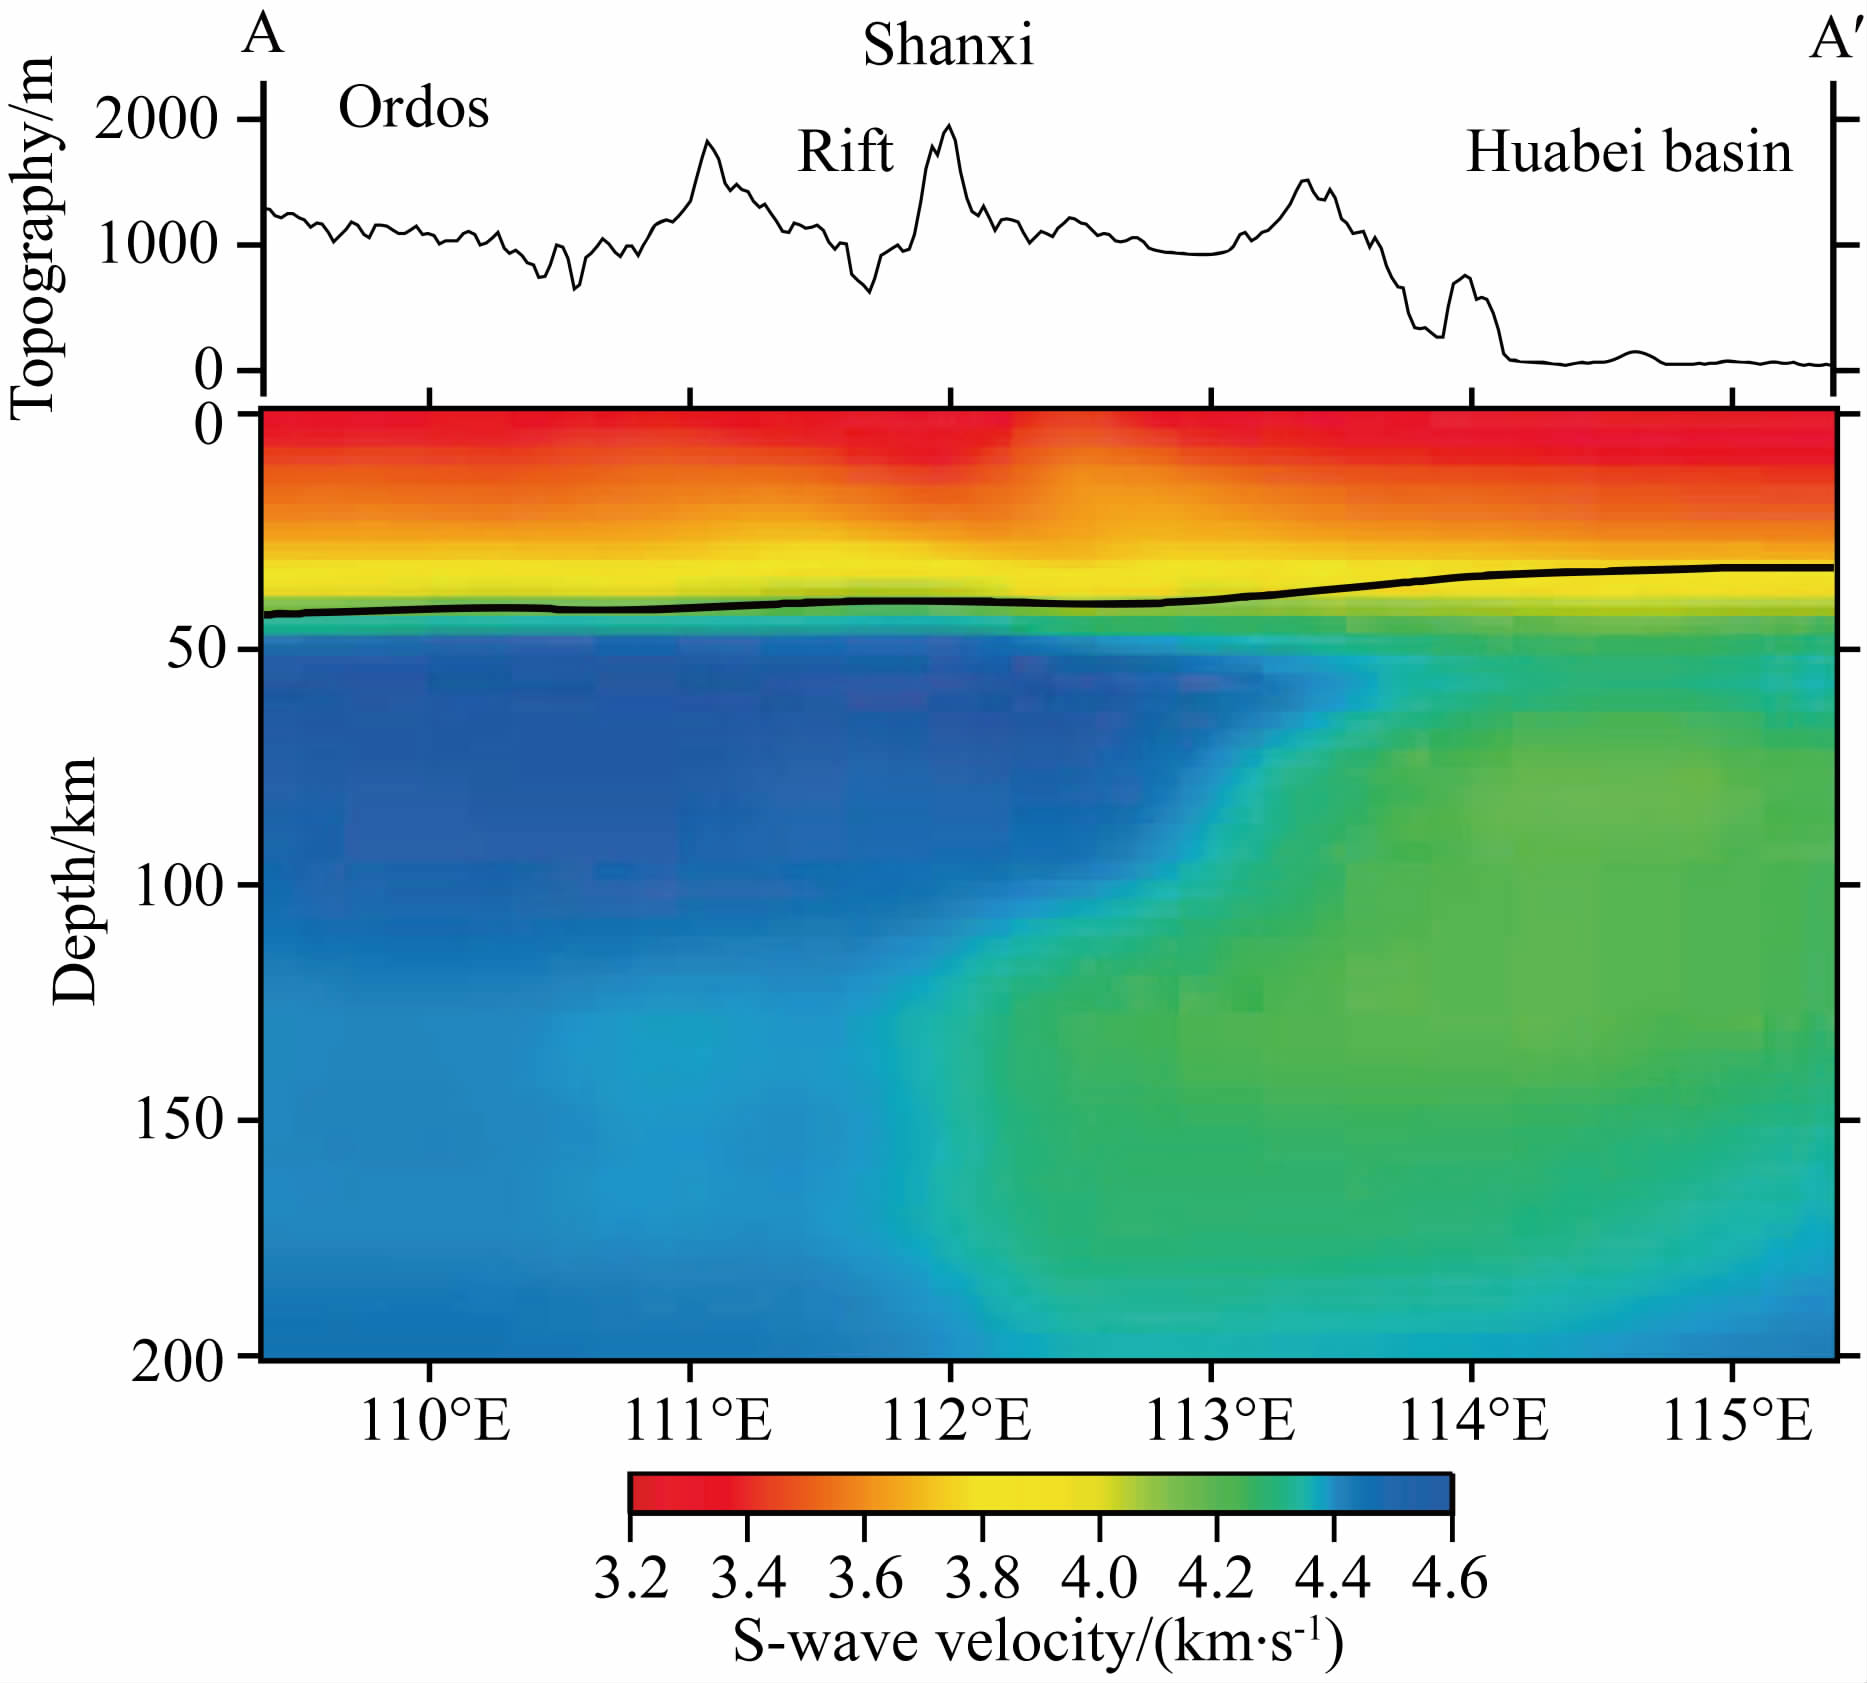 | 图 6 沿近东西向贯穿研究区的地壳和上地幔S-波速度剖面,引自Tang等(2013).剖面位置见图 5. Fig. 6 S-wave velocity profile across the eastern boundary of the Ordos block from Tang et al.(2013). The location of the profile is shown in Fig. 5. |
值得注意的是,在太行山中部东西向较窄的范围内有4个台站的快波偏振方向为近E-W向,并且时间延迟较小,与该区域周围台站的结果存在明显差异,其产生的原因有待进一步研究.
4.3 华北克拉通中部块体边界的深部结构根据本文的SKS波分裂研究结果(图 5),结合面波速度结构图象(图 6),可以得出如下推断.仍然保持华北克拉通性质的鄂尔多斯块体的东边界应位于山西断陷带.从西向东通过该断陷盆地,SKS波快波偏振方向和时间延迟都有显著的变化.快波偏振方向从鄂尔多斯块体的近E-W向或ESE方向沿逆时针方向旋转到在太行山的ENE方向,时间延迟从小于0.5 s增加到太行山的~1.0 s.同时,鄂尔多斯块体的岩石圈根在山西断陷带以东迅速减薄至太行山下面的100~120 km.
太行山与华北平原交界处存在明显的地形高度差.有趣的是,随着地形高度的迅速减低,SKS波分裂参数也呈现了明显变化.快波偏振方向从太行山的ENE方向旋转到在华北平原的ESE方向,时间延迟也从1.0 s左后增加到~1.5 s.岩石圈厚度也从太行山地区的100 km减薄为华北平原的60~80 km厚.SKS波分裂参数和岩石圈厚度在穿过太行山区东西两个边界时都有显著的变化,Yu等(2012)利用虚拟地震反射法和接收函数方法给出的结果似乎表明Moho面深度也有显著变化,尽管许多其他研究论文认为Moho面在这些边界的变化并不明显(嘉世旭和张先康,2005; Li et al.,2006; Pan and Niu,2011).
因此可以认为相对于华北平原,太行山造山带是还没有完全被破坏的华北克拉通的残余块体,是完全被破坏的华北克拉通东部块体和保留完整的华北克拉通西部块体(鄂尔多斯块体)之间的过渡带,也是目前正在经历克拉通破坏的地区(假如造成华北克拉通破坏的过程还在进行).因此,太行山地区应该是研究华北克拉通破坏机制的重要地区,有待今后详细的多学科综合研究.
5 结论本文利用SKS波分裂方法对北京大学布设在华北克拉通中部的宽频带流动地震台阵(76个台站)及6个国家数字测震台网固定台站的远震记录进行了分析.结果显示鄂尔多斯块体内部的各向异性比较弱,剪切波分裂导致的时间延迟一般小于0.7 s;位于鄂尔多斯块体东部边缘的山西断陷带和太行山以及华北平原西部均表现出了比较强的各向异性,时间延迟大于1.0 s,并且南段的各向异性强于中段的.推断华北克拉通东部块体下各向异性主要来自于上地幔软流圈的流动;尤其是太行山观测到的显著的上地幔各向异性及变化可能对应围绕鄂尔多斯块体东南角的局部软流圈绕流,而后者起因于鄂尔多斯块体的逆时针旋转以及青藏高原软流圈沿秦岭大别造山带向东逃逸造成的在太行山下沿ENE方向流动.作为华北克拉通东西块体之间的过渡带,太行山造山带可能是目前正在经历克拉通破坏的地区,将是今后多学科重点研究的区域.
致谢 感谢参加北京大学流动台阵野外工作的全体师生所付出的辛勤劳动.感谢中国地震局地球物理研究所“国家数字测震台网数据备份中心”为本研究提供地震波形数据.| [1] | An M J, Shi Y L. 2006. Lithospheric thickness of the Chinese continent. Physics of the Earth and Planetary Interiors, 159(3-4):257-266. |
| [2] | Chang L J, Wang C Y, Ding Z F. 2009. Seismic anisotropy of upper mantle in eastern China. Sci. China Earth Sci., 52(6):774-783. |
| [3] | Chang L J, Wang C Y, Ding Z F. 2011. Upper mantle anisotropy in the Ordos Block and its margins. Sci. China Earth Sci., 54(6):888-900. |
| [4] | Chen L. 2009. Lithospheric structure variations between the eastern and central North China Craton from S-and P-receiver function migration. Physics of the Earth and Planetary Interiors, 173(3-4):216-227. |
| [5] | Chen L, Cheng C, Wei Z G. 2009. Seismic evidence for significant lateral variations in lithospheric thickness beneath the central and western North China Craton. Earth and Planetary Science Letters, 286(1-2):171-183. |
| [6] | Chen L. 2010. Concordant structural variations from the surface to the base of the upper mantle in the North China Craton and its tectonic implications. Lithos, 120(1-2):96-115. |
| [7] | Earle P S, Shearer P M. 1994. Characterization of global seismograms using an automatic-picking algorithm. Bulletin of the Seismological Society of America, 84(2):366-376. |
| [8] | Fu Y V, Chen Y J, Li A B. 2010. Seismic anisotropy beneath the Chinese mainland. Earthquake Science, 23(6):583-595. |
| [9] | Gripp A E, Gordon R G. 2002. Young tracks of hotspots and current plate velocities. Geophysical Journal International, 150(2):321-361. |
| [10] | Herquel G, Wittlinger G, Guilbert J. 1995. Anisotropy and crustal thickness of northern-Tibet. New constraints for tectonic modelling. Geophysical Research Letters, 22(14):1925-1928. |
| [11] | Hu Y X, Cui D X, Ji L Y, et al. 2011. Seismic anisotropy of upper mantle in Ordos block and adjacent regions. Chinese J. Geophys.(in Chinese), 54(6):1549-1558, doi:10.3969/j.issn.0001-5733.2011.06.014. |
| [12] | Huang Z C, Xu M J, Wang L S, et al. 2008. Shear wave splitting in the southern margin of the Ordos Block, north China. Geophysical Research Letters, 35:L19301, doi:10.1029/2008GL03518. |
| [13] | Huang Z C, Wang L S, Zhao D P, et al. 2011. Seismic anisotropy and mantle dynamics beneath China. Earth and Planetary Science Letters, 306(1-2):105-117. |
| [14] | Jia S X, Zhang X K. 2005. Crustal structure and comparison of different tectonic blocks in North China. Chinese J. Geophys.(in Chinese), 48(3):611-620. |
| [15] | Li J, Wang X J, Niu F L. 2011. Seismic anisotropy and implications for mantle deformation beneath the NE margin of the Tibet plateau and Ordos plateau. Physics of the Earth and Planetary Interiors, 189(3-4):157-170. |
| [16] | Li S L, Mooney W D, Fan J C. 2006. Crustal structure of mainland China from deep seismic sounding data. Tectonophysics, 420(1-2):239-252. |
| [17] | Li Y X, Zhang J H, Guo L Q, et al. 2005. Counterclockwise rotation and geodynamics of Ordos block. Journal of Geodesy and Geodynamics(in Chinese), 25(3):50-56. |
| [18] | Luo Y, Huang Z X, Peng Y J, et al. 2004. A study on SKS wave splitting beneath the China mainland and adjacent regions. Chinese J. Geophys.(in Chinese), 47(5):812-821. |
| [19] | Menzies M A, Fan W M, Zhang M. 1993. Palaeozoic and Cenozoic lithoprobes and the loss of >120 km of Archaean lithosphere, Sino-Korean craton, China. Geological Society, London, Special Publications, 76(1):71-81. |
| [20] | Niu Z J, Wang W, Sun H R, et al. 2005. Contemporary velocity field of crustal movement of Chinese mainland from Global Positioning System measurements. Chinese Science Bulletin, 50(9):939-941. |
| [21] | Pan S Z, Niu F L. 2011. Large contrasts in crustal structure and composition between the Ordos plateau and the NE Tibetan plateau from receiver function analysis. Earth and Planetary Science Letters, 303(3-4):291-298. |
| [22] | Savage M K. 1999. Seismic anisotropy and mantle deformation:What have we learned from shear wave splitting?. Reviews of Geophysics, 37(1):65-106. |
| [23] | Silver P G, Chan W W. 1991. Shear-wave splitting and subcontinental mantle deformation. Journal of Geophysical Research-Solid Earth, 96(B10):16429-16454. |
| [24] | Silver P G. 1996. Seismic anisotropy beneath the continents:Probing the depths of geology. Annual Review of Earth and Planetary Sciences, 24:385-432. |
| [25] | Tang Y C, Chen Y J, Zhou S Y, et al. 2013. Lithosphere structure and thickness beneath the North China Craton from joint inversion of ambient noise and surface wave tomography. Journal of Geophysical Research-Solid Earth, 118(5):2333-2346. |
| [26] | Teanby N A, Kendall J M, Van der Baan M. 2004. Automation of shear-wave splitting measurements using cluster analysis. Bulletin of the Seismological Society of America, 94(2):453-463. |
| [27] | Wang C Y, Chang L J, Ding Z F, et al. 2014. Upper mantle anisotropy and crust-mantle deformation pattern beneath the Chinese mainland. Sci. China Earth Sci., 57(1):132-143. |
| [28] | Wüstefeld A, Bokelmann G, Zaroli C, et al. 2008. SplitLab:A shear-wave splitting environment in Matlab. Computers & Geosciences, 34(5):515-528. |
| [29] | Yin A, Harrison T W. 2000. Geologic evolution of the Himalayan-Tibetan orogen. Annual Review of Earth and Planetary Sciences, 28:211-280. |
| [30] | Yu C Q, Chen W P, Ning J Y, et al. 2012. Thick crust beneath the Ordos plateau:Implications for instability of the North China craton. Earth and Planetary Science Letters, 357-358:366-375. |
| [31] | Zhang P Z, Deng Q D, Zhang G M, et al. 2003. Active tectonic blocks and strong earthquakes in the continent of China. ,Sci. China Ser. D-Earth Sci. 46(2):13-24. |
| [32] | Zhao G C, Wilde S A, Cawood P A, et al. 1999. Thermal evolution of two textural types of mafic granulites in the North China craton:evidence for both mantle plume and collisional tectonics. Geological Magazine, 136(3):223-240. |
| [33] | Zhao G C, Wilde S A, Cawood P A, et al. 2001. Archean blocks and their boundaries in the North China Craton:lithological, geochemical, structural and P-T path constraints and tectonic evolution. Precambrian Research, 107(1-2):45-73. |
| [34] | Zhao L, Zheng T Y, Lü G. 2008. Insight into craton evolution:Constraints from shear wave splitting in the North China Craton. Physics of the Earth and Planetary Interiors, 168(3-4):153-162. |
| [35] | Zhao L, Xue M. 2010. Mantle flow pattern and geodynamic cause of the North China Craton reactivation:Evidence from seismic anisotropy. Geochem. Geophys. Geosyst., 11:Q07010, doi:10.1029/2010GC003068. |
| [36] | Zhao L, Zheng T Y, Lu G, et al. 2011. No direct correlation of mantle flow beneath the North China Craton to the India-Eurasia collision:constraints from new SKS wave splitting measurements. Geophysical Journal International, 187(2):1027-1037. |
| [37] | Zheng X F, Ouyang B, Zhang D N, et al. 2009. Technical system construction of Data Backup Centre for China Seismograph Network and the data support to researches on the Wenchuan earthquake. Chinese J. Geophys.(in Chinese), 52(5):1412-1417, doi:10.3969/j.issn.0001-5733.2009.05.031. |
| [38] | Zhu R X, Zheng T Y. 2009. Destruction geodynamics of the North China Craton and its Paleoproterozoic plate tectonics. Chinese Sci. Bull., 54(19):3354-3366, doi:10.1007/s11434-009-0451-5. |
| [39] | Zhu R X, Chen L, Wu F Y, et al. 2011. Timing, scale and mechanism of the destruction of the North China Craton. Sci. China Earth Sci., 54(6):789-797, doi:10.1007/s11430-011-4203-4. |
| [40] | Zhu R X, Xu Y G, Zhu G, et al. 2012. Destruction of the North China Craton. Sci. China Earth Sci., 55(10):1565, 1587, doi:10.1007/s11430-012-4516-y. |
| [41] | 常利军, 王椿镛, 丁志锋. 2009. 中国东部上地幔各向异性研究. 中国科学D辑:地球科学, 39(9):1169-1178. |
| [42] | 常利军, 王椿镛, 丁志峰. 2011. 鄂尔多斯块体及周缘上地幔各向异性研究. 中国科学:地球科学, 41(5):686-699. |
| [43] | 胡亚轩, 崔笃信, 季灵运等. 2011. 鄂尔多斯块体及其周缘上地幔各向异性分析研究. 地球物理学报, 54(6):1549-1558, doi:10.3969/j.issn.0001-5733.2011.06.014. |
| [44] | 嘉世旭, 张先康. 2005. 华北不同构造块体地壳结构及其对比研究. 地球物理学报, 48(3):611-620. |
| [45] | 李延兴, 张静华, 郭良迁等. 2005. 鄂尔多斯的逆时针旋转与动力学. 大地测量与地球动力学, 25(3):50-56. |
| [46] | 罗艳, 黄忠贤, 彭艳菊等. 2004. 中国大陆及邻区SKS波分裂研究. 地球物理学报, 47(5):812-821. |
| [47] | 牛之俊, 王敏, 孙汉荣等. 2005. 中国大陆现今地壳运动速度场的最新观测结果. 科学通报, 50(8):839-840. |
| [48] | 王椿镛, 常利军, 丁志峰等. 2014. 中国大陆上地幔各向异性和壳幔变形模式. 中国科学:地球科学, 44(1):98-110. |
| [49] | 张培震, 邓起东, 张国民等. 2003. 中国大陆的强震活动与活动地块. 中国科学(D辑), 33(S1):12-20. |
| [50] | 郑秀芬, 欧阳飚, 张东宁等. 2009. "国家数字测震台网数据备份中心"技术系统建设及其对汶川大地震研究的数据支撑. 地球物理学报, 52(5):1412-1417, doi:10.3969/j.issn.0001-5733.2009.05.031. |
| [51] | 朱日祥, 郑天愉. 2009. 华北克拉通破坏机制与古元古代板块构造体系. 科学通报, 54(14):1950-1961. |
| [52] | 朱日祥, 陈凌, 吴福元等. 2011. 华北克拉通破坏的时间、范围与机制. 中国科学:地球科学, 41(5):583-592. |
| [53] | 朱日祥, 徐义刚, 朱光等. 2012. 华北克拉通破坏. 中国科学:地球科学, 42(8):1135-1159. |
 2016, Vol. 59


