 2015, Vol. 58


2. 国家海洋局第二海洋研究所, 杭州 310012;
3. 国家海洋局海底科学重点实验室, 杭州 310012;
4. 中国石化石油物探技术研究院, 南京 211103
2. Second Institute of Oceanography, State Oceanic Administration, Hangzhou 310012, China;
3. Key Laboratory of Submarine Geoscience, State Oceanic Administration, Hangzhou 310012, China;
4. Sinopec Geophysical Research Institute, Nanjing 211103, China
Edge detection is required for interpretation of potential field data, and has been used in exploration technology for discovery of mineral resources. The main geological edges are fault lines and the borders of geological or rock bodies of different density, magnetic nature, etc. On account of the higher-frequency signals, their interpretation enables high-resolution and detailed investigation of geological structures. Development of new methods is required to enable interpretation of these data, especially for edge detection for small geological structures.
In order to make use of multiple component information, we define directional total horizontal derivatives and enhanced directional total horizontal derivatives and use them to define new edge detectors. However, the new defined edge detectors can balance the detected edge signals of different amplitude anomalies. In order to balance the edge signal amplitude, we present a normalization method, where we divide the new edge detectors by the vertical potential field gradient data. Besides, we introduce a constant parameter in the denominator of the normalization method, which can effectively avoid bringing some additional false edges when real geological bodies contain positive and negative anomalies simultaneously.
These methods have been tested with synthetic data to verify that the new methods can delineate the edges of different amplitude anomalies clearly. The results show that new defined directional total horizontal derivatives and enhanced directional total horizontal derivatives have higher resolution than directional analytic signal. The normalized edge detectors can display the edges of large and small amplitude anomalies simultaneously, and avoid introducing additional false edges. To further test the stability, we demonstrate the new edge detectors with the model data corrupted with 5% Gaussian noise. Finally, we apply these methods to real full gravity gradient tensor data in St. Georges Bay, Canada and magnetic anomalies in Zhurihe area, China, and get good edge results.
边界检测是位场数据解释中的重要组成部分.目前,有许多方法用于边界检测和边界加强.水平导数和垂向导数经常用于加强这些潜在特征.垂向导数通常被用于描述密度体或磁性体的边界(Evjen,1936).后来人们发现总水平导数和解析信号振幅的最大值直接描述密度和磁化强度边界的检测(Cordell and Grauch,1985; Cordell,1979; Nabighian,1984). Hsu等(1996)提出加强解析信号方法进行到高阶导数以增加该方法的求解能力.Cooper和Cowan(2004)使用不同阶的垂向导数进行增强地球物理异常的细节.
Miller和Singh(1994)使用垂向导数与总水平导数的比来进行边界检测.它是第一个均衡滤波器,能均衡不同振幅强度的异常信息.Rajagopalan和Milligan(1995)使用自动增益控制技术均衡不同大小的振幅.然而,这种方法与窗口大小的选择相关. Verduzco等(2004)用倾斜角的总水平导数(THDR)来进行边界检测.Wijns等(2005)提出了Theta图滤波器进行边界探测,它是用解析信号振幅来对总水平导数进行归一化处理.这些均衡边界探测器虽然能同时显示不同振幅大小的异常的边界信息,但识别出来的边界分辨率较低.马国庆等(2012)利用高阶导数来定义均衡滤波器,提高了对地质体边界的分辨率.但是,当测量的数据中同时包含正负异常体的情况下,这些均衡探测器可能会引入错误的边界信息.
近十几年,位场梯度张量数据被广泛使用.位场梯度张量数据可以通过测量或者数值计算得到,它提供了9个张量成分,包含了比传统位场数据更高频的信号成分,因此,对于梯度张量数据的 解释能得到更高分辨率和更加详细的地质构造.这要求新的 方法来解释梯度张量数据,尤其是对小地质构造的边界检测.Cooper和Cowan(2006)以及Oru和Keskinsezer(2008)提出了方向倾斜角来探测边界,但是只有垂直方向的倾斜角,即传统的倾斜角方法,能得到较好的检测结果.Beiki(2010)和Mikhailov等(2007)定义了方向解析信号来处理重力梯度张量数据.Beiki(2010)利用方向解析信号进行边界检测,比传统的解析信号方法能得到更好的结果,但是该方法也不能同时描述大振幅和小振幅异常体.近年来,一些学者利用重力梯度张量数据的特征值来进行边界识别(Oru et al.,2013; Sertcelik and Kafadar,2012; Zhou et al.,2013).
Marson和Klingele(1993)指出总水平导数比解析信号有更高的分辨率.因此,本文定义了方向总水平导数和加强方向总水平导数,并根据其定义不同的边界探测器.为了同时显示不同振幅大小异常的边界,给出了归一化方法.
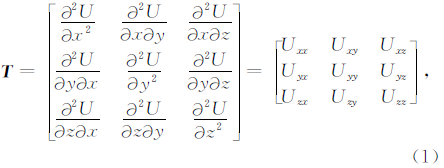
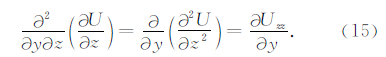
2 方向总水平导数位场梯度张量数据为位场U在空间上的二阶偏导数,张量矩阵的形式:


这里,我们在x,y和z方向上定义方向总水平导数,其表达式分别为


图 1比较分析了方向解析信号振幅和方向总水平导数的边界识别能力.图 1a为一垂直棱柱体产生的重力异常.图 1b—1d为x,y和z方向上的方向解析信号振幅;图 1e—1g为x,y和z方向上的方向总水平导数.通过比较可知,方向总水平导数相对于方向解析信号振幅对于边界识别有着更高的分辨率.因此,根据水平方向的总水平导数来定义边界探测器有着更高的分辨率.利用THDx和THDy定义地质体边界探测器:

Hsu等(1996)应用高阶导数定义加强解析信号振幅来提高边界的分辨率.为了提高边界检测的分辨率,我们使用高阶导数来定义方向总水平导数,叫做加强方向总水平导数.
x,y和z方向上的加强方向总水平导数分别为

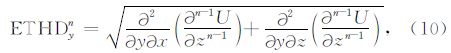
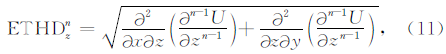
其中,下标x,y和z表示方向.上标n表示阶数,大于等于1.当n=1时,与方向总水平导数相同.
同样,加强方向总水平导数ETHDx的最大值描绘地质体的N-S向边界;ETHDy的最大值描绘地质体的E-W向边界.因此,我们可以根据加强方向总水平导数来定义地质体边界探测器:


 |
图 1 比较方向总水平导数和方向解析信号振幅 (a)合成重力异常;(b)方向解析信号Ax;(c)方向解析信号Ay;(d)方向解析信号Az;(e)方向总水平导数THDx;(f)方向总水平导数THDy;(g)方向总水平导数THDz;(h)加强方向总水平导数ETHDx;(i)加强方向总水平导数ETHDy;(j)加强方向总水平导数ETHDz. Fig. 1 Comparing the directional total horizontal derivatives and directional analytic signals (a)Synthetic gravity anomaly;(b)Directional analytic signal Ax;(c)Directional analytic signal Ay;(d)Directional analytic signal Az;(e)Directional total horizontal derivative THDx;(f)Directional total horizontal derivative THDy;(g)Directional total horizontal derivative THDz;(h)Enhanced directional total horizontal derivative ETHDx;(i)Enhanced directional total horizontal derivative ETHDy;(j)Enhanced directional total horizontal derivative ETHDz |
边界探测器EDT和EEDT都为非均衡滤波器,不能很好地同时显示不同振幅大小的异常的边界.为了避免这一缺点,对其采用了归一化方法.
本文采用位场数据的一阶垂向导数来对EDT进行归一化处理,表达式为
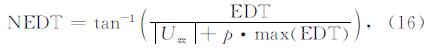
这里引入常数p,一般大小在0.001到0.1.常数p的引入是为了避免产生额外错误的边界.大的p值 将降低均衡效果,小的p值将加强弱振幅异常的边界.
边界探测器EEDT的归一化表达式为

为了验证本文方法的可行性,我们选用两种常 用的方法进行对比.它们是倾角总水平导数(THDR)和Theta图(Verduzco et al.,2004; Wijns et al.,2005).
5 模型试验建立如下重力异常模型一:模型中包含4个垂直棱柱体,各个棱柱体的上顶埋深分别为1 km,1 km,2 km,2 km.图 2显示了模型体的平面图和3维图.各个棱柱体的厚度都为1 km,剩余密度为 200 kg·m-3.图 3为合成的重力异常模型.重力异常模型的梯度张量数据可以通过数值计算和实际测量得到.这里,合成模型的重力梯度张量值通过理论公式计算得到(Forsberg,1984)(图 4a—4c).图 4d—4i分别为EDT,EEDT,NEDT,NEEDT,THDR和Theta图 的边界结果.可以看出,EDT和EEDT为非均衡滤波器,对于深部异常体的边界检测能力较弱,显示结果不清晰.NEDT和NEEDT相对于两种常用的边界探测器THDR和Theta图法更加清晰和准确.
 |
图 2 模型体平面图(a)和三维图(b) Fig. 2 Plan view(a) and 3D view(b)of synthetic model |
 |
图 3 合成重力异常图,棱柱体的剩余密度为200 kg·m-3 Fig. 3 Synthetic gravity anomaly model. The contrasted densities of prisms are 200 kg·m-3 |
为了进一步验证方法的有效性,建立更加复杂的重力异常模型二,其中包含正负异常,更加符合实际地质情况.模型体的大小和位置与图 2相同.唯一 不同的是棱柱体1和3的剩余密度为200 kg·m-3; 棱柱体2和4的剩余密度为-200 kg·m-3.合成的重 力异常见图 5.图 6为计算的梯度张量和相应的边界检测结果.可以看出,当同时包含正负异常时,传统的边界探测器THDR和Theta图虽然能很好地识别地质体的边界,但是引入了一些额外的错误边界.然而,本文提出的均衡探测器能很好地识别异常体的边界,没有引入错误的边界信息,能更好地完成 边界识别工作.其中,NEDT中的p值为0.1;NEEDT 中的p值为0.08.
 |
图 4 模型一的重力梯度和不同方法的边界识别结果 (a)重力梯度Uyx;(b)重力梯度Uzx;(c)重力梯度Uzy;(d)异常的EDT结果;(e)异常的EEDT结果;(f)异常的NEDT结果,p=0.001;(g)异常的NEEDT结果,p=0.001;(h)异常的THDR结果;(i)异常的Theta图结果. Fig. 4 Gravity gradients of model one and the edges detected by different methods (a)Gravity gradient Uyx;(b)Gravity gradient Uzx;(c)Gravity gradient Uzy;(d)EDT of the data in Fig. 3;(e)EEDT of the data in Fig. 3;(f)NEDT of the data in Fig. 3,with p=0.001;(g)NEEDT of the data in Fig. 3,with p=0.001;(h)THDR of the data in Fig. 3;(d)Theta map of the data in Fig. 3. |
 |
图 5 合成的重力异常,棱柱体1和3的剩余密度为200 kg·m-3,棱柱体2和4的剩余密度为-200 kg·m-3 Fig. 5 Synthetic gravity anomaly model. The contrasted densities of prisms 1 and 3 are 200 kg·m-3,the contrasted densities of prisms 2 and 4 are -200 kg·m-3 |
 |
图 6 同图 4,但为模型二的重力梯度和不同方法的边界识别结果 Fig. 6 Same as Fig. 4,but for gravity gradients and the edges detected by different methods of model two |
为了验证方法的稳定性,对图 6中模型二的各个重力梯度值增加5%的高斯白噪声,图 7a—7c为加入噪声后的重力梯度值.图 7d—7i为噪声数据的 边界检测结果.其中,NEDT中的p值为0.1,NEEDT 中的p值为0.0.001.可以看出,EEDT相对于EDT受噪声的影响较大,主要是由于EEDT利用了位场数据的三阶导数,放大了噪声的影响;由于噪声的干扰,THDR已经无法给出地质体的边界,而NEEDT和Theta图法受到噪声的影响较大.相对而言,NEDT抗噪能力强,更加稳定.
 |
图 7 同图 4,但为加入噪声后的模型二的重力梯度和不同方法的边界识别结果 Fig. 7 Same as Fig. 4,but for gravity gradients and the edges detected by different methods of model two add 5% Gaussian noise |
利 用本文提出的方法对磁异常数据进行处理前,需要对磁异常数据进行化极处理,因为磁数据及其导数均受磁化方向的干扰.因此采用化极后的数据进行解释所获得的结果将更加准确(Li,2006).
6 应用到实际数据为了验证方法在实际中的应用效果,分别对加拿大圣乔治湾的全张量重力梯度张量数据和中国朱日和地区的磁异常数据进行边界检测.
图 8a—8c为Air-FTG全张量重力梯度仪在圣 乔治湾测得的重力梯度张量数据,飞行线距为500 m,联络线距为5000 m,飞行的高度为100 m;图 8d—8i为识别的边界结果.可以看出,非均衡边界探测器EDT和EEDT的识别能力较差,识别的边界结果不够清晰,且不能同时显示不同振幅大小的异常的边 界.常用的均衡探测器THDR的显示能力较差,不 能显示地质体边界.Theta图法可以很好地显示地质体的边界,但是识别出来的边界并不十分清晰.而NEDT和NEEDT识别出来的边界相对于Theta图的结果更加清晰、准确,尤其是NEEDT识别出来的边界更清晰准确.其中,NEDT中的p值为0.005,NEEDT中的p值为0.001.
图 9a为朱日和地区化极后的磁异常数据,勘探区域面积为73 km×117 km,采样间隔为20 m,飞行高度为1500 m,飞行线距为500 m.勘探区域为新元古代超层序,主要由大陆沉积物组成,除一些富含铁的沙堰堤坝外基本不含任何铁磁性物质.磁异常数据主要由SE-NW向的堤坝产生的近线性异常和铁异常构成.图中的黑色点线为已知的构造.相应 的梯度值通过数值计算得到(Minkus and Hinojosa,2001). 图 9b—9g为相应的边界检测结果.可以看出,NEDT和NEEDT的边界识别效果明显好于其他方法的,能更加清晰地显示边界信息.其中,NEDT和NEEDT中的p值为0.005.
 |
图 8 同图 4,但为加拿大圣乔治湾地区全张量重力梯度值边界检测结果 Fig. 8 Same as Fig. 4,but for edges of full tensor gravity gradients anomalies in St. Georges Bay,Canada |
 |
图 9 朱日和地区磁异常边界检测结果 (a)化极后的磁异常数据;(b)异常的EDT结果;(c)异常的EEDT结果;(d)异常的NEDT结果;(e)异常的NEEDT结果;(f)异常的THDR结果;(g)异常的Theta图结果. Fig. 9 Edge results of magnetic anomalies in the Zhurihe area (a)Reduction to pole of magnetic data;(b)EDT of the data in(a);(c)EEDT of the data in(a);(d)NEDT of the data in(a); (e)NEEDT of the data in(a);(f)THDR of the data in(a);(g)Theta map of the data in(a). |
本文针对位场梯度张量数据包含多个信息成分的优势,提出方向总水平导数和加强方向总水平导数.根据方向总水平导数和加强方向总水平导数建立了两个新的边界探测器,并对其进行归一化处理,以便能同时检测不同振幅大小异常的边界.当异常数据同时包含正负异常时,本文提出的新探测器能很好地避免产生错误的边界信息,而传统的THDR和Theta图将产生额外的错误边界信息.通过模型试验和实际数据,证明了基于方向总水平导数和加强方向总水平导数定义的边界探测器能很好地识别地质体的边界,且识别出来的边界更加清晰、准确,避免了错误边界信息的引入.
致谢 感谢加拿大自然资源部(Natural Resources Canada)提供圣乔治湾(St. Georges Bay)的Air-FTG 全张量重力梯度测量数据,并允许发表数据处理结果.感谢为评审本文所付出努力的专家.
| [1] | Beiki M. 2010. Analytic signals of gravity gradient tensor and their application to estimate source location. Geophysics, 75(6): I59-I74. |
| [2] | Cooper G R J, Cowan D R. 2004. Filtering using variable order vertical derivatives. Computer & Geosciences, 30(5): 455-459. |
| [3] | Cooper G R J, Cowan D R. 2006. Enhancing potential field data using filters based on the local phase. Computer & Geosciences, 32(10): 1585-1591. |
| [4] | Cordell L. 1979. Gravimetric expression of Graben faulting in Santa Fe country and the Espanola Basin, New Mexico. New Mexico Geol. Soc. Guidebook, 30th Field Conf., 1979: 59-64. |
| [5] | Cordell L, Grauch V J S. 1985. Mapping basement magnetization zones from aeromagnetic data in the San Juan basin, New Mexico. //Hinzc W J ed. The Utility of Regional Gravity and Magnetic Anomaly. Society of Exploration Geophysics, 181-197. |
| [6] | Evjen H M. 1936. The place of the vertical gradient in gravitational interpretations. Geophysics, 1(1): 127-136. |
| [7] | Forsberg R. 1984. A study of terrain reductions, density anomalies and geophysical inversion methods in gravity field modelling. Dept. of Geodetic Science and Surveying, Report 355, Ohio State University. |
| [8] | Hsu S H, Sibuet J C, Shyu C T. 1996. High-resolution detection of geologic boundaries from potential-field anomalies: An enhanced analytic signal technique. Geophysics, 61(2): 373-386. |
| [9] | Li X. 2006. Understanding 3D analytic signal amplitude. Geophysics, 71(2): L13-L16. |
| [10] | Ma G Q, Huang D N, Yu P, et al. 2012. Application of improved balancing filters to edge identification of potential field data. Chinese J. Geophys. (in Chinese), 55(12): 4288-4295, doi: 10.6038/j.issn.0001-5733.2012.12.040. |
| [11] | Marson I, Klingele E E. 1993. Advantages of using the vertical gradient of gravity for 3-D interpretation. Geophysics, 58(11): 1588-1595. |
| [12] | Mikhailov V, Pajot G, Diament M, et al. 2007. Tensor deconvolution: A method to locate equivalent sources from full tensor gravity data. Geophysics, 72(5): 161-169. |
| [13] | Miller H G, Singh V. 1994. Potential field tilt—a new concept for location of potential field sources. Journal of Applied Geophysics, 32(2-3): 213-217. |
| [14] | Minkus K L, Hinojosa J H. 2001. The complete gravity gradient tensor derived from the vertical component of gravity: a Fourier transform technique. Journal of Applied Geophysics, 46(3): 159-174. |
| [15] | Nabighian M N. 1984. Toward a three-dimensional automatic interpretation of potential field data via generalized Hilbert transforms: Fundamental relations. Geophysics, 49(6): 780-786. |
| [16] | Oruç B, Keskinsezer A. 2008. Structural setting of the northeastern Biga Peninsula (Turkey) from tilt derivatives of gravity gradient tensors and magnitude of horizontal gravity components. Pure and Applied Geophysics, 165(9-10): 1913-1927. |
| [17] | Oruç B, Sertçelik I, Kafadar Ö, et al. 2013. Structural interpretation of the Erzurum Basin, eastern Turkey, using curvature gravity gradient tensor and gravity inversion of basement relief. Journal of Applied Geophysics, 88: 105-113. |
| [18] | Rajagopalan S, Milligan P. 1994. Image enhancement of aeromagnetic data using automatic gain control. Exploration Geophysics, 25(4): 173-178. |
| [19] | Sertcelik I, Kafadar O. 2012. Application of edge detection to potential field data using eigenvalue analysis of structure tensor. Journal of Applied Geophysics, 84: 86-94. |
| [20] | Verduzco B, Fairhead J D, Green C M, et al. 2004. New insights into magnetic derivatives for structural mapping. The Leading Edge, 23(2): 116-119. |
| [21] | Wijns C, Perez C, Kowalczyk P. 2005. Theta map: edge detection in magnetic data. Geophysics, 70(4): L39-L43. |
| [22] | Zhou W N, Du X J, Li J Y. 2013. The limitation of curvature gravity gradient tensor for edge detection and a method for overcoming it. Journal of Applied Geophysics, 98: 237-242. |
| [1] | 马国庆, 黄大年, 于平等. 2012. 改进的均衡滤波器在位场数据边界识别中的应用. 地球物理学报, 55(12): 4288\ 4295, doi: 10.6038/j.issn.0001\ 5733.2012.12.040.. |