 2015, Vol. 58

2. 中国科学院大学, 北京 100049
 , SONG Sha-Lei1
 , LI Fa-Quan1, CHENG Xue-Wu1, CHEN Zhen-Wei1, LIU Lin-Mei1, YANG Yong1, GONG Shun-Sheng1
2. University of Chinese Academy of Sciences, Beijing 100049, China
Lidar observation results are presented to investigate the overall lidar performance. The maximum deviation of temperatures measured by the PRR lidar and the local meteorological radiosonde below 30 km is about 3.0 K, which shows good consistency and validates the reliability of the PRR lidar. Obvious deviation may occur because of balloon drifts, regional differences and special phenomena like the thermal inversion layer. Temperature profiles at different temporal scales (10 min, 30 min and 60 min) are given for analysis of the wave properties and microstructures. The statistical temperature errors vary with the spatial resolutions in different detection ranges. For the lidar temperature profile of 30 min integration, the statistical error is about 0.3 K for altitudes of 10~20 km with 300 m spatial resolution; about 0.8 K for 20~30 km with 600 m resolution; while with 900 m spatial resolution, it is about 3.0 K for altitudes from 30 km up to 40 km. Besides, one night temperature profile with 30 min integration and varying spatial resolutions are given for the study of atmospheric thermal structure and dynamical fluctuations.
Temperature measurement up to 40 km by the PRR lidar possesses great potential for the further combination with the Rayleigh lidar of 30~80 km detection capacity, which provides a long-term effective method for the study of lower atmosphere to upper stratosphere.
大气温度是大气物理与化学、天气分析与预报及大气环境研究中的一个重要气象参数.10 km以下的对流层大气温度与人类活动密切相关,其变化也间接反映了臭氧的变化(王卫国等,2006); 10~20 km的上对流层与下平流层(Upper Troposphere/Lower Stratosphere,UTLS)之间的物理化学过程及其效应对气候变化起着重要的作用(Stohl et al.,2003);地球大气中的动态变化过程,如潮汐波、行星波、重力波等大气波动的形成、传播和破碎,覆盖了从对流层到热层各个大气层段,直接影响大气温度 变化(Hauchecorne et al.,1992; Alpers et al.,2004; Rauthe et al.,2006). 因此,实现各个层段的大气温度连通性探测,对研究各大气层之间的能量传播以及人类活动对大气环境的影响都具有重要意义.
利用激光在大气中的多种散射机制,大气探测激光雷达可以实现从近地面到中间层低热层(Mesosphere and Lower Thermosphere,MLT)多个层段大气温度等参数的探测,并具有极高的时间分辨率和空间分辨率.其中,Rayleigh散射激光雷达基于理想气体定律和静力学平衡两个假设,通过测量纯净大气的相对密度,可以较为准确地反演出大约30 km以上大气的绝对温度.但受气溶胶等因素影响,对30 km 以下大气温度的测量则有较大的偏差(Hauchecorne and Chanin,1980; Whiteway and Carswell,1995; Singh et al.,1996; Nee et al.,2002). 采用振动Raman散射机制可以实现对流层中上部到30 km附近的大气温度探测,但是由于其散射截面较小,而且受气溶胶、云和臭氧浓度等因素的影响,使得探测高度和精度相对受限(Keckhut et al.,1990; Faduilhe et al.,2005; 吴永华等,2004);纯转动Raman测温机制由于其散射截面大于振动Raman散射截面,而且区别于弹性散射回波信号,不受大气消光的影响,因 而可实现低层大气温度的高精度探测(Cooney,1972; Arshinov et al.,1983; 刘玉丽等,2006),探测范围基本上达到了Rayleigh散射激光雷达的高度范围下限,从而与Rayleigh测温的起始高度进行衔接,是实现中低空大气温度探测的有效手段.
但是转动Raman散射信号的强度相对于Mie散射和Rayleigh散射弱3~4个数量级,要实现从近地面至30 km以上大气温度的高精度测量,除了需要高功率激光源和大口径望远镜接收,关键技术还在于实现对Mie-Rayleigh散射信号6~8个数量级的抑制,以保证高的信噪比.随着高分辨滤光和弱信号检测技术的发展,转动Raman激光雷达的温度探测范围已经从地面1~2 km(Cooney and Pina,1976; Mao et al.,2009)延伸到了平流层中上部(30 km以上)(Nedelijkovic et al.,1993; Behrendt and Reichardt,2000; Behrendt et al.,2004; Achtert et al.,2013).
基于转动Raman测温激光雷达技术的发展,德国莱布尼茨大气物理研究所(IAP)利用三种不同的激光雷达测温机制拼接初步实现了1~105 km范围内的大气温度探测(Alpers et al.,2004),并基于此开展了对大气重力波的深入研究(Rauthe et al.,2006).瑞典的Esrange转动Raman激光雷达实现了5~35 km范围的大气温度探测,与Rayleigh测温机制结合,为研究重力波的传播过程、极地平流层云(PSCs)的形成以及大气中的微观物理特性(Achtert et al.,2013)提供了重要手段.武汉大学设计的转动Raman激光雷达系统基于双光栅分光的方法完成了对5~30 km大气温度的探测研究,根据观测统计结果就对流层中逆温层对温度变化的影响进行了分析(Jia and Yi,2014).
由此可见,利用转动Raman机制实现近地面至30 km以上大气温度探测,并与中层Rayleigh测温机制有效衔接,是研究大范围大气波动现象及其微观物理特性的重要前提.为了更为准确地衔接Rayleigh散射激光雷达和转动Raman散射激光雷达的测温廓线,并相互验证这两种机制激光雷达探测结果的可靠性,需要进一步提高转动Raman散射激光雷达的探测范围,使得两者有较为充足的重叠探测区域.
本文介绍了中国科学院武汉物理与数学研究所研制的一台用于探测中低层大气温度分布的纯转动Raman激光雷达系统,可实现对武汉城市上空10~40 km范围的大气温度垂直探测.观测结果与探空气球进行比对,具有较好的一致性,验证了本激光雷达系统的可靠性.虽然本文报道的是转动Raman激光雷达10~40 km的探测结果,但是通过增加一个低空通道的方法,很容易将本转动Raman测温技术下推到低空,探测从近地面到约15 km高度.这样就实现了从近地面一直到约40 km的大气温度探测.此范围贯穿对流层及大部分平流层,为研究该范围大气中的热力学及动力学过程奠定了很好的基础.
2 转动Raman激光雷达测温原理转动Raman激光雷达测温是基于大气中N2、O2分子的转动Raman各条谱线强度随温度变化的原理实现温度探测(Cooney,1972; Penney et al.,1974).根据转动Raman跃迁选择定则(ΔJ=±2),纯转动Raman光谱有Stokes和anti-Stokes两支谱线,对称分布于发射激光波长的两边.由于N2、O2分子的Stokes谱线受到大气荧光的干扰(Kitada et al.,1994),因此通常只取N2、O2分子的anti-Stokes谱线来分析其强度随温度的变化规律,如图 1所示.转动 Raman能级上的粒子数分布服从Boltzmann分布规律,在低转动量子数的位置,谱线强度随着温度的升高而明显降低,表现为负的温度相关性;在高转动量子数的位置,谱线强度随着温度的升高而增强,表现为正的温度相关性.
 |
图 1 激光波长为532.1 nm,温度分别为200 K和280 K时,大气中N2、O2分子与激光相互作用产生的纯转动Raman谱线(anti-Stokes)强度分布情况,RR1和RR2对应谱线的两个温度敏感区域 Fig. 1 The anti-Stokes branch of pure rotational Raman spectrum of molecular nitrogen and oxygen at T=280 K and T=200 K. The laser wavelength is set at 532.1 nm in air. RR1 and RR2 are two regions of opposite temperature dependence |
根据转动Raman谱线强度随温度的变化规律,对转动Raman谱线的两个温度敏感区域进行分光探测,建立转动Raman温度反演函数.根据激光雷达方程,转动Raman散射的回波信号强度SRR如公式(1)所示,
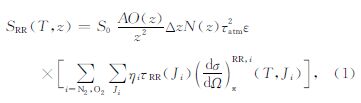
 表示分子各条Raman谱线的微分后向散射截面.
从公式(1)可知,转动Raman激光雷达的回波信号不仅与大气参数有关,还与激光雷达系统的配置参数直接相关,包括激光雷达质量因子(激光能量与望远镜接收面积的乘积)、探测器效率、滤光片选择Raman谱线的透过参数等.
在温度反演时,通过构建两个转动Raman通道 的信号强度之比Q(T),如公式(2)所示,可以将激光能量、望远镜口径、大气密度等系统参数和大气参数抵消(Fraczek et al.,2013),因而只需考虑两个通道在所选滤光片下透过的分子Raman谱线强度.
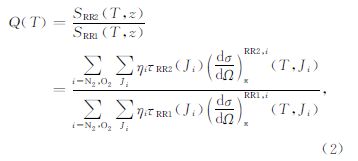
通过选择适合的校准函数,可以反演得到大气温度(Behrendt,2005):
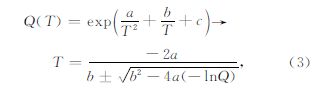
一方面,两个转动Raman通道内的谱线强度分布决定了转动Raman激光雷达对温度的敏感性,需要通过高性能分光与滤光技术实现最优转动Raman谱线的选择;另一方面,转动Raman的回波强度比大气弹性散射回波强度要低3~4个数量级,要获取高精度的转动Raman分子谱线信号,必须对弹性散射信号达到6~7个数量级的抑制.因此对两个转动Raman通道的中心波长和带宽的选择是转动Raman激光雷达系统设计和运行重要的基础.
随着滤光片技术的发展,多腔窄带薄膜干涉滤光片在超窄带宽、高透射率和高带外抑制能力以及温度不敏感性等诸多方面性能优越,同时改变干涉滤光片的角度可以调谐中心透射波长和带宽,在转动Raman激光雷达分光与滤光应用中具有独特优势.本节通过对滤光片的参数选取进行模拟计算,得出理论最优的滤光片中心波长和带宽参数,为后续的激光雷达系统分光滤光设计提供理论参考.
首先考虑信号强度对温度的敏感性:

激光频率f=532.1 nm时,设定温度在大气可探测温度200~280 K之间,滤光片中心波长范围 528~532 nm,带宽范围0~3 nm,模拟计算得到的滤光片透过信号强度随温度的变化率如图 2a所示.颜色条所示大于0的区域表示信号与温度呈正相关性,小于0的区域代表负相关性,两个区域以中心波长530.2 nm为界,可作为转动Raman通道选择的依据.在模拟计算时滤光片的透射曲线视为矩形,理想透射率τ=1,中心波长(CWL)和带宽(FWHM)的变化步长均取0.01 nm.当正负相关性达到最大 时,两个通道的中心波长和带宽分别对应为:CWL1=531.03 nm,FWHM1=1.44 nm,CWL2=528.8 nm,FWHM2=3.0 nm.
 |
图 2 (a)在不同的中心波长和带宽时,模拟计算得到的滤光片透过信号强度随温度的变化率;(b)两个转动Raman通道中的滤光片带宽固定不变(0.7 nm,1.1 nm),选择不同中心波长时,模拟计算得到的温度测量不确定度 Fig. 2 (a)Temperature dependency of the calculated signals for filters with different central wavelengths(CWL) and channel passb and s(FWHM);(b)Simulated calculations of the temperature measurement uncertainty for different center wavelengths in the two rotational Raman channels with filter b and widths of 0.7 nm and 1.1 nm |
在选取最优的滤光片中心波长和带宽时,除了信号强度对温度的敏感性,还要考虑滤光片的透过率以及对弹性散射信号的抑制.
激光雷达回波信号按照光子计数,1-σ统计误差服从泊松分布,计算得到转动Raman温度测量不确定度(Behrendt,2005):
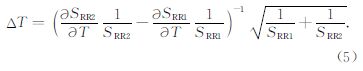
由于RR1通道离激光波长更近,将通过设计更窄带宽来抑制激光弹性散射信号;而RR2通道离激光波长较远,则带宽相对较宽.两个转动Raman通 道(RR1,RR2)的滤光片带宽分别设为0.7、1.1 nm,模拟计算得到温度测量不确定度如图 2b所示.当ΔToptimum=1时,两个转动通道的理论最佳中心波长范围分别在531.39~531.45 nm以及528.5~528.7 nm,如图 2b中矩形范围所示.
然而在实际应用中,滤光片的透射谱型和透过率难以达到理论模拟计算的理想参数,而且对弹性散射信号的抑制能力也跟发射激光的线宽密切相关,转动Raman分光接收系统设计将基于模拟计算所选择的最优中心波长和带宽范围进行优化调整.
4 转动Raman激光雷达系统转动Raman激光雷达系统结构如图 3所示,主要包括激光发射单元、接收分光单元和信号采集处理单元.系统主要参数见表 1.发射单元采用Nd:YAG固体激光器倍频输出532.1 nm激光作为Raman激发光,单脉冲能量约为300 mJ,脉冲重复 频率30 Hz.经扩束准直后,激光发散角为170 μrad,然后由导光镜垂直导向大气.接收分光单元采用1 m口径的卡塞格林式望远镜接收回波信号,经光纤导入分光滤光系统,分到两个Raman通道中的信号会 聚到光电探测器PMT,最后由Licel瞬态记录仪进行采集并处理.
 |
图 3 转动Raman激光雷达系统结构图 Fig. 3 Schematic setup of the rotational Raman lidar |
| 表 1 转动Raman激光雷达系统参数 Table 1 Technical parameters of the rotational Raman lidar |
本激光雷达系统中激光发射波长的选择,主要出于集成Raman与Rayleigh散射两种机制以实现中低空风温联合探测的考虑,通过激光扩束准直、严格的收发匹配、高分辨的分光滤光以及弱信号检测等技术,不仅可以提高系统整体的工作性能,也为获取更高精度和高度的温度数据提供了保障.
转动Raman激光雷达系统的关键技术是实现对两个转动Raman通道的高分辨分光滤光接收.
如图 4a所示,望远镜接收光由光纤OF接入组合准直镜CL,分光系统采用高分辨的干涉滤光片进行分光与滤光,通过“Z”型光路设计实现Raman信 号与弹性散射信号的分离,并提取出两个转动Raman 通道的回波信号.利用滤光片的角度调谐和“Z”型 光路设计可以缩短光路使系统更加稳定.图 4b中准 直系统由三个透镜设计组合而成,其有效焦距为73 mm. 基于激光雷达接收分光系统设计和模拟计算分析,IF1和IF2中心波长分别为530.9 nm和528.9 nm,半高宽分别为0.7 nm和1.1 nm,分别对应RR1和RR2转动Raman通道.其中,由于RR1通道的滤光片中心波长距离发射激光波长比较近,所以用两个窄带干涉滤光片IF1a和IF1b实现对弹性散射信号7个数量级的抑制,而RR2的中心波长距离发射激光波长较远,可实现对弹性散射信号6个数量级的抑制.图 4c表示接收光信号经组合的准直镜后依次经过干涉滤光片IF0、IF1a、IF1b和IF2后的透射谱型,其温度测量的不确定度为ΔT=1.1×ΔToptimum,与模拟计算的最优参数性能接近,该设计在理论计算中具有较高的测温精度.
 |
图 4 转动Raman激光雷达分光与滤光设计图(a)分光与滤光光路图;(b)准直光路;(c)实测滤光片透过谱. Fig. 4 Design of the light splitting and filtering system for rotational Raman lidar(a)Optical path of the light splitting and filtering;(b)Collimating system;(c)Transmittance profiles of the tested filters. |
转动Raman测温激光雷达在武汉市晴朗的夜 晚进行观测实验.通过数据反演,获得了武汉地区 10~40 km高度(近300个小时)的大气温度观测结果.将激光雷达的大气温度探测结果与探空气球探测结果进行对比分析,发现二者具有较好的一致性,说明了系统的可靠性,同时激光雷达可以实现一晚上连续观测,在10~40 km探测范围内具有较高的探测精度.
5.1 激光雷达温度探测及与气球探空数据的比较转动Raman测温激光雷达接收到的原始回波信号如图 5所示,观测时间为2014年6月4日晚上20 ∶ 01—21 ∶ 02,采用300 m的空间分辨和1 h的时间分辨.由原始回波信号可以看出,在大约3 km高度信号开始进入视场,直到10 km左右完全进入视场.由于采用旁轴发射,较高进入视场有利于抑制低空过强信号所带来的饱和效应,从而保证高空信号质量和探测高度,其高度探测可达到40 km.
 |
图 5 转动Raman激光雷达原始回波信号 Fig. 5 Raw received signals of the rotational Raman lidar |
基于图 5的原始回波信号,转动Raman激光雷达观测反演得到的10~40 km范围的温度廓线如图 6所示.将激光雷达与探空气球同时段观测的温度廓线进行了比对,结果表明在10~40 km的整个探测范围,激光雷达温度探测的数值与变化趋势与气球探测的温度数据都符合得很好:30 km以下两者的最大偏差不大于3 K,只是在30 km以上两者才出现了较大的偏离.这一方面是因为,在同样的时空分辨(1 h,300 m)下,激光雷达探测的统计误差随探测高度而增大.另一方面,由于探空气球随着飞行高度增加,水平方向上逐渐偏离激光雷达观测上空(陈哲,2010),以及对30 km以上探空气球的辐射标定能力较差(张利等,2013)等原因也可能导致两者偏差的增大.
 |
图 6 (a)实线为转动Raman激光雷达获取的温度廓线,圆圈表示探空气球发布的温度数据;误差棒显示温度统计误差;(b)实线表示统计误差,圆圈表示激光雷达探测结果与探空气球测量结果之间的温度偏差 Fig. 6 (a)Temperature profiles measured by the rotational Raman lidar(solid line)in comparison with the simultaneous radiosonde(circles). Error bars show the statistical errors of the lidar measurement;(b)Statistical errors of the lidar measurement(solid line) and the temperature deviations between lidar and radiosonde(circles) |
图 6a中激光雷达温度探测结果的统计误差随高度的变化情况示于图 6b.可见,在同样的时空分辨率下,激光雷达的探测误差随探测高度增加而增大,在10 km附近,统计误差约为0.4 K,在探测高端的30~40 km范围,最大统计误差约为8 K,即探测高低端的统计误差可相差约20倍.因此,为获得高的温度探测精度,可采用进一步降低时空分辨率(特别是降低探测高端的空间分辨)的办法.相反,如果对探测数据的时空分辨有较高的要求,则探测精度必然会降低.
5.2 不同时间、空间分辨下温度探测的统计误差大气的状态和特性随着高度升高具有显著的变化.越往高空大气越稀薄,激光雷达接收到的回波信号强度不仅与探测高度的平方成反比,而且与大气的衰减密切相关.因此在不同高度段,其回波信号具有不同的信噪比,而温度测量的统计误差直接受信噪比的影响.在激光雷达探测数据的处理中,通常采用在同一时间分辨下,对探测的低、中、高段采用不同空间分辨的办法,来尽可能缩小高、中、低空探测统计误差的差异.
图 7给出了2014年4月4日晚上转动Raman激光雷达探测得到的温度廓线及测量统计误差.在1 h积分时间内,对不同高度段采用不同的空间分 辨率,如图 7a所示,10~20 km高度范围选用150 m空间分辨,20~30 km之间采用450 m空间分辨,30~40 km采用750 m空间分辨.图 7b给出了不同高度段采用不同空间分辨时的温度统计误差.10~20 km统计误差约为0.3 K(探测范围内统计误差的平均值),20~30 km 统计误差约为0.7 K,30~40 km范围统计误差约为2.3 K.
 |
图 7 (a)时间分辨为1 h,对不同高度段分别采用不同空间分辨率得到的温度廓线(实线所示10~20 km采用150 m空间分辨,虚线所示20~30 km采用450 m分辨,点线所示30~40 km采用750 m分辨),误差棒表示温度统计误差;(b)在不同高度段温度测量的统计误差(实线)以及激光雷达探测结果与探空气球测量结果之间的温度偏差(圆圈) Fig. 7 (a)Combined temperature profile with 1 h integration and different spatial resolutions for different altitudes(the solid line is for 10~20 km with 150 m resolution,the dashed line is for 20~30 km with 450 m resolution,and the dotted line is for 30~40 km with 750 m resolution). Error bars show the statistical errors of the lidar temperature;(b)Statistical temperature errors of the lidar measurement for different altitudes with different spatial resolutions(solid line)and the temperature deviations between lidar and radiosonde(circles) |
考虑到大气中的一些波动现象变化周期较短,只有探测出较稳定的温度廓线上的快速变化成分,才能捕捉到一些微小的波动变化信息.因此,利用激光雷达探测高时间分辨下的温度廓线有助于研究大气中的波动现象及微观物理特性.为同时保证激光雷达探测结果的信噪比,从而确保温度探测的精度,仍要求对不同高度段采用不同的空间分辨率.将累积时间减少到30 min,2014年4月4日晚上激光雷达探测得到的温度廓线及统计误差如图 8所示,图 8a中显示的温度廓线在不同高度段采用了不同的空间分辨率:10~20 km高度范围内空间分辨率为300 m,20~30 km之间空间分辨率为600 m,30~40 km之间为900 m空间分辨.不同高度段的统计 误差如图 8b所示.10~20 km统计误差约为0.3 K,20~30 km 统计误差约为0.8 K,30~40 km范围统计误差约为3.0 K.
 |
图 8 (a)时间分辨为30 min,对不同高度段分别采用不同空间分辨率得到的温度廓线(实线所示10~20 km采用300 m空间分辨,虚线所示20~30 km采用600 m分辨,点线所示30~40 km采用900 m分辨),误差棒表示温度统计误差;(b)在不同高度段温度测量的统计误差(实线)以及激光雷达探测结果与探空气球测量结果之间的温度偏差(圆圈) Fig. 8 (a)Combined temperature profile with 30 min integration and different spatial resolutions for different altitudes(the solid line is for 10~20 km with 300 m resolution,the dashed line is for 20~30 km with 600 m resolution,and the dotted line is for 30~40 km with 900 m resolution). Error bars show the statistical errors of the lidar temperature;(b)Statistical temperature errors of the lidar measurement for different altitudes with different spatial resolutions(solid line)and the temperature deviations between lidar and radiosonde(circles) |
进一步,采用10 min的时间分辨,2014年4月4日晚上激光雷达探测得到的温度廓线及统计误差如图 9所示,10~20 km探测范围采用450 m空间分辨,统计误差约为0.4 K;20~30 km之间采用750 m空间分辨,统计误差约为1.1 K;30~40 km之间采用1200 m空间分辨,统计误差约为3.8 K.
 |
图 9 (a)时间分辨为10 min,对不同高度段分别采用不同空间分辨率得到的温度廓线(实线所示10~20 km采用450 m 空间分辨,虚线所示20~30 km采用750 m分辨,点线所示30~40 km采用1200 m分辨),误差棒表示温度统计误差;(b)在不同高度段温度测量的统计误差(实线)以及激光雷达探测结果与探空气球测量结果之间的温度偏差(圆圈) Fig. 9 (a)Combined temperature profile with 10 min integration and different spatial resolutions for different altitudes(the solid line is for 10~20 km with 450 m resolution,the dashed line is for 20~30 km with 750 m resolution,and the dotted line is for 30~40 km with 1200 m resolution). Error bars show the statistical errors of the lidar temperature;(b)Statistical temperature errors of the lidar measurement for different altitudes with different spatial resolutions(solid line)and the temperature deviations between lidar and radiosonde(circles) |
2014年4月4日晚上激光雷达探测得到的温度廓线与探空气球的结果相比较,在25 km以下吻合都比较好,最大偏差约为3 K.而在25 km以上,激光雷达探测得到的大气温度相比于气球探测结果明显偏低,最大偏差约为8 K.观察比较气球和激光 雷达获取的温度廓线,在25 km附近均出现了逆温
现象.利用激光雷达探测这一高度的大气温度时,测温精度约为1~2 K,而在这一高度探空气球的测温能力已接近其上限.因气球随高度增加会水平漂移,在25 km高度可能已远远偏离激光雷达观测地上空.所以,在探测逆温这种特殊的大气现象时,由于地域的差异也使二者出现了较大偏差.
5.3 激光雷达整晚连续观测得到的大气温度廓线图 10a中给出了2014年8月4日晚上21 ∶ 42至8月5日早上04 ∶ 51整晚(约7个小时)观测得到的温度廓线图(蓝线表示),以及当地探空气球分别于8月4日晚上20时和8月5日早上08时发布的温度数据(红圈和黑圈表示).将激光雷达在2014年7月30日20 ∶ 01—21 ∶ 56与同时段探空气球进行校准以后得到的校准系数对8月4日整晚的温度进行校准,激光雷达系统工作状态稳定,因此可以固定校准系数而不用再次校准.
 |
图 10 (a)2014年8月4日晚上 21 ∶ 42至8月5日早上04 ∶ 51整晚观测得到的温度廓线(实线),以及当天晚上2 0 ∶ 00和第二天早上08 ∶ 00探空气球发布的温度数据(圆圈);(b)整晚观测得到的温度等值线图 Fig. 10 (a)Temperature profiles(solid lines)measured by rotational Raman lidar from 21 ∶ 42 on August 4,2014 to 04 ∶ 51 on August 5,2014. The circles are the temperature data released by the local radiosonde at 20 ∶ 00 LT on August 4 and at 08 ∶ 00 LT on August 5;(b)Time-height contour of the temperature profiles observed all night long |
整晚上得到的温度廓线采用30 min时间分辨,10~20 km高度范围采用300 m空间分辨,20~30 km 之间采用600 m空间分辨,30~40 km采用 900 m空间分辨.观测结果表明,转动Raman激光雷达可以探测10~40 km范围的整晚大气温度廓线.将8月4日晚上21:42—22:12观测得到的激光雷达温度廓线与当天晚上20时发布的探空气球温度比对,在10~30 km探测范围内温度偏差小于3 K.同时将8月5日早上04 ∶ 21—04 ∶ 51观测得到的激光雷达温度廓线与当天早上08时发布的探空气球温度进行比对,激光雷达探测温度相比于探空气球普遍偏低,10~20 km温度偏差小于2 K,直到30 km最大偏差约为5.3 K.通过晚上和早上激光雷达与探空气球探测到的温度数据进行比对,二者吻合较好,从而说明了转动Raman激光雷达系统可以连续稳定工作的可靠性.
图 10b为整晚温度廓线的等值线图.由颜色条显示的温度值可以看出,整个晚上中低空大气的温度变化特征为低空温度较高,到18 km高度附近温度降至最低,约195 K.18 km附近的大气温度转折高度对应为武汉上空的对流层顶和平流层底的过渡层,随后温度开始随高度升高而增加,表现为明显的平流层特征.通过高时空分辨和高精度的中低空大气温度探测,为研究小尺度重力波等微妙大气波动现象提供了重要手段.
6 结论本文介绍了一套转动Raman测温激光雷达系统的研制和观测结果.该系统基于高分辨光谱分光与滤光技术,通过接收准直和分光滤光的优化设计,完成了具有高带外抑制能力的转动Raman通道信号接收探测,实现了对武汉城市上空从10 km至40 km范围的中低空大气温度垂直探测.通过将激光雷达观测结果与探空气球温度数据进行比对,在探空气球的有效探测高度内显示出很好的一致性,表明该激光雷达测温的可靠性.在文中所给出的典 型时空分辨下(图 8),10~20 km统计误差约为0.3 K,20~30 km 统计误差约为0.8 K,30~40 km范围统 计误差约为3.0 K.同时观测结果还给出了整晚的温度廓线分布,表明本激光雷达能稳定可靠的连续工作,从而为中低空大气温度连续探测提供了一种有效的探测手段.
本激光雷达可进一步与Rayleigh测温激光雷达30~80 km的高度衔接,为实现中低层大气连续观测研究提供了重要手段.同时,还可与窄激光线宽的钠层共振荧光激光雷达技术相结合,进一步将探测范围覆盖到80~110 km.这样三种机制结合,可实现从近地面直到110 km的全程大气温度探测,为研究大气热力学和动力学提供重要的手段.
致谢 感谢湖北省气象局和武汉市中心气象台提供的气象数据支持.
| [1] | Achtert P, Khaplanov M, Khosrawi F, et al. 2013. Pure rotational-Raman channels of the Esrange lidar for temperature and particle extinction measurements in the troposphere and lower stratosphere. Atmospheric Measurement Techniques, 6(1): 91-98, doi: 10.5194/amt-6-91-2013. |
| [2] | Alpers M, Eixmann R, Fricke-Begemann C, et al. 2004. Temperature lidar measurements from 1 to 105 km altitude using resonance, Rayleigh, and Rotational Raman scattering. Atmos. Chem. Phys., 4(3): 793-800, doi: 10.5194/acp-4-793-2004. |
| [3] | Arshinov Y F, Bobrovnikov S M, Zuev V E, et al. 1983. Atmospheric temperature measurements using a pure rotational Raman lidar. Appl. Opt., 22(19): 2984-2990, doi: 10.1364/AO.22.002984. |
| [4] | Behrendt A, Reichardt J. 2000. Atmospheric temperature profiling in the presence of clouds with a pure rotational Raman lidar by use of an interference-filter-based polychromator. Appl. Opt., 39(9): 1372 -1378, doi: 10.1364/AO.39.001372. |
| [5] | Behrendt A, Nakamura T, Tsuda T. 2004. Combined temperature lidar for measurements in the troposphere, stratosphere, and mesosphere. Appl. Opt., 43(14): 2930-2939, doi: 10.1364/AO.43.002930. |
| [6] | Behrendt A. 2005. Temperature Measurements with Lidar. // Weitkamp C E ed. Lidar: Range-Resolved Optical Remote Sensing of the Atmosphere. New York: Springer, 102: 273-305. |
| [7] | Chen Z. 2010. Characteristics of the overall sounding data drift in China. Meterological Monthly (in Chinese), 36(2): 22-27. |
| [8] | Cooney J. 1972. Measurement of atmospheric temperature profiles by Raman backscatter. J. Appl. Meteor., 11(1): 108-112, doi: 10.1175/1520-0450(1972)011〈0108:MOATPB〉2.0.CO;2. |
| [9] | Cooney J, Pina M. 1976. Laser radar measurements of atmospheric temperature profiles by use of Raman rotational backscatter. Appl. Opt., 15(3): 602-603, doi: 10.1364/AO.15.000602. |
| [10] | Faduilhe D, Keckhut P, Bencherif H, et al. 2005. Stratospheric temperature monitoring using a vibrational Raman lidar, Part 1: Aerosols and ozone interferences. J. Environ. Monitor., 7(4): 357-364, doi: 10.1039/B415299A. |
| [11] | Fraczek M, Behrendt A, Schmitt N. 2013. Short-range optical air data measurements for aircraft control using rotational Raman backscatter. Optics Express, 21(14): 16398-16414, doi: 10.1364/OE.21.016398. |
| [12] | Hauchecorne A, Chanin M L. 1980. Density and temperature profiles obtained by lidar between 35 and 70 km. Geophys. Res. Lett., 7(8): 565-568, doi: 10.1029/GL007i008p00565. |
| [13] | Hauchecorne A, Chanin M L, Keckhut P, et al. 1992. LIDAR monitoring of the temperature in the middle and lower atmosphere. Appl. Phys. B, 55(1): 29-34, doi: 10.1007/BF00348609. |
| [14] | Jia J Y, Yi F. 2014. Atmospheric temperature measurements at altitudes of 5-30 km with a double-grating-based pure rotational Raman lidar. Appl. Opt., 53(24): 5330-5343, doi: 10.1364/AO.53.005330. |
| [15] | Keckhut P, Chanin M L, Hauchecorne A. 1990. Stratosphere temperature measurement using Raman Lidar. Appl. Opt., 29(34): 5182-5186, doi: 10.1364/ AO.29.005182. |
| [16] | Kitada T, Hori A, Taira T, et al. 1994. Strange behaviour of the measurement of atmospheric temperature profiles of the rotational Raman lidar. // 17th International Laser Radar Conference, National Institute for Environmental Studies, Tsukuba, Japan. |
| [17] | Liu Y L, Zhang Y C, Su J, et al. 2006. Rotational Raman lidar for atmospheric temperature profiles measurements in the lower-air. Opto-Electronic Engineering (in Chinese), 33(10): 43-48. |
| [18] | Mao J D, Hua D X, Wang Y F, et al. 2009. Accurate temperature profiling of the atmospheric boundary layer using an ultraviolet rotational Raman lidar. Opt. Commun., 282(15): 3113-3118, doi: 10.1016/j.optcom.2009.04.050. |
| [19] | Nedelijkovic D, Hauchecome A, Chanin M L. 1993. Rotational Raman lidar to measure the atmospheric temperature from the ground to 30 km. IEEE Trans. Geosci. Remote Sens., 31(1): 90-101, doi: 10.1109/36.210448. |
| [20] | Nee J B, Thulasiraman S, Chen W N, et al. 2002. Middle atmospheric temperature structure over two tropical locations, Chung Li (25°N, 121°E) and Gadanki (13.5°N, 79.2°E). J. Atmos. Solar-Terr. Phys., 64: 1311-1319, doi:10.1016/S1364-6826(02)00114-1. |
| [21] | Penney C M, St Peters R L, Lapp M. 1974. Absolute rotational Raman cross sections for N2, O2 and CO2. Journal of the Optical Society of America, 64(5): 712-716, doi: 10.1364/JOSA.64.000712. |
| [22] | Rauthe M, Gerding M, Höffner J, et al. 2006. Lidar temperature measurements of gravity waves over Kühlungsborn (54°N) from 1 to 105 km: A winter-summer comparison. J. Geophys. Res., 111: D24108, doi: 10.1029/2006JD007354. |
| [23] | Singh U N, Keckhut P, McGee T J, et al. 1996. Stratospheric temperature measurements by two collocated NDSC lidars during UARS validation campaign. J. Geophys. Res.,101(D6):10287-10297, doi: 10.1029/96JD00516. |
| [24] | Stohl A, Bonasoni P, Cristofanelli P, et al. 2003. Stratosphere troposphere exchange: A review, and what we have learned form STACCATO. J. Geophys. Res.,108 (D12): 8516, doi: 10.1029 /2002JD002490. |
| [25] | Wang W G, Fan W X, Wu J, et al. 2006. A study of spatial-temporal evolvement of the global cross-tropopause ozone mass flux. Chinese J. Geophys. (in Chinese), 49(6): 1595-1607, doi: 10.3321/j.issn:0001-5733.2006.06.004. |
| [26] | Whiteway J A, Carswell A I. 1995. Lidar observations of gravity wave activity in the upper stratosphere over Toronto. J. Geophys. Res., 100(D7): 14113-14124, doi: 10.1029/95JD00511. |
| [27] | Wu Y H, Hu H L, Hu S X, et al. 2004. Rayleigh-Raman scattering lidar for atmospheric temperature profiles measurements. Chinese Journal of Lasers (in Chinese), 31(7): 851-856. |
| [28] | Zhang L, Liu Q Q, Yang R K, et al. 2013. A method based on the computational fluid dynamics for solar radiation error correction of sounding temperature sensors. Chinese Journal of Sensor and Actuators (in Chinese), 26(1): 78-83. |
| [29] | 陈哲. 2010. 中国探空气球水平漂移总体特征分析. 气象, 36(2): 22-27. |
| [30] | 刘玉丽, 张寅超, 苏嘉等. 2006. 探测低空大气温度分布的转动拉曼激光雷达. 光电工程, 33(10): 43-48. |
| [31] | 王卫国, 樊雯璇, 吴涧等. 2006. 全球平流层-对流层之间臭氧通量的时空演变研究. 地球物理学报, 49(6): 1595-1607, doi: 10.3321/j.issn:0001-5733.2006.06.004. |
| [32] | 吴永华, 胡欢陵, 胡顺星等. 2004. 瑞利-拉曼散射激光雷达探测大气温度分布. 中国激光, 31(7): 851-856. |
| [33] | 张利, 刘清惓, 杨荣康等. 2013. 基于计算流体动力学的探空温度传感器太阳辐射误差修正方法. 传感技术学报, 26(1): 78-82. |