2. 山东省地震局, 济南 250014;
3. 中国地震台网中心, 北京 100045;
4. 新疆维吾尔自治区地震局, 乌鲁木齐 830011
2. Earthquake Bureau of Shandong Province, Jinan 250014, China;
3. China Earthquake Network Center, Beijing 100045, China;
4. Earthquake Administration of Xinjiang Uygur Autonomous Region, Vrümqi 830011, China
This study is based on relocating the Rushan earthquake sequence in 2013—2014 with double-difference algorithm of waveform cross-correlation and analyzing the focal mechanism of stronger earthquake with "Cut and Paste" (CAP) and first motion of P-wave method. The 27 stations with epicentral distance less than 300 km surrounding the epicenter were used to relocate earthquakes. Picking the earthquakes with clear phase records and at least four recording stations, and eliminating the phase records with obvious mistakes and large errors, only considering earthquakes with more than 8 phases, finally, 306 events, 9268 P phases, 9252 S phases are eligible. The CAP method and the P-wave first motion method were used to calculate the focal mechanisms. According to the quality of waveform records and the clarity of first motion of P-wave, 11 broadband stations were selected, including HAY, WED, RCH, LOK, CHD, YTA, BHC, LZH, QID, ANQ, and RZH, which surround the epicenter completely and the epicentral distances are mainly concentrated in 30~250 km. The frequencies of the band-pass filter of Pnl and Snl parts are 0.04~0.2 Hz and 0.02~0.1 Hz respectively. The weight between Pnl and Snl is 2:1.
306 earthquakes of Rushan sequence relocated by the method of double-difference got 277 basic earthquake parameters. The relocation results show that the earthquake sequence is distributed along NW direction, the length of long axis is about 35 km, and the length of short axis is about 5 km. The distribution of the Rushan earthquake sequence is dense in a scope of 8 km×3 km, and the focal depths vary from 4 km to 10 km with the predominant distribution in 4~7 km. The focal mechanism results show that the two earthquakes get the best focal mechanism at a depth of 6 km, the parameters of nodal planes are the same, which belongs to strike slip type. At the depth of 6 km, among the 40 phases of M4.2 earthquake recorded by 8 stations 38 have correlation coefficients greater than 0.7, accounting for 95%. The number of correlation coefficients greater than 0.9 is 23, accounting for about 58%. Similarly, at the depth of 6 km, the correlation coefficients of 40 phases of M4.0 earthquake recorded by 8 stations are all greater than 0.7 and the correlation coefficients greater than 0.9 are 31, accounting for about 78%. So, the synthetic seismograms of two earthquakes fit well with the observed seismograms and the inversion results are credible. The focal mechanism shows that the moment magnitude of M4.2 earthquake is Mw4.3, one nodal plane has the strike of 290°, rake of 90°and dip of 23°, and the other nodal plane has the strike of 200°, rake of 67°and dip of 180°. The moment magnitude of M4.0 earthquake is Mw4.2, one nodal plane has the strike of 289°, rake of 90°and dip of 27°, and the other nodal plane has the strike of 199°, rake of 63°and dip of 180°. Using the first motion method of P-waves to calculate the focal mechanism for more than 9 ML3.0 earthquakes, the results show that the 9 earthquake planes are basically the same, with large dip and nearly horizontal slip, which is consistent with the inversion result by CAP method. The hypocentral distance was calculated by the mobile seismic station near the epicenter. The results show that the focal depth should be slightly less than 7 km, which is consistent with the inversion result by CAP method and relocation result.
The faults parameters nearest to the epicenter are not consistent with the focal mechanism of larger earthquakes, which shows that they are not the seismic faults. The cross-sections of relocation result show that the hypocentral depth distribution is nearly vertical and relatively the same with the dip of one nodal plane of the focal mechanism. Combining the precise relocation results and larger earthquake focal mechanism, one of the nodal planes of larger earthquakes focal mechanism is consistent with the predominant distribution of earthquake sequence. It is preliminarily concluded that the seismogenic fault of the Rushan earthquake sequence is a nearly vertical strike-slip buried fault in NW direction.
2013年10月1日12点07分在山东胶东半岛乳山市(36.83°N;121.70°E)发生ML3.8地震,之后小地震密集发生、连续不断(图 1).据山东数字地震台网测定,自2013年10月1日至2014年4月7日,共记录地震4213次(含乳山台单台定位地震3631次),其中ML1.0~1.9地震416次,ML2.0~2.9地震63次,ML3.0~3.9地震7次,ML4.0以上地震2次,分别是2014年1月7日22时24分的4.2级(ML4.7)地震和4月4日00时12分4.0级(ML4.5)地震.
 | 图 1 乳山地震序列M-t图Fig. 1 M-t plot of the Rushan earthquake sequence |
乳山历史上曾发生公元1046年岠嵎山、1939年下初等多次5级以上地震.本次序列震中附近1997年曾发生过ML4.1地震,但余震极少.有现代仪器记载以来,该区域及附近从未出现过频次如此之高、持续时间如此之长的地震序列活动.乳山4.2、4.0级地震无地表破裂,震中附近区域有三条贯通地表的断层:震中西侧约17 km附近近SN向的乳山断裂,震中东北侧约20 km附近近SN向的米山断裂,震中南侧约32 km附近海域中NE向的千里岩断裂北段(图 2).但台网定位结果显示,乳山序列具有近NW向地震展布方向,与该区域及附近已知的三条断裂均不太吻合.
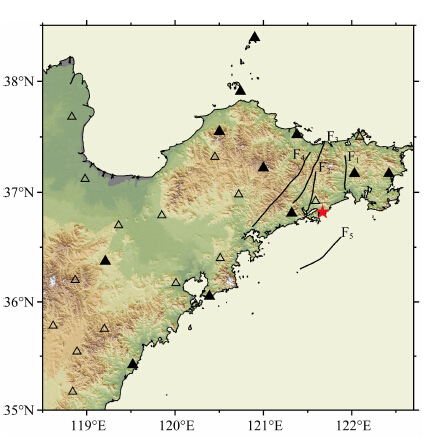 | 图 2 乳山序列发生位置(★)和台站分布
F1 米山断裂,F2 乳山断裂,F3海阳断裂,F4 朱吴断裂,F5 千 里岩断裂北段,Δ参与精确定位的台站,▲参与精确定位及 震源机制反演的台站.Fig. 2 Epicenters of the Rushan earthquake sequence and seismic stations F1 Mishan fault,F2 Rushan fault,F3 Haiyang fault,F4 Zhuwu fault,F5 Qianliyan fault,Δ denotes the stations for precise relocation,▲ denotes the stations for precise relocation and focal mechanism inversion |
因而,研究乳山地震序列震源破裂性质及可能的发震构造以及与已知断层之间的关系,对理解乳山地震发生机理具有一定的参考意义.鉴于此,本文拟采用结合波形互相关技术的双差定位方法对2013—2014年山东乳山地震序列进行重新定位,通过CAP(Cut and Paste)方法反演4.2、4.0级地震震源机制,使用P波初动方法计算ML3.0以上地震震源机制;在此基础上,结合区域构造环境,重点探讨地震序列的发震构造和震源性质.
2 资料与求解过程2.1 双差定位地震精定位在地震序列研究中具有重要的意义,高精度的定位结果能更准确地刻画断层在地壳深部的展布形态,有助于震源破裂面的确定.区域台网一般使用绝对定位方法确定地震三要素(Geiger,1912),该方法通过各个台站的到时计算震源位置,由于计算走时的速度模型本身存在误差,每个台站的到时数据精度都会直接影响地震定位的结果(Waldhauser and Ellsworth,2000).相对定位方法能有效减小速度结构误差的影响,比较成熟的有主事件定位法和双差定位法等.在主事件定位方法中(Spence,1980;周仕勇等,1999),每个事件都相对于主事件重新定位,对主事件地震的震源位置和发震时刻要求精度较高,并且该方法限制了可重新定位地震从的最大空间范围.Waldhauser和Ellsworth(2000)提出的双差定位方法对较大空间范围内发生的地震同时进行重新定位,不需设定主地震事件,所有地震事件是相对于地震事件丛集的质心,或者是地震事件的初始位置,在一定程度上避免了对主事件定位方法的条件限制,而且波形互相关技术可以使震相相对到时更加精确,利用组对地震确定地震的相对位置,在很大程度上消除了介质横向不均匀造成的路径效应,从而获得较高精度的相对空间位置分布.
山东省“十一五”测震台网数字化改造以来,数字测震台站达到127个,乳山地震序列发生位置位于乳山市白沙滩附近海域(图 2),其东侧、南侧没有测震台站,周围台站平均间距约50 km.选取震中距小于300 km、能够尽最大范围包围震中位置的台站参与定位,共计27个台站(图 2).选取震相记录清晰且至少有4个台记录的可定位地震,根据Pg,Sg,Pn,Sn的时距曲线,剔除有明显错误或者误差较大的震相数据,设置邻居所需最小震相对数目为8,事件对使用最小震相对数目为8,仅考虑序列中“强连接”的地震事件,经筛选符合条件的地震为306次.对台站观测到的上述地震进行时间域波形互相关,由于S波震相识别干扰因素较多,相关性不够理想,本文仅考虑使用P波数据,滤波范围1~10 Hz,相关系数阈值设为0.7.经预处理形成“强连接”事件对为1916对,P波震相对9268,S波震相对9252,P波互相关数据64749对.由于S波到时拾取精度相对P波略低,定位过程中将P波权重赋予1.0,S波权重赋予0.5.双差定位虽然对速度模型的依赖性相对较小,但由于算法中采用了水平分层速度模型,震源所在层的速度值会对定位结果产生影响,该值虽不影响事件间的方位分布,但会影响事件簇分布图像的尺度,因而仍需尽可能地选用接近真实的地壳速度模型,参考利用层析成像技术得到的胶东半岛及渤海湾盆地地壳速度模型(张岭等,2005;李霞等,2012)及crust2.0,确定本文速度模型如表 1所列.考虑到乳山地震序列最大地震震级及台网初步的定位范围,设定事件对之间的最大搜索距离为5 km,以台网定位目录的位置作为地震定位初始值,采用共轭梯度法求解方程,通过反复迭代,舍去残差大于阈值的震相数据,直至得到稳定的解.
| 表 1 地壳速度模型Table 1 Crustal velocity model |
地震震源机制直观反映了地震破裂的几何及运 动学特征,对研究地震活动与地质构造之间的关系及地震孕震机理的解释具有重要作用.地震震源机制的求解中,P波初动法是最常用的方法,P波初动法要求在球面投影中存在大量离散、均匀的台站.然而对于乳山地震,东侧、南侧面临海域,台站分布对该次地震包围效果相对较差.相比P波初动方法,CAP反演方法(Zhu and Helmberger,1996)可靠性、准确性更高一些.CAP方法反演的可靠性实验表明,在地质构造较复杂地区使用简单速度模型仍可获得不错的反演结果(郑勇等,2009;洪德全,2013). 另外,CAP方法通过不同深度震源机制解的拟合误差,找寻最佳深度,因而在震源机制反演的同时,可同时得到最佳的深度反演结果(韦生吉等,2009;韩立波,2012;李圣强等,2013;曲均浩等,2014).
本文采用了CAP方法中 P波初动和波形拟合联合反演的算法,以精确定位的位置和发震时刻作为CAP方法计算的参考数据.根据波形记录质量和P波初动方向的清晰度,删除零漂过大、缺数等有明显错误的台站记录,筛选出宽频带的HAY、WED、RCH、LOK、CHD、YTA、BHC、LZH、QID、ANQ、RZH等11个相对包围震中较好的台站(图 2),震中距主要集中在30~250 km.基于表 1中速度模型,将原始的速度记录扣除仪器响应、积分到位移,再将位移记录从UD-NS-EW分量旋转成Z-R-T分量,分成Pnl(P波及其后续震相)和Snl(S波或面 波)两部分,分别进行0.04~0.2 Hz和0.02~0.1 Hz 的4阶Butterworth带通滤波器压制噪声处理.根据Pnl和Snl部分的波形特点,设置两者相对权重为2 ∶ 1,充分利用两者的振幅比对震源深度及机制解做更好的约束.理论计算图采用频率-波数法(F-K方法)(Zhu and Helmberger,1996),根据传播矩阵计算地震的位移场分布,得到各种频率下的体波、面波波形.经上述处理,得到每个台Pnl部分的垂向分量、径向分量和Snl部分的三个方向分量.
3 结果与讨论3.1 乳山序列精确定位结果乳山地震序列306个地震经双差法重新定位后,得到277个地震的基本参数.图 3给出山东台网定位结果(图 3a)与本文精确定位结果(图 3b、3c)的对比,重新定位后地震分布更为集中.其中2014年 1月7日4.2级地震精确定位后震中位置为36.81°N,121.70°E,震源深度5.5 km,山东台网定位结果为36.82°N,121.67°E,震源深度7 km,精确定位前后震中位置相差约3.5 km;4月4日4.0级地震精确定 位后震中位置为36.84°N,121.69°E,震源深度5.4 km,山东台网定位结果为36.83°N,121.67°E,震源深度5 km,精确定位前后震中位置相差约2.5 km. 由图 3b、3c可见,序列地震呈近NW方向的线性分布,整个序列在长轴AB方向延展约35 km,垂直AB方向地震分布宽约5 km.在地震密集分布的 AE段(图 3c),地震密集分布在8 km×3 km范围内.
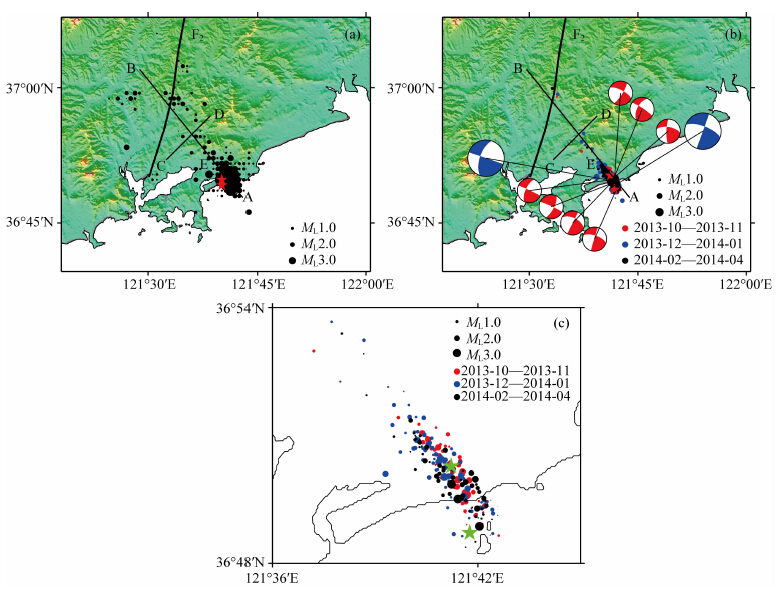 | 图 3 乳山序列精定位与台网结果对比图
(a)台网定位结果;(b)精确定位结果;(c)精确定位地震密集分布区(图 3b的AE段). 实心圆为序列地震震中位置,五角星为4.2、4.0级地震位置,蓝色震源球为4.2、4.0级地震震源机制,红色震源球为ML3.0~3.9地震的震源机制,F2为乳山断裂.Fig. 3 Comparison plot between precise relocation results and network results (a)The network result;(b)The relocation result;(c)The dense area of relocation. The filled circles denote epicenters of earthquake sequence,The stars denote the epicenters of 4.2、4.0,The blue beach balls denote the focal mechanism of 4.2、4.0,The red beach balls denote the focal mechanism of earthquake with the magnitude range ML3.0~3.9. |
对4.2、4.0级地震采用P波初动方向和波形拟合联合反演的算法反演震源机制,图 4是乳山4.2级地震震源机制随不同震源深度的变化,纵轴为该理论模拟波形与实际观测波形的最小二乘拟合残差.每个深度反演得到的震源机制的两个节面参数基本相同,反演结果稳定.根据拟合残差,震源矩心深度在6 km时,震源机制解反演方差达到极小值,该深度与4.2级地震精确定位深度5.5 km较为接近.由于RCH台SH分量、ANQ台PV分量波形相关系数较低,尝试不断调整滤波频率,拟合效果仍然较差,实际反演过程删除此两个分量.
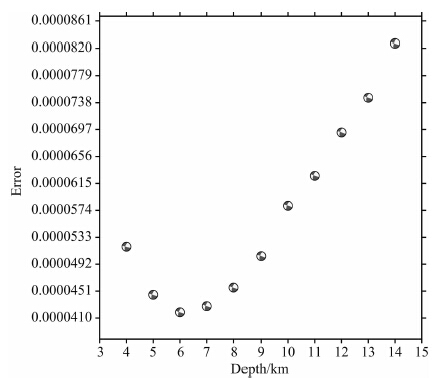 | 图 4 1月7日4.2级地震CAP反演拟合残差与震源机制随深度的变化Fig. 4 Error plots as a function of focal depth |
以1月7日4.2级地震为例,图 5给出6 km深度处理论合成波形与实测波形的拟合情况,8个台站记录的40个震相中,相关系数大于0.7的震相有38个,约占95%;相关系数大于0.8的有34个,约 占85%,总体上理论地震图与观测地震图拟合较好,反演结果可信,反演方差为4.17×10⁻⁵.该深度对应的双力偶解为最佳震源机制解,其结果为:矩震级Mw4.3,节面Ⅰ走向290°、倾角90°、滑动角23°,节面Ⅱ走向200°、倾角67°、滑动角180°.
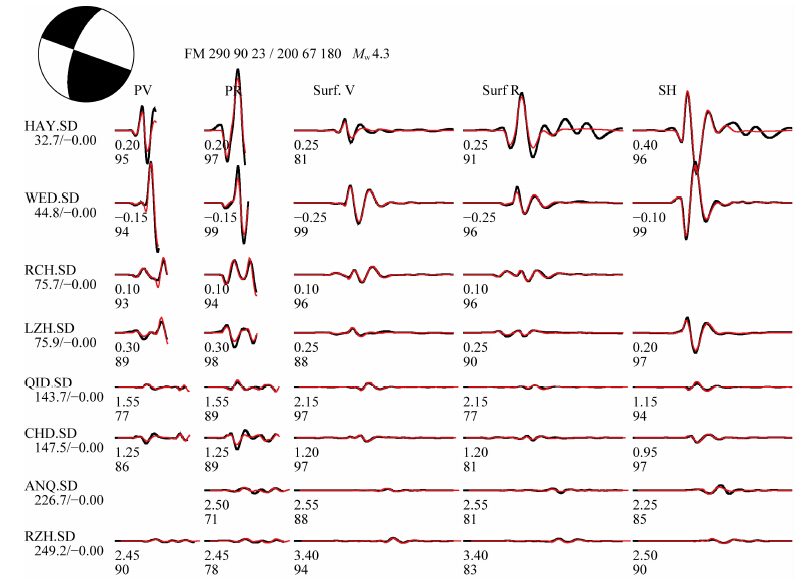 | 图 5 1月7日4.2级地震CAP方法反演的震源机制解、理论地震图和观测地震图对比
红线是理论地震图,黑线是观测地震图;波形下第1行数字为理论地震图相对观测地震图的移动时间/s,第2行数字为二者的相关系数/%.Fig. 5 Focal mechanism and comparison between the synthetic and the observed seismograms The red curves are theoretical seismograms,and the black curves are observation seismograms; the numbers below the waveform curves are the time shifts(first line) and cross-correlation coefficient in percent(second line). |
对9次ML3.0以上地震采用P波初动方法计 算其震源机制(表 2,图 3b),结果显示9个地震节面位置基本一致,倾角较大,近水平滑动.与CAP方法反演的4.2、4.0级地震震源机制解结果大致相同.
| 表 2 乳山序列较大地震震源机制解Table 2 Focal mechanisms of stronger earthquakes |
根据震级与破裂长度统计关系式(Wells and Coppersmith,1994;蒋海昆等,2007),乳山4.2、4.0级 地震破裂长度不足1 km,大大小于序列地震密集分布区域的尺度,因而,整个乳山序列的地震活动,可能是同一条规模不大的构造的整体性活动所致.着重对地震密集分布区域(图 3b、3c)进行分析,剖面分析显示,A-B剖面地震密集区域长度约为 8 km,C-D剖面地震密集区域宽度约为3 km(图 6).
图 3c中红色、蓝色、黑色分别代表地震发生的时间段,可以看出地震分布区域随时间变化不明显,在整个断层面上均有分布,但震级相对较大的地震主要集中在东南段.整个地震序列震源深度集中在4~10 km,优势深度分布为4~7 km(图 6),表明地震的主体破裂发生在上地壳浅表部位.
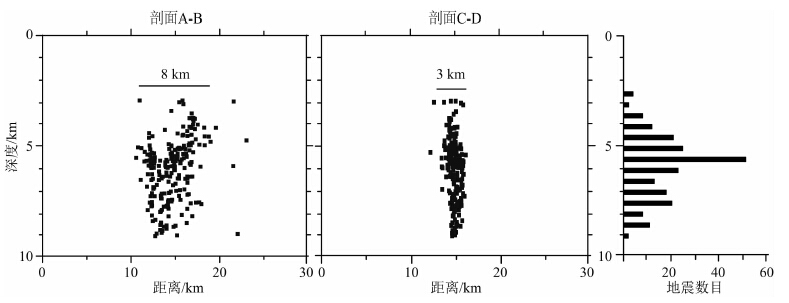 | 图 6 沿A-B、C-D剖面的震源深度分布及地震数目Fig. 6 Profile of focal depth alone A-B,C-D cross-section |
对比序列地震空间分布图像与序列较大地震震源机制(图 3c,表 2),可见较大地震震源机制NW向 节面与地震序列分布长轴方向较为吻合.图 6给出序列地震分布A-B及C-D剖面,C-D剖面地震密集区域震源深度分布近直立,与4.2、4.0级地震震源机制解节面Ⅰ倾角约90°及ML3.0~3.9范围内地震震源机制解倾角较大结果基本一致.据此综合分析认为,乳山地震序列发震断层走向NW,倾向NE,近直立,水平滑动为主,结合区域应力场分析可能为左旋走滑型断层.
乳山序列位于胶南造山带北段的威海断隆区,NE-NNE方向断裂是带内最为发育的一组断裂,断层条数多、密度大,与沂沭断裂带共同构成倒人字型格局(宋明春和王来明,2000).距离乳山序列最近的有三条断层(图 2),震中西侧的乳山断裂为走向10°,倾角75°~85°,为第四纪中更新世的正断层;震中东侧的米山断裂为近南北向,倾角53°~60°,为第四纪中更新世的左旋逆断 层;震中南侧的千里岩断裂北段为北东向,倾角60°~80°,为第四纪早、中更新世的正断层.米山断裂和千里岩断裂与乳山序列距离相对较远,其断层几何特征与乳山序列地震分布及其较大地震震源机制亦不吻合,不可能是乳山序列的发震断层.乳山断裂横穿整个地震序列(图 3b),但其产状、性质与CAP计算结果及精确定位后序列展布方向亦无法吻合,乳山断裂也不可能是乳山序列的发震断裂,但此次序列与乳山断裂相交汇的区域地震分布较为零乱(图 3b),有可能是乳山断裂与隐伏断裂交汇区域相互作用的结果.
根据野外实地勘察及遥感、岩石资料,乳山地区的金矿集中区受区内一级镶嵌构造控制,主要有近NS和NW方向构造带交织组成(贺振等,2006).NS发育了青虎山—唐家沟断裂、巫山断裂、三甲断裂、将军石—曲河庄、葛口断裂、老虎窝—合子断裂等;NW划分为四个构造条带,金牛山—金青顶构造带、冯家—马台石构造带、午极—三甲构造带、海阳所—乳山构造带,这些NW方向的地质单元界线多为隐伏断裂或 者隐性界线,比如巫山—中寨隐伏断裂走向为300°~340°,与本文计算的精确定位结果的优势分布方向、乳山地震序列震源机制解节面Ⅰ走向基本一致.从乳山金矿带构造分区研究结果来看,区域内NNE和NNW向断裂是主体成矿断裂(李旭芬等,2013),且这些断层的演化过程均是在同一应力场、不同应力状态下产生的一个完整构造集合(谢春林,2004).因而,上述推测NW向隐伏断裂为乳山地震的发震构造有其构造上的合理性.
4 结论1)经双差定位法对乳山序列306个地震精确定位后,获得277个地震基本参数.整个地震序列呈现NW方向优势展布,尤其是4.2、4.0级地震震中附近NW方向线性程度较高,地震密集分布区域长约8 km、宽约3 km的范围.整个地震序列深度集中在4~10 km,其中优势深度为4~7 km,地震的主体破裂发生在上地壳.
2)利用CAP方法反演乳山4.2、4.0级地震震源机制解,在震源矩心深度6 km附近对应的双力偶解为最佳震源机制解.ML3.0~3.9范围地震震源机制解与4.2、4.0级地震结果基本一致.与序列地震展布图像相比较,序列较大地震震源机制解的节面Ⅰ与乳山序列地震分布长轴方向较为吻合.
3)综合序列精确定位结果及较大地震震源机制解,初步推测乳山地震序列发震断层为走向NW、倾向NE、近直立(倾角较大)的走滑型(滑动角较小)隐伏断裂.
4)如前所述自1970年有较为完备的仪器记录以来,乳山及附近区域从未发生过频次如此之高的地震序列,是什么原因导致在以往从未见活动的NW向隐伏断裂上发生此次乳山序列并持续活动,仍是一个需继续深入探讨的问题.
致谢 姜金钟博士、宋金博士、李霞、李冬梅等在程序运行、方法计算方面对本文提供帮助,王冬雷、许洪泰,杜桂林、杨玉永等在乳山地质构造、断层解译等方面给予帮助,韩立波博士、王长在及两位匿名审 稿人对本文提出宝贵的修改意见,在此一并表示谢意!
| [1] | Geiger L. 1912. Probability method for the determination of earthquake epicenters from arrival time only. Bull. St. Louis. Univ., 8(1): 60-71. |
| [2] | Han L B, Jiang C S, Bao F. 2012. Source parameter determination of 2010 Taikang Ms4.6 earthquake sequences. Chinese J. Geophys. (in Chinese), 2012, 55(9): 2973-2981, doi: 10.6038/j.issn.00015733.2012.09.016. |
| [3] | He Z, Yu Z P, Zhang X R. 2006. Structural division characteristics and ore-prospecting. Journal of Northwest University (Natural Science Edition) (in Chinese), 36(6): 992-995. |
| [4] | Hong D Q, Wang X Z, Ni H Y, et al. 2013. Focal mechanism and focal depth of July 20, 2012 JiangSu Gaoyou Ms4.9 earthquake. Progress in Geophysics (in Chinese), 28(4): 1757-1765, doi: 10.6038/pg20130416. |
| [5] | Jiang H K, Zheng J C, Wu Q, et al. 2007. Statistical features of aftershock distribution size for moderate and large earthquakes in Chinese mainland. Acta Seismologica Sinica (in Chinese), 29(2): 151-164. |
| [6] | Li S Q, Chen Q F, Zhao L, et al. 2013. Anomalous focal mechanism of the May 2011 Mw5.7 deep earthquake in Northeastern China: regional waveform inversion and possible mechanism. Chinese J.Geophys. (in Chinese), 2013, 56(9): 2959-2970, doi: 10.6038/cjg20130910. |
| [7] | Li X, Liu X Q, Li Y J, et al. 2012. Relocation of earthquakes in Shandong and its neighboring areas in China and relationship between their tectonics. Earthquake Research in China (in Chinese), 28(4): 381-392. |
| [8] | Li X F, Liu J C, Zhang X R, et al. 2013. Structural features and metallogenic prognosis of Muping-Rushan Goldore belt. Gold Science and Technology (in Chinese), 21(3): 10-15. |
| [9] | Qu J H, Liu R F, Li J, et al. 2014. Inversion of the focal mechanisms of the 2014 M4.2 and M4.0 earthquakes in Rushan, Shandong using the CAP method. China Earthquake Engineering Journal (in Chinese), 36(4): 1076-1080. |
| [10] | Song M C, Wang W L. 2000. The latest understandings of fundamental geology of Jiaonan orogenic belt. Regional Geology of China (in Chinese), 2000, 19(1): 1-6. |
| [11] | Spence W. 1980. Relative epicenter determination using P-wave arrival-time differences. Bull. Seism. Soc. Am., 70(1): 171-183. |
| [12] | Waldhauser F, Ellsworth W L. 2000. A double-difference earthquake location algorithm: method and application to the northern Hayward fault, California. Bull. Seism. Soc. Am., 90(6): 1353-1368. |
| [13] | Wei S J, Ni S D, Chong J J, et al. 2009. The 16 august 2003 Chifeng earthquake: Is it a lower crust earthquake?. Chinese Journal of Geophysics (in Chinese), 52(1): 111-119. |
| [14] | Wells D L, Coppersmith K J. 1994. New empirical relationships among magnitude, rupture length, rupture width, rupture area, and surface displacement. Bull. Seism. Soc. Am., 84(4): 974-1002. |
| [15] | Xie C L. 2004. Discussion of ore-formation and prospecting direction of gold deposits in Shandong Rushan (in Chinese). Xi'an: Chang'an University. |
| [16] | Zhang L, Liu J S, Zheng T Y. 2005. Inverse crustal P-wave velocity model of Bohai bay basin and its adjacent area by using messy GA with Ground-Truth data. Progress in Geophysics (in Chinese), 20(1): 186-197. |
| [17] | Zheng Y, Ma H S, Lü J, et al. 2009.Source mechanism of strong aftershock of (MS≥5.6) of 2008/05/12 Wenchuan earthquake and the implication for seismotectonic. Science in China Series D: Earth Science (in Chinese), 2009, 52(6):739-753. |
| [18] | Zhou S Y, Xu Z H, Han J, et al. 1999. Analysis on the Master Event Method and Precise Location of the 1997 Jiashi Strong Earthquake Swarm of Western China. Acta Seismologica Sinica (in Chinese), 21(3): 258-265. |
| [19] | Zhu L P, Helmberger D V. 1996. Advancement in source estimation techniques using broadband regional seismograms. Bull. Seism. Soc. Am., 86(5): 1634-1641. |
| [20] | 韩立波, 蒋长胜, 包丰. 2012. 2010年河南太康Ms4.6地震序列震源参数的精确确定. 地球物理学报, 55(9): 2973-2981, doi: 10.6038/j.issn.00015733.2012.09.016. |
| [21] | 贺振, 于在平, 张学仁. 2006. 牟乳金矿带构造分区特征及找矿意义. 西北大学学报(自然科学版), 36(6): 992-995. |
| [22] | 洪德全, 王行舟, 倪红玉等. 2013. 多种方法研究2012年7月20日江苏高邮Ms4.9级地震震源机制解和震源深度. 地球物理学进展, 28(4): 1757-1765, doi: 10.6038/pg20130416. |
| [23] | 蒋海昆, 郑建常, 吴琼等. 2007. 中国大陆中强以上地震余震分布尺度的统计特征. 地震学报, 2007, 29(2): 151-164. |
| [24] | 李圣强, 陈祺福, 赵里等. 2013. 2011年5月中国东北Mw5.7深震的非同寻常震源机制: 区域波形反演与成因探讨. 地球物理学报, 56(9): 2959-2970, doi: 10.6038/cjg20130910. |
| [25] | 李霞, 刘希强, 李亚军等. 2012. 山东及邻区地震的重新定位及其与活动构造的关系. 中国地震, 28(4): 381-392. |
| [26] | 李旭芬, 刘建朝, 张学仁等. 2013. 牟平—乳山金矿带构造特征及成矿预测. 黄金科学技术, 21(3): 10-15. |
| [27] | 曲均浩, 刘瑞峰, 李金等. 2014. CAP方法反演2014年山东乳山M4.2、M4.0地震震源机制解. 地震工程 学报, 36(4): 1076-1080. |
| [28] | 宋明春, 王来明. 2000. 对胶南造山带基础地质问题的新认识. 中国区域地质, 2000, 19(1): 1-6. |
| [29] | 韦生吉, 倪四道, 崇加军等. 2009. 2003年8月16日赤峰地震: 一个可能发生在下地壳的地震?. 地球物理学报, 52(1): 111-119. |
| [30] | 谢春林. 2004. 山东乳山地区金矿床成矿信息研究与找矿方向探讨[硕士论文]. 西安: 长安大学. |
| [31] | 张岭, 刘劲松, 郑天珧. 2005. 利用Ground-Truth资料和Messy GA方法反演渤海湾盆地及其邻区地壳P 波速度模型. 地球物理学进展, 20(1): 186-197. |
| [32] | 郑勇, 马宏生, 吕坚等. 2009. 汶川地震强余震(Ms≥5.6)的震源机制解及其与发震构造的关系. 中国科学D辑: 地球科学, 39(4): 413-426. |
| [33] | 周仕勇, 许忠淮, 韩京等. 1999. 主地震定位法分析以及1997年新疆伽师强震群高精度定位. 地震学报, 21(3): 258-265. |
 2015, Vol. 58


