 2015, Vol. 58


To investigate the annual variation, the data from DMSP were separated by two manners. In the first manner, the data were separated into three 4-month long seasonal bins: Spring-Autumn (March, April, September and October), the northern summer (May to August) and the northern winter (January, February, November, December). According to the second manner, the data were separated into twelve a-month-long bins. In order to confine our attention to quiet conditions, the observations taken during periods of high magnetic activity marked by Kp>3 were removed from the data set. Then, to get the longitudinal structure of Ni in the region with different dips, the data were binned for every 10 degrees in longitude into 36 geographical longitude bins and for every 5 degrees in dip. The bins were all 30 degrees wide in the zone and 4 degrees wide in the meridian. Finally, for each bin the mean values of Ni were calculated. The method of Fourier harmonic-wave decomposition was used to extract the harmonic-waves with the different wave numbers from the complex longitudinal variations of Ni, and the method of Fourier reconstruction was used to fit the measured data.
By using the DMSP data and Fourier analysis, we quantitatively investigated the multiple wave number's features in the longitudinal variety of the topside ionospheric Ni. The results show that the longitudinal variety of the topside ionospheric Ni reconstructed by Fourier series with 0-order to 6-order harmonic waves is very consistent with the longitudinal variety from the measured data. Further, we analyzed the WN-4's annual variation, year-to-year variation, the distinction in different local times and the variation with dips. Main results include: (1) The Ni's longitudinal variety contains the WN-0 and the WN-1 to WN-4 mainly in the topside ionosphere, which have different amplitudes and phases. (2) The WN-4 in the dip equator is most intense in spring and autumn, very weak in winter which is similar to the annual variation of non-migrating tides. (3) The WN-4 is more intense when the level of solar activity is higher and the former is weaker when the latter is lower. (4) The WN-4 in spring and autumn and the northern summer is most intense at the dusk, weaker after the sunset and the morning, and the weakest at the dawn, while it is the most intense in winter after sunset relative to other local times. (5) The WN-4 during the dusk has strong dependence on the dip: the double peak pattern occurs in spring and autumn, the flat top pattern appears in the northern summer and the obvious asymmetry pattern is present between two hemispheres in northern winter.
This study provides a new view of the longitudinal variety of the topside ionospheric Ni. It is found that the harmonic-wave components with the different wave numbers simultaneously exist in the longitudinal variety of the topside ionospheric Ni. The year-to-year variation of the amplitude of the WN-4 reveals the notable positive correlation with the year-to-year variation of F10.7 index. The results are valuable for understanding the feature of the longitudinal variety of the topside ionosphere and its modeling.
最近人们注意到,电离层与中低层大气的耦合导致电离层参量在经度方向出现显著的波状结构,即电离层参量随经度变化呈现峰谷相间的图样.较早,基于IMAGE-FUV观测结果的分析,Sagawa等(2005)发现,正比于F层电子密度平方根的135.6 nm 气晖发射强度在4个彼此相隔约90°的经度上增强,即经度波数4图样.随后,一系列研究证实电离层经度波数4的存在(Henderson et al.,2005; Engl and et al.,2006;Immel et al.,2006; Wan et al.,2008).Sagawa等人(2005)提出,源于较低大气的非迁移潮汐可能是电离层F区波数4的激发因素.一般认为,非迁移潮汐在电离层E区生成经度调制的东向电场,它沿磁力线映射到F层,引起赤道异常区电离层的波数4图样(Immel et al.,2006;Hagan et al.,2007;Kil et al.,2007).
顶部电离层连接等离子体层,是电离层的重要组成部分.在电离层底部,光化学过程起主要的控制作用,在F2层峰高度上下,光化学过程和输运过程共同起控制作用,在顶部电离层,输运过程起主要的控制作用.此外,不同于底部电离层,顶部电离层对太阳活动性的依赖更显著,太阳活动低年Ni比太阳活动高年小很多(Liu et al.,2007a,2007b; Liu et al.,2011).因此,电离层的属性明显地随高度变化.近年来,有许多作者研究了顶部电离层密度、温度和漂移速度等参量的经度变化(Su et al.,1996; Venkatraman and Heelis,1999; Hartman and Heelis,2007; Ren et al.,2008,2009; Huang et al.,2010;Kakinami et al.,2011).Hartman和Heelis(2007)利用DMSP-F15太阳活动高年上午的观测数据,研究了倾角赤道区顶部电离层离子垂直漂移的经度变化,发现波数4分量在整年都存在,春秋分最强.Ren等(2008)分析了DMSP-F13卫星采集的离子密度和电子温度数据,发现日落期间赤道区顶部电离层离子密度和电子温度经度结构的变化显著依赖季节,两分季显示波数4图样,北半球夏季呈现3峰结构,北半球冬季呈现2峰结构.Huang等(2010)分析DMSP-F13和F17的离子密度和漂移速度数据,指出赤道电离层离子密度的经度变化显示与离子东向漂移速度同相关联,与离子向上漂移速度反相关联.Kil等(2008)利用ROCSAT-1、TIMED-GUVI和DMSP-F13和F15等多颗卫星的观测数据,研究顶部电离层的波结构,结果表明,波结构在午前出现,下午进一步增强,在黄昏开始减小,延伸范围可达840 km以上.Kakinami等(2011)研究了日间顶部电离层电子密度和温度的经度结构并做了谱分析,结果表明,电子密度的经度结构可以在任何太阳活动水平下出现,密度和温度两者的波数3在12月最强,波数4在9月最强.Bankov等(2009)分析了DMSP-F13和F15以及DEMETER卫星的观测数据,结果表明,在卫星覆盖的所有地方时,波数4是氧离子密度中几乎常规的特征,存在于黄昏直至午夜前,氢离子和氧离子具有相同的经度结构.Lin等人(2007)的研究表明,波数4具有明显的周日变化,下午(1200—1600LT)最为显著.Wan等(2010)发现波数4的振幅随着太阳活动的减弱而增大.利用TOPEX/海神高度计长期测量的总电子含量(TEC)数据,Scherliess等(2008)发现白天生成的波数4图样有明显的季节变化,但很大程度上不依赖太阳活动水平.穆文峰等(2011)发现WN-3,WN-4的变化分别与DE2,DE3中纬向风分量的变化一致,而与其子午风分量没有明显的联系.一般认为,波数4是出现在磁赤道和低纬度区的现象,波数4随磁纬或倾角的变化研究很少.
Forbes等(2008)提出,依年和一年中的时间,多种潮汐波模的组合可能生成电离层经度变化中的波-1、波-2、波-3、波-4、波-5和波-6分量.Engl and等人(2009)发现了电离层F区存在强的波-3图样.一般情况下,电离层参量的经度变化经常是多种波数和周期成分的叠加,图像复杂.已有些作者采用了傅 里叶滤波和谱分析技术(Wan et al.,2010; Kakinami et al.,2011),从复杂的经度变化中分离出特定波数的分量
本文利用1995—2005年DMSP-F13和2000—2005年F15卫星的离子密度测量数据和傅里叶分解与重构方法,定量地分析了顶部电离层电离密度经度结构中多重波数分量的特征.在此基础上,分析波数4的年变化、逐年变化、地方时差异和随倾角的变化.本文的研究对顶部电离层建模有一定的参考价值.
2 数据与处理方法本文的工作使用了DMSP-F13卫星1995—2005年以及DMSP-15卫星2000—2005年采集的数据.DMSP是美国国防气象卫星计划(Defense Meteorological Satellites Program)的缩写.DMSP卫星在近太阳同步轨道上飞行,轨道倾角约96°,轨道高度约840 km,轨道周期约101 min,每天由南向北(升轨)和由北向南(降轨)分别在固定的地方时(F13约为18 LT和06 LT,F15约为21 LT和09 LT)经过赤道面.
DMSP卫星携带一种专用的离子、电子和闪烁 传感器(Special Sensor-Ions,Electrons and Scintillation,SSIES)载荷,用于监测顶部电离层热等离子体的行为属性.离子总密度用星载朗缪尔探针测量.数据具有4 s的时间分辨率,由美国德克萨斯大学达拉斯校区因特网(http://cindispace.Utdallas.edu/DMSP/)下载.
本文仅分析地磁平静期顶部电离层Ni经度变化的特征,为此,在所有数据中,我们剔除了磁扰动期(Kp>3)采集的数据.轨道高度上每个数据点对应的地理位置用地理经度和倾角表征,倾角利用当前的国际地磁参考场(IGRF)模型计算得到.为了考察赤道区和中低纬度区Ni的经度变化特征,我们选用所有经度上倾角从-60°至60°(相当于倾角磁纬约±40°)的数据.与Ren等人(2008)的做法类似,数据用以下方式进行网格化处理以得到每个网格中心的平均离子密度:网格的中心倾角和中心经度间隔分别为5°和10°,南北向网格宽4°,东西向宽30°.计算每个网格内所有的或每年的有效Ni数据的算术平均,代表该网格上Ni.需要指出,本文所用网格尺度得到的Ni均值,可能平滑小尺度的经度结构,使其幅度变小,也可减弱电离层不规则体产生的影响.不过,大尺度的经度结构能基本真实地重现.此外,本文用了11年的DMSP-F13和6年DMSP-F15的数据,不同年份Ni值散布范围很大,取同一季节多年数据的平均,只能得到Ni经度变化的平均图像,无法看到它随太阳活动周期变化的细节.
本文用两种方式考察Ni均值的经度变化对季节的依赖.首先,把1年分成3个季节,每个季节4个月,分别代表春秋季(3月、4月、9月和10月),北半球夏季(5至8月)和北半球冬季(1月、2月、11月和12月).第二种方式是按每年12个月把数据分成12组.
3 结果 3.1 Ni经度变化与傅里叶重构利用第2节介绍的方法处理了1995—2005年共11年DMSP-F13卫星的总离子密度观测数据,得到每个网格点上Ni的均值.图 1给出日落期间(约18 LT)3个季节顶部电离层平均Ni随经度和倾角变化的等值线图.
 | 图 1 黄昏时刻3个季节平静期顶部电离层
平均Ni随经度和倾角变化的等值线
上图:春秋季;中图:北半球夏季;下图:北半球冬季. 图中点线表示倾角赤道上偏角随经度的变化.Fig. 1 Contours of the variation of average Ni with longitude and dip in the topside ionosphere at three seasons at the dusk during geomagnetic quiet period The top figure is for the spring and autumn; the middle figure is for the northern summer; the bottom figure is for the northern winter. |
从图 1可以看到,在倾角-60°至60°(倾角磁纬约±40°)的区域,日落期间顶部电离层Ni随经度变化呈现有规律的起伏,在倾角赤道附近,Ni的值达到极大,随经度的变化也最为显著.在3个季节,这种经度变化的特征各不相同.在倾角赤道及其邻近区域,春秋季Ni随经度变化呈现4个极大,分别位于10°E、110°E、200°E和280°E附近;北半球夏季 Ni随经度变化呈现3个极大,分别位于10°E、110°E、和220°E 附近;北半球冬季Ni随经度变化呈现2个极大,分别位于110°E和330°E附近.由图还可看到,在东半球的大部分区域,不同季节Ni的经度结构变化不大,110°E附近的极大在3个季节都存在;而在西半球,不同季节Ni的经度结构有很大差别.在倾角赤道和低纬区,春秋季在200°E和270°E附近出现两个极大,在北半球夏季,这两个极大合并为220°E附近的一个极大,而在北半球冬季,夏季出现极大的220°E附近出现极小.
图 1中偏角随经度的变化(点线)显示,在东半球,磁偏角接近于零,变化很小,而在西半球,磁偏角变化很大,从较大的正值变为较大的负值.西半球磁偏角由正到负的变化可能引起冬夏Ni的经度结构的差异.此前,Ren等(2008)分析倾角赤道上空顶部电离层的经度变化,发现西半球夏季和冬季Ni的经度变化显示明显反相关,他们认为偏角随经度的变化和子午风的季节变化将改变倾角赤道上场列等离子体输运速度,进而影响Ni的经度分布.不过,只要进出倾角赤道的场列等离子体数通量不变,场列等离子体输运速度大小的变化并不能直接影响Ni的经度分布.对给定的磁通量管,沿场流进倾角赤道区的离子体数通量超过流出倾角赤道区的离子体数通量,将导致Ni增高,反之将导致Ni降低.可以推测,西半球夏季和冬季Ni的经度变化趋势相反,可能与冬夏季沿磁通量管流进和流出倾角赤道的等离子体数通量不同有关.
如图 1所示,在所有季节,Ni随经度的变化都不是由单一波数构成,而是多种波数成分的叠加.假定Ni随经度的变化可以分解为具有不同波数的谐波,那么,对每个固定的倾角Ii,可以用N阶傅里叶级数重构Ni.傅里叶重构表达式为
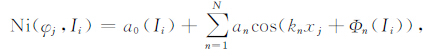
图 2是黄昏时刻(18 LT)3个季节测量的Ni均值与6阶傅里叶重构的Ni随经度变化的比较.由图 2可见,对给定的倾角,傅里叶重构曲线(图中的实线)与实测的Ni均值随经度的变化(图中的符号‘+’)几乎完全重合.这表明顶部电离层平均Ni的经度变化确实含有多重波数的谐波,可以用波数0至波数6的傅里叶谐波相当精确地重构.在各阶系数中,a0最大,表明Ni经度变化中经度平均Ni是主要成分.在倾角赤道上,春秋季、北半球夏季和冬季,a0分别为20.5×10¹⁰ m-3、9.7×10¹⁰ m-3和16.6×10¹⁰ m-3.实际上,5阶和6阶谐波分量的幅度远小于1至4阶分量.高阶傅里叶系数很小也可能与本文采用的网格尺度有关,它平滑小尺度的经度结构,使其幅度变小.
 | 图 2 测量的Ni与6阶傅里叶重构的Ni随经度的变化比较 左中右3列分别代表春秋季、北半球夏季和冬季,上中下3行分别代表北半球、倾角赤道和南半球. 图中记号‘+’表示实测值,实线是傅里叶重构值.Fig. 2 The comparison of longitudinal variations of observed Ni and the Fourier reconstructed Ni The columns from left to right represent spring and autumn, northern summer and northern winter, the rows from top to bottom represent the northern hemisphere, the dip equator and southern hemisphere. The symbols of ‘+’ represent observations and the solid lines represent Fourier construction value. |
图 3是日落期间3个季节倾角赤道上空顶部电离层Ni经度变化中的波数1至波数4分量.图中各阶谐波由测量数据的傅里叶分解得到,纵坐标表示波数1至波数4的幅度.
 | 图 3 春秋季(实线)、北半球夏季(点线)和冬季(虚线)日落期间倾角赤道上空顶部电离层Ni波数1(a)、波数2(b)、波数3(c)和波数4(d)分量 Fig. 3 The Ni′s components of WN-1(a), WN-2(b), WN-3(c) and WN-4(d) in the dip equator at dusk, represented by solid line (spring and autumn), dot line (northern summer), dash line (northern winter) |
如图 3所示,波数1和波数2分量在冬季最强,幅度分别达到2.4×10¹⁰ m-3和2.8×10¹⁰ m-3,与经度平均值相比,相对幅度分别约为14%和17%,夏季幅度为1.6×10¹⁰ m-3,相对幅度约为16%,春秋 季最弱,幅度为1.1×10¹⁰ m-3,相对幅度约为5%;波数1和波数2分量夏季和冬季接近反向,春秋季相位介于夏季和冬季之间.波数3分量在春秋季、夏季和冬季幅度分别为1.0×10¹⁰ m-3、1.6×10¹⁰ m-3和1.1×10¹⁰ m-3,相对幅度分别约为5%、16%和7%,夏季最大;波数3的相位夏季滞后于冬季,春秋季滞后于夏季.在春秋季和夏季,波数4分量的幅度分别为1.4×10¹⁰ m-3和1.1×10¹⁰ m-3,相对幅度分别约为7%和11%,由于北半球夏季经度平均的Ni不及春秋季的一半,夏季相对变幅比春秋季高;冬季幅度非常弱,仅为0.3×10¹⁰ m-3,春秋季和夏季波数4分量基本同相.此外,波数1、波数2和波数4分量在夏季和冬季接近反向,而波数3在3个季节相位差很小.
Ren等(2008)曾研究了日落赤道顶部电离层中的离子总密度和电子温度的经度变化,发现离子总密度和电子温度的经度变化显著依赖季节,在两分季呈现波数4经度结构,在北半球夏季呈现3峰结构,在北半球冬季呈现2峰结构.图 3证实了Ren等(2008)的结果并进一步得到,在每个季节都存在波数1至波数4分量,春秋季和夏季波数4较强,冬季波数4很弱.此外还注意到,波数1、波数2和波数4在夏季和冬季接近反向,而波数3在3个季节相位差很小.一般认为,非迁移潮汐在电离层E区生成经度调制的东向电场,它沿磁力线映射到F层,引起赤道异常区电离层的经度变化(Immel et al.,2006;Hagan et al.,2007;Kil et al.,2007).另一方面,子午风和纬圈风的经度变化以及偏角随经度的变化,将调制电离层的经度变化.经度结构的上述复杂的变化可能是这些因素共同作用的结果.
图 3表明,Ni的经度变化是包括波数1至波数4在内的多重波数分量的叠加.下面,我们将主要分析波数4的变化特征.
3.2 赤道区波数4的年变化和逐年变化我们按每年12个月把1995年至2005年DMSP-F13的数据分成12组,用第2节介绍的方法得到平均Ni随经度的变化.然后通过傅里叶分解得到波数4分量.图 4是18 LT倾角赤道和低纬区Ni的波数4幅度随月份的变化.
 | 图 4 日落期间倾角赤道和低纬区顶部电离层Ni波数4幅度随月份的变化 Fig. 4 The month-to-month variation of Ni′s WN-4 in the dip equator and low latitudes at dusk in the topside ionosphere |
如图 4所示,在日落地方时,Ni波数4分量随月份的变化在全年有两个极大,第一个极大出现在北半球春分前后的3月,第二个极大出现在北半球秋分前后的9月.倾角赤道上,在2月份波数4分量达到了全年最低值,9月份达到最高值.在北半球倾角30°,冬季(12月)波数4分量达到了全年最低值,在南半球倾角-30°,当地冬季(6月份)波数4分量达到了全年最低值.总体上看,南北半球低纬区Ni波数4分量的年变化特征与倾角赤道类似,即春秋季最强,冬季最弱,夏季居中,与非迁移潮汐的季节变化类似(Wan et al.,2010).此前,一些作者研究了波数4分量的季节变化.Hartman和Heelis(2007)研究得到,太阳活动高年上午倾角赤道区顶 部电离层离子垂直漂移的经度变化中,波数4分量在整年都存在,两分月份最强.Wan等(2008)发现 波数4在北半球的夏季和早秋很强,而在冬季相当弱.Kakinami等(2011)研究得到波数4在9月最强.图 4显示的特征与前人的研究结果基本一致.
图 5是日落期间倾角赤道上空3个季节和不分季节的顶部电离层Ni波数4分量幅度的逐年变化及其与F10.7指数的逐年变化比较.图 5用DMSP-F13在日落地方时的观测数据分析得到.
 | 图 5 倾角赤道上空顶部电离层Ni波数4分量幅度的逐年变化(a)和全年平均与分季节平均F10.7指数的逐年变化(b) 图中 ● 代表整年,符号+代表春秋季, ★ 代表夏季, ▲ 代表冬季. Fig. 5 Fig.5 Year-to-year variations of the WM-4 amplitude of the topside ionospheric Ni at dip equator (a) and F10.7 (b) The symbols ● , +, ★ and ▲ represent whole year, spring autumn, northern summer and northern winter, respectively. |
如图 5所示,分季节与不分季节的情况大致相同,Ni经度变化中的波数4分量的幅度都随太阳活动水平增强而增高,至太阳活动高年幅度达到最高,随后随太阳活动水平降低而减小.波数4分量幅度的逐年变化与年平均F10.7的变化趋势基本一致.计算得到,全年以及春秋季、北半球夏季和冬季波数4分量的幅度与F10.7的相关系数分别为0.96,0.99,0.99和0.85,呈显著正相关.实际上,日落期间在整个低纬区(倾角±30°之间),顶部电离层Ni经度变化中的波数4幅度的逐年变化图像与图 5类似.Wan等(2010)分析了2003—2008年的全球TEC数据,发现波数4的振幅随着太阳活动减弱而增大.图 5表明,赤道和低纬顶部电离层Ni经度变化中的波数4幅度对太阳活动水平的依赖似乎与从TEC数据中分离出的波数4幅度对太阳活动水平的依赖不同.
3.3 赤道区波数4随地方时的变化DMSP-F13卫星在约18 LT和06 LT飞过赤道面,DMSP-F15卫星在约21 LT和09 LT飞过赤道面.我们用第2节介绍的方法,对4个地方时,分别得到平均Ni随经度的变化,并通过傅里叶分解得到平均Ni的经度变化中的波数4分量.图 6给出3个季节倾角赤道区顶部电离层平均Ni的经度变化中波数4幅度随地方时的变化.
 | 图 6 日落期间倾角赤道上空顶部电离层Ni的经度结构中波数4随地方时的变化 Fig. 6 WN-4 variation with local time in the dip equator at dusk in the topside ionosphere |
如图 6所示,春秋季和北半球夏季,波数4的幅度在黄昏(18 LT)最大,日落后(21 LT)和上午(09 LT)次之,黎明(06 LT)最弱.Kil等(2008)利用 多颗卫星的观测数据,研究顶部电离层等离子体密度和垂直 E × B 漂移的波结构,结果表明波结构在午前出现,下午进一步增强,在黄昏开始减弱.图 6给出的春秋季和北半球夏季波数4的幅度在4个地方时的变化特征与Kil等(2008)的结果相符.冬季波数4在黎明(06 LT)最弱,从上午至夜间,波数4幅度逐渐增大,直至21 LT,仍未看到波数4幅度的减弱.这个特征与春秋季和北半球夏季不同.
图 7给出春秋季、北半球夏季和冬季从上午到晚上的3个地方时波数4的相位变化.如图 7所示,在春秋季和北半球夏季,从上午09 LT经黄昏18 LT到黄昏后21 LT,波数4的相位依次滞后,暗示顶部电离层Ni的经度变化中波数4向东移动.在北半球冬季,白天,从上午09 LT到黄昏18 LT相位滞后,表明向东移动,日落后,18 LT到21 LT,相位超前,表明向西移动.此前,Wan等(2008)分析TEC中的波数4时,发现波数4图样向东移动.Ren等(2009)也发现,白天大多数月份,垂直 E × B 漂移中的波数4主要向东移动.图 7中春秋季和夏季给出的图样与Wan等(2008)和Ren等(2009)得到的结果一致,不过,冬季白天和日落后显示不同的移动方向,需要进一步验证.
 | 图 7 春秋季、北半球夏季和冬季3个地方时波数4的相位变化 Fig. 7 WN-4 variation in phase in three seasons and three local times |
分析表明,顶部电离层Ni的经度变化中波数4分量的幅度显著依赖倾角.图 8给出日落期间春秋季、北半球夏季和冬季顶部电离层Ni波数4幅度随倾角的变化.
 | 图 8 日落期间春秋季(a)、北半球夏季(b)和冬季(c)顶部电离层Ni波数4幅度随倾角的变化 Fig. 8 The variation of WN-4 amplitudes with dip at dusk during spring and autumn (a), northern summer (b) and northern winter (c) |
从图 8可以看到,日落时期的波数4分量对倾角依赖的特征具有明显的季节差异.在春秋季,波数4分量随倾角变化呈现双峰结构,在倾角±18°(倾角磁纬约±9°)附近,南北半球的波数4幅度达到极大.南半球的峰略高于北半球的峰,幅值分别为2.2×10¹⁰ m-3和1.9×10¹⁰ m-3.在倾角赤道附近形成了一个谷区,幅值最低为1.4×10¹⁰ m-3.在两个峰以外的区域,随倾角的增高,波数4分量的幅度先迅速减小,然后稳定在很低的水平.在夏季,波数4幅度随倾角的变化呈现平顶样单峰结构,较高的值所在的范围从倾角约-10°到20°(倾角磁纬约-5°到10°),在此区间内,波数4幅度保持平稳的较高值,在这个区间之外,随倾角的增高,波数4分量的幅度先迅速减小,然后稳定在很低的水平.在北半球冬季,波数4幅度随倾角变化的主要特征是南北半球显著不对称.在南半球倾角-26°(倾角磁纬约-14°)附近出现一个单峰,幅值为0.9×10¹⁰ m-3,在南半球倾角-8°附近,波数4幅度非常小,接近于0,再往北,一直保持较低的值.春秋季Ni波数4幅度随倾角的变化在形态上与电离赤道异常非常类似,暗示引起电离赤道异常的赤道等离子体喷泉效应可能是春秋季Ni波数4幅度随倾角变化的一种控制因素.
4 结论
本文基于DMSP-F13卫星1995—2005年以及DMSP-15卫星2000—2005年采集的数据,利用傅里叶分解与重构方法,定量地分析了顶部电离层电离密度经度结构中多重波数分量的特征.在此基础上,分析了Ni波数4分量的年变化、逐年变化、地方时差异以及对倾角的依赖.主要结果如下:
(1)顶部电离层Ni的经度结构中同时存在显著的波数1至波数4分量,它们的幅度和相位各不相同.
(2)倾角赤道区波数4分量在北半球秋季最强,北半球春季次之,北半球夏季高于冬季,表现出与非迁移潮汐类似的季节变化.
(3)波数4分量的幅度随太阳活动水平增强(降低)而增高(减小),与年平均F10.7指数的变化趋势基本一致.
(4)春秋季和北半球夏季波数4分量在傍晚最强,晚上和上午次之,黎明最弱,北半球冬季日落后最强.
(5)日落期间Ni波数4分量的强度依赖倾角,春秋季随倾角的变化呈双峰结构,与电离赤道异常形态类似,北半球夏季呈平顶样结构,北半球冬季南北半球显著不对称.
本文主要分析了顶部电离层电离密度经度结构中多重波数分量的形态学特征.对引起顶部电离层电离密度经度结构中多重波数分量复杂变化的物理机制,还有待于进一步的研究.
| [1] | Bankov L, Heelis R, Parrot M, et al. 2009. WN4 effect on longitudinal distribution of different ion species in the topside ionosphere at low latitudes by means of DEMETER, DMSP-F13 and DMSP-F15 data. Ann. Geophys., 27(7): 2893-2902. |
| [2] | England S L, Immel T J, Sagawa E, et al. 2006. Effect of atmospheric tides on the morphology of the quiet time, postsunset equatorial ionospheric anomaly. J. Geophys. Res, 111, A10S19, doi: 10.1029/2006JA011795. |
| [3] | England S L, Zhang X L, Immel T J, et al. 2009. The effect of non-migrating tides on the morphology of the equatorial ionospheric anomaly: seasonal variability. Earth, Planets and Space, 61(4): 493-503. |
| [4] | Forbes J M, Zhang X, Palo S, et al. 2008. Tidal variability in the ionospheric dynamo region. J. Geophys. Res, 113, A02310, doi: 10.1029/2007JA012737. |
| [5] | Hagan M E, Maute A, Roble R G, et al. 2007. Connections between deep tropical clouds and the Earth's ionosphere. Geophys. Res. Lett, 34(20), doi: 10.1029/2007GL030142 |
| [6] | Hartman W A, Heelis R A. 2007. Longitudinal variations in the equatorial vertical drift in the topside ionosphere. J. Geophys. Res, 112, A03305, doi: 10.1029/2006JA011773. |
| [7] | Henderson S B, Swenson C M, Christensen A B, et al. 2005. Morphology of the equatorial anomaly and equatorial plasma bubbles using image subspace analysis of GUVI data. J. Geophys. Res., 110, A11306, doi: 10.1029/2005JA011080. |
| [8] | Huang C S, Rich F J, de La Beaujardiere O, et al. 2010. Longitudinal and seasonal variations of the equatorial ionospheric ion density and eastward drift velocity in the dusk sector. J. Geophys. Res, 115, A02305, doi: 10.1029/2009JA014503. |
| [9] | Immel T J, Sagawa E, England S L, et al. 2006. Control of equatorial ionospheric morphology by atmospheric tides. Geophys. Res. Lett., 33, L15108, doi: 10.1029/2006GL026161. |
| [10] | Kakinami Y, Lin C H, Liu J Y, et al. 2011. Daytime longitudinal structures of electron density and temperature in the topside ionosphere observed by the Hinotori and DEMETER satellites. J. Geophys. Res., 116, A05316, doi: 10.1029/2010JA015632. |
| [11] | Kil H, Oh S J, Kelley M C, et al. 2007. Longitudinal structure of the vertical E×B drift and ion density seen from ROCSAT-1. Geophys. Res. Lett., 34(L14110), doi: 10.1029/2007GL030018. |
| [12] | Kil H, Talaat E R, Oh S J, et al. 2008. Wave structures of the plasma density and vertical E(B drift in low-latitude F region. J. Geophys. Res., 113, A09312, doi: 10.1029/2008JA013106. |
| [13] | Lin C H, Hsiao C C, Liu J Y, et al. 2007. Longitudinal structure of the equatorial ionosphere: time evolution of the four-peaked EIA structure. J. Geophys. Res., 112, A12305, doi: 10.1029/2007JA012455. |
| [14] | Liu L B, Wan W X, Yue X A, et al. 2007a. The dependence of plasma density in the topside ionosphere on the solar activity level. Ann. Geophys., 25(6): 1337-1343. |
| [15] | Liu L B, Zhao B Q, Wan W X, et al. 2007b. Yearly variations of global plasma densities in the topside ionosphere at middle and low latitudes. J. Geophys. Res., 112, A07303, doi: 10.1029/2007JA012283. |
| [16] | Liu L B, Wan W X, Chen Y D, et al. 2011. Solar activity effects of the ionosphere: A brief review. Chinese Science Bulletin, 56(12): 1202-1211, doi: 10.1007/s11434-010-4226-9. |
| [17] | Mu W F, Wan W X, Ren Z P, et al. 2010. Correlation between the ionospheric longitudinal harmonic components and the upper atmospheric tides. Chinese Science Bulletin, 55(35): 4037-4045, doi: 10.1007/s11434-010-4205-1. |
| [18] | Ren Z P, Wan W X, Liu L B, et al. 2008. Longitudinal variations of electron temperature and total ion density in the sunset equatorial topside ionosphere. Geophys. Res. Lett., 35, L05108, doi: 10.. |
| [19] | Ren Z P, Wan W X, Liu L B, et al. 2009. Intra-annual variation of wavenumber-4 structure of vertical E×B drifts in the equatorial ionosphere seen from ROCSAT-1. J. Geophys. Res., 114, A05308, doi: 10.1029/2009JA014060. |
| [20] | Sagawa E, Immel T J, Frey H U, et al. 2005. Longitudinal structure of the equatorial anomaly in the nighttime ionosphere observed by IMAGE/FUV. J. Geophys. Res., 110, A11302, doi: 10.1029/2004JA010848. |
| [21] | Scherliess L, Thompson D C, Schunk R W, et al. 2008. Longitudinal variability of low latitude total electron content: Tidal influences. J. Geophys. Res., 113, A01311, doi: 10.1029/2007JA012480. |
| [22] | Su Y Z, Oyama K I, Bailey G J, et al. 1996. Longitudinal variations of the topside ionosphere at low latitudes: Satellite measurements and mathematical modelings. J. Geophys. Res., 101(A8): 17191-17205, doi: 10.1029/96JA01315. |
| [23] | Venkatraman S, Heelis R. 1999. Longitudinal and seasonal variations in nighttime plasma temperatures in the equatorial topside ionosphere during solar maximum. J. Geophys. Res., 104(A2): 2603-2611, doi: 29/1998JA900109. |
| [24] | Wan W X, Liu L B, Pi X, et al. 2008. Wavenumber-4 patterns of the total electron content over the low latitude ionosphere. Geophys. Res. Lett., 35, L12104, doi: 10.1029/2008GL033755. |
| [25] | Wan W X, Xiong J, Ren Z P, et al. 2010. Correlation between the ionospheric WN4 signature and the upper atmospheric DE3 tide. J. Geophys. Res., 115, A11303, doi: 10.1029/2010JA015527. |
| [26] | 穆文峰, 万卫星, 任志鹏等. 2011. 电离层经度变化波数谱成分与高层大气潮汐模的相关性. 科学通报, 56(1): 35-43. |