2. 中国科学技术大学地震学与地球内部物理实验室, 合肥 230026;
3. 蒙城地球物理国家野外科学观测研究站, 合肥 230026
2. Laboratory of Seismology and Physics of Earth's Interior, University of Science and Technology of China, Hefei 230026, China;
3. Mengcheng National Geophysical Observatory, Hefei 230026, China
We use the 3D non-staggered boundary-fitted grid finite difference method to simulate the wave propagation with topography. The curved free surface condition is applied by the Traction Mirror method. Our wave-speed model comes from CRUST1.0. The elevation data is GTOPO30, and the finite fault model is provided by USGS. The grid size is 500 m×500 m, and time step is 0.012 s. The highest frequency in our simulation is about 0.35 Hz.
Our simulated wave field shows: (1)The eastern part from the epicenter has a stronger wave field than the western part, which is controlled by the Doppler effect of unilateral finite fault. (2) The wave field is enhanced in the mountain between two basins. (3) Wave fields in the southern plain are stronger, and have more high frequency components than those in the northern mountain.
We get seismic intensity map from the horizontal Peek Ground Velocity (PGV-h). The highest seismic intensity zone is distributed along mountains in southeast direction, which is controlled mainly by the finite unilateral rupture source and topography. The highest intensity reaches IX. The plain in the south also appears to be of high seismic intensity due to the low velocity sediments and source radiation pattern. The seismic intensity in basins and west of the fault are relatively low.
We compare our simulated Peek Ground Velocity (PGV) with records from 4 observational stations. Of these, 2 stations located in the southern plain are well consistent with the observation; the station located in the eastern basin is generally consistent and the station located in the west is mismatched. The reasons for these differences include : (1) The low resolution finite fault model lacks high frequency features beyond the unilateral rupture. (2) Low resolution wave-speed model and topography data are used. (3) Our cluster cannot meet the need for simulating wave field with frequency higher than 0.35 Hz. And (4) the lack of station site response.
With the three-dimensional velocity model, topography data and preliminary kinematic source model from USGS, we simulate the seismic wave field of the Nepal earthquake by using the 3D curved grids finite-difference method, and further calculate the distribution of seismic intensity. Most of the results are generally consistent with the observed PGV. The result shows that the high seismic intensity zone trends in southeast direction. The highest intensity reaches IX. The plain in the south also appears to be high seismic intensity due to the low velocity sediment and source radiation pattern. The seismic intensity in basins and west of the fault are relatively low.
北京时间2015年4月25日14点11分,尼泊尔发生强烈地震.USGS测定震源位置为(28.147°N,84.708°E),位于首都加德满都西北77 km处,并给出了震源运动学初步反演结果,显示震源深度为15 km,走向295°,倾角10°,Mw7.9(USGS,2015),地震震级较大,引发多处滑坡、冰崩雪崩,造成了重大人员财产损失(新华网, 2015a,b).我们利用曲线网格有限差分方法(Zhang and Chen, 2006; Zhang et al., 2012)模拟了尼泊尔地震的USGS震源破裂过程所产生的地震波场传播过程,计算了强地面运动并给出烈度分布图和地表震害分布.这些结果可以为地震救援、灾后恢复重建提供一定的参考. 2 模型和方法
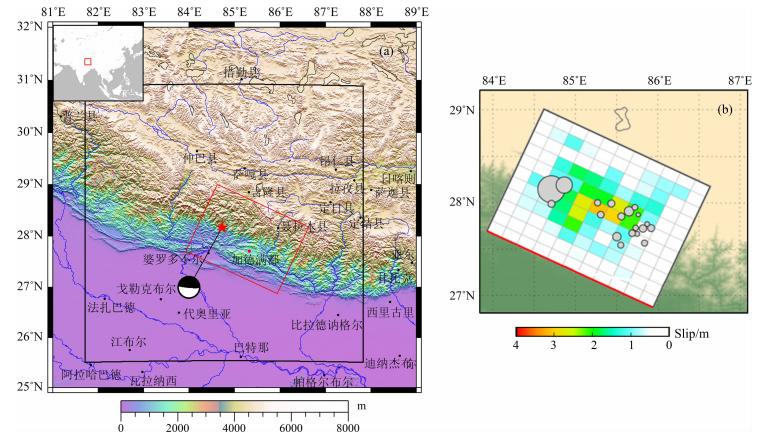
图 1a显示了本文模拟区域及其地貌情况:其中黑色方框内为实际模拟区域,红色方框为断层在水平地表投影,红五角星处为震源位置,震源机制解取 自CMT(http://www.globalcmt.org/),为逆冲型地震.整个计算区域尺度为:水平600 km×600 km,深度为60 km.
 | 图 1 (a)模拟计算区域以及周边地形图;(b)震源运动学模型(摘自USGS,2015) Fig.1 (a)Map showing simulation region and topography surroundings; (b)Preliminary kinematic source model(From USGS,2015) |
尼泊尔地震发生后,USGS给出震源运动学反演结果(USGS,2015),如图 1b所示. 该震源模型显示本次地震发生在220 km×160 km断层面上,断层面走向295°,倾角10°,震源深度15 km.地震起始后主要向东南方向破裂,在东南方向40~100 km处形成L状峰值滑动分布,最大滑移量在4 m左右,L型破裂短边正好在两震源南侧两盆地之间山脉下方,在盆地下方破裂不明显,同时在断层面东北角和西北角有一定的滑移量分布,破裂前锋传播等时线和最终滑移量分布均呈现出明显的单边破裂特征.
本模拟选用的速度模型为CRUST1.0(Laske et al., 2013).该地震发生地区地形地貌极其复杂,对强地面运动影响强烈(Zhang et al., 2008; Lee et al., 2008).本模拟选用GTOPO30地形数据(Gesch et al., 1999),水平分辨率约1 km.由图 1a可见震源区域地表起伏剧烈复杂,从印度—尼泊尔边界附近最低海拔100~300 m,向北数十公里即出现海拔5000~7000 m山峰,分布有盆地、河谷等.为准确计算模拟地表强地面运动,我们采用曲线网格有限差分方法(Zhang and Chen, 2006; Zhang et al., 2012),利用贴体网格拟合地表起伏,通过牵引力镜像方法处理非平面自由地表效应,计算网格尺度为500 m×500 m,计算时间步长为0.012 s. 3 强地面运动模拟结果
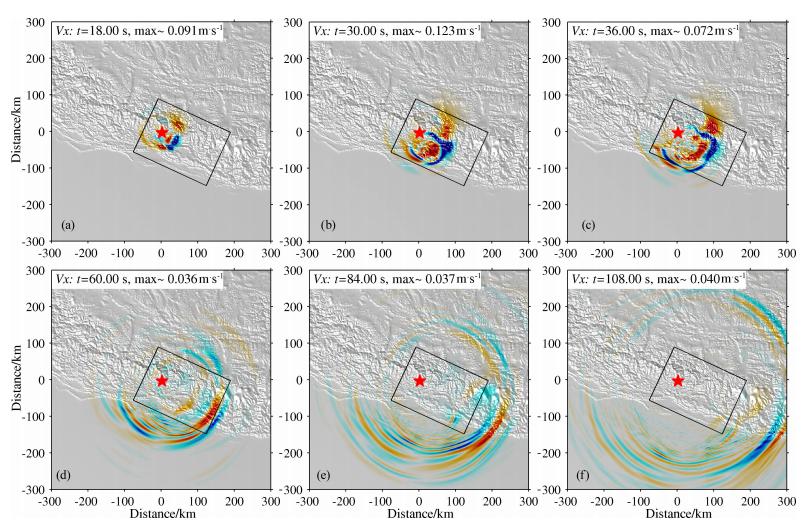
图 2给出了尼泊尔地震模拟结果中地表的Vx分量快照.红色五角星为震源地表投影,黑色方框为发震断层在地表投影.地震发生18 s后,可以在破裂传播方向上(即震源东侧)看到清晰波形,破裂方向的反方向(即震源西侧)波形很弱,单侧破裂的多普勒效应开始显现,并且在模拟结果中一直保持.在震后30 s,除多普勒效应更加清晰外,还可以看到在震源南侧、两盆地之间区域波场强度相对较大.在震后36 s,可以看到波场扫过震源东南侧加德满都所在盆地.在后续三张波场快照中,对比南侧平原和北侧山地之间波场,可以明显看出震源南侧平原地区波场高频成分更多,振幅更大.
 | 图 2 尼泊尔地震模拟速度波场快照 Fig. 2 Snapshots of simulated velocity field of the Nepal earthquake |
根据模拟计算得到的水平峰值速度(PGV-h),参照《中国地震烈度表(GB/T 17742-2008)》,计算得到的尼泊尔地震烈度分布,模拟显示该地震最大地震烈度约为IX,具体烈度分布参见图 3.可以看出,高烈度区域分布呈现以下特征:
 | 图 3 尼泊尔地震模拟烈度 Fig. 3 Simulated intensity map of the Nepal earthquake |
(1)最大烈度分布于震源南—东南侧近场山脉,到达盆地内部后烈度降低.
(2)在震源南侧山脚前平原地区出现大面积高烈度区域.
(3)在震源东北侧出现一北东—南西分布高烈度区域.
(4)震源西侧烈度相对东侧明显偏低.
造成上述特征原因分别分析如下:
(1)最大烈度分布由滑移量分布和地形影响叠加造成.震源南—东南侧近场山脉于主要滑移量L型分布的短边前端,同时该处破裂前锋传播迅速,并且和附近破裂传播方向大体呈45°,处于S波辐射范围内,具有形成高烈度区域的条件;由于破裂在加德满都所在盆地迅速停止,形成的停止震相与其他波场叠加,加大烈度;山脉处于两盆地之间,部分波场会在山脉中多次反射汇聚叠加,也会增强烈度.
(2)南侧山脚前侧平原地区处于破裂区域S波辐射范围内,同时山前盆地具有地表沉积层,低速的沉积层会加大地表烈度.
(3)在震源东北侧出现一北东—南西分布高烈度区域处于主要破裂区域S波辐射方向内;地震倾角较小,上盘效应明显,会加大烈度.
(4)震源具有强烈的单侧破裂特征,形成多普勒效应,震源西侧为破裂传播方向后方,烈度相对东侧偏低.
USGS网站给出多个台站的PGV、地表峰值加速度(PGA)观测数据(USGS,2015),现选取位于本文模拟区域内的四个PGV观测结果用黑色三角形标于图 3.其中A、B两个台站分别位于震源西、东南方,另外两个相邻台站C、D位于震源南方平原上,模拟观测结果对比见表 1.A台站观测得到的PGV明显小于B台站观测PGV,C、D台站在一定震中距外依然可以观测到较高烈度,观测烈度的整体空间分布模式和模拟结果多数吻合.另外C、D两台站观测PGV和模拟结果略有偏差但基本吻合,进一步说明本模拟结果具有一定可信性.但是A、B两台站观测结果偏差较大,同时模拟结果整体小于观测PGV.造成偏差的可能原因如下:
|
|
表 1 台站观测和模拟PGV对比 Table 1 Comparison between observed and calculated PGV |
(1)震源的远场运动学反演结果分辨率受限,缺失高频信息.已有前人(Zhang et al., 2008)指出:不同的震源模型,在其他计算条件不变的情况下,既可以明显的影响PGV结果.本模拟选定的震源模型整体上近似为单边破裂,所以对破裂传播方向后方的高烈度产生支持不充分.这可能是A台站模拟PGV小的主要原因.
(2)模拟区域地质构造复杂,变化剧烈,本文选用的CRUST1.0速度模型和GTOPO30高程模型水平方向分辨率分别约为110 km和1 km,无法准确描绘实际介质.Lee 等(2008)曾指出,对比仅存在地形情况,同时考虑地形和盆地低速结构可能会造成PGA翻倍.在本模拟中,B台站处于加德满都所在盆地内部,而该盆地结构无法在所选用的速度模型内充分描述,从而造成模拟烈度偏小;与之对应的是,震源南侧C、D两台站处于平原上,介质模型可以较好的描述实际介质,所以这两台站模拟和观测PGV基本可比.
(3)受限于上述低分辨率基本模型,以及计算资源限制,本文所模拟的地震波场频率较低(约3 s),不含有高频成分,因此所获得的烈度偏低.
(4)观测台站具体情况不确定,例如台站处地形和地下介质结构.Zhang 等(2008)曾指出:起伏地形既可能加强也可能减弱强地面运动,可能是C、D两台站之间观测结果存在一定差异的原因. 4 初步结论
基于尼泊尔地震运动学震源模型,选用震源附近区域已知的三维速度模型和地形数据,通过曲线网格有限差分计算了该地震的近场地震波传播过程,得到了理论地震烈度分布.模拟结果表明:本次地震烈度受震源和地形影响,分布复杂,最大烈度分布于震源南—东南侧近场山脉,最大烈度为IX,在震源南侧山脚前侧平原地区和震源东北侧出现北东—南西方向出现高烈度区域,盆地内部和震源西侧烈度相对较低.与观测结果对比,大体吻合.通过模拟结果得到盆地对地震烈度分布的具有重要影响,需要进一步研究.
| [1] | Gesch D B, Verdin K L, Greenlee S K. 1999. New land surface digital elevation model covers the earth. Eos, Transactions, American Geophysical Union, 80(6): 69-70. |
| [2] | Laske G, Masters G, Ma Z T, et al. 2013. Update on CRUST1.0-A 1-degree global model of earth's crust. Geophys. Res. Abstracts, 15, Abstract EGU2013-2658, 2013. |
| [3] | Lee S J, Chen H W, Huang B S. 2008. Simulations of strong ground motion and 3D amplification effect in the Taipei Basin by using a composite grid finite-difference method. Bull. Seismol. Soc. Am., 98(3): 1229-1242. |
| [4] | USGS. 2015. 《M7.8-34 km ESE of Lamjung, Nepal》. http://www.earthquake.usgs.gov/earthquakes/eventpage/us20002926 general_summary[2015-04-29]. |
| [5] | Xinhuanet. 2015a. 《The death in the Nepal Earthquake reached 4262》. http://news.xinhuanet.com/world/2015-04/28/c_1115115199.htm[2015-04-28]. |
| [6] | Xinhuanet. 2015b. 《Avalanches occurred on Everest Mountain in The Nepal Earthquake, nobody hurt on the north slope》, http://news.xinhuanet.com/2015-04/25/c_127733203.htm[2015-24-25]. |
| [7] | Zhang W, Chen X F. 2006. Traction image method for irregular free surface boundaries in finite difference seismic wave simulation. Geophys. J. Int., 167(1): 337-353. |
| [8] | Zhang W, Shen Y, Chen X F. 2008. Numerical simulation of strong ground motion for the Ms8.0 Wenchuan earthquake of 12 May 2008. Science in China Series D: Earth Science, 51(12): 1673-1682. |
| [9] | Zhang W, Zhang Z G, Chen X F. 2012. Three-dimensional elastic wave numerical modelling in the presence of surface topography by a collocated-rid finite-difference method on curvilinear grids. Geophys. J. Int., 190(1): 358-378. |
| [10] | 新华网. 2015a.《尼泊尔强震死亡人数升至4262人》, http:∥news.xinhuanet.com/world/2015-04/28/c_1115115199.htm[2015-04-28]. |
| [11] | 新华网. 2015b. 《尼泊尔地震致珠穆朗玛峰雪崩 北坡西藏一侧无人员伤亡》,http:∥news.xinhuanet.com/2015-04/25/c_127733203.htm[2015-04-25]. |
 2015, Vol. 58


