2. 中国地震局地球物理研究所, 北京 100081
2. Institute of Geophysics, China Earthquake Administration, Beijing 100081, China
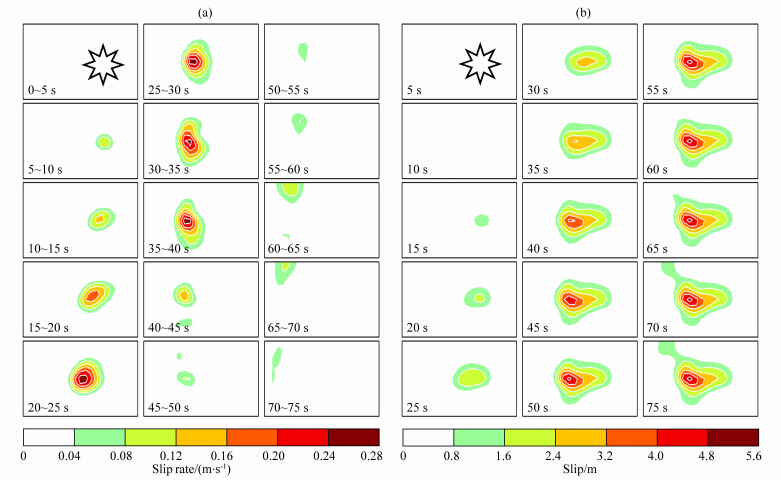
After the fast inversion, we collected more seismic data and a few GPS data (two stations), and carried out a joint inversion of rupture process. The joint model well confirms the major source characteristics, e.g. southeastward rupture propagation, and displays a larger peak slip (about 5.2 m) than that of the fast estimated model (about 2.0 m). The source duration is about 80 s, with the major sub-event occurred at 0~45 s. At 60~70 s, a small-scale sub-event occurs in very shallow depth about 100 km along the strike direction, and may cause a few surface breakages.
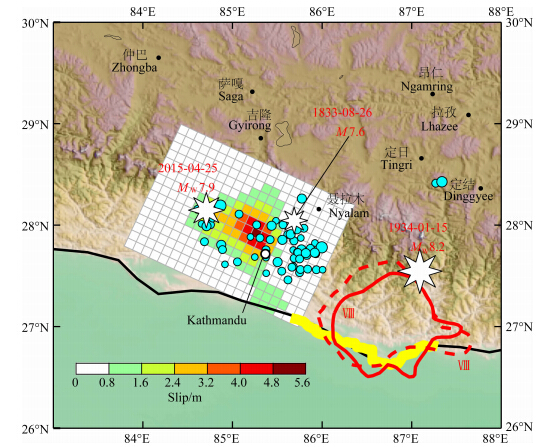
From comparisons with historical large earthquakes, the 2015 Nepal Mw7.9 earthquake ruptured an area, with a dimension of about 100 km, to the west of the 1833 M7.6 earthquake and the 1934 Mw8.2 earthquake. The shallow ruptures are very close to the surface ruptures of the 1934 Mw8.2 earthquake, and the aftershocks are around the macroseismic epicenter of the 1833 M7.6 earthquake. It is highly probable that ruptures of the three earthquakes have connected. From this perspective, the 2015 Nepal earthquake is the result of the westward rupture extensions of the 1833 and 1934 events.
北京时间2015年4月25日14时09分,在临近我国西藏自治区的尼泊尔境内发生了Mw7.9(MS8.1)地震.截至2015年5月4日,地震共造成逾7000余人遇难,1.4万人受伤.此次尼泊尔地震发生在青藏高原南部与印度板块的边界处,位于全球陆地碰撞和垂直变形最剧烈的区域.在此区域,历史上曾经发生过多次大地震(Molnar and Pandey, 1989; Bilham et al., 2001),其中距此次地震最近的是1833年的M7.6地震和1934年的比哈尔邦Mw8.2地震(Bilham et al., 2001; Sapkota et al., 2013).21世纪以来,青藏高原周边也先后发生了多 起灾害性大地震事件,其中2005年克什米尔Mw7.6 地震与2008年汶川Mw7.9地震分别位于青藏高原 西部和东部边缘,导致的死亡或失踪人数都接近9万人,是两次影响非常巨大的地震灾难.2015年尼 泊尔地震是继这两次地震之后,21世纪以来青藏高原周边发生的第三次灾害性大地震事件(Mw>7.5).
尼泊尔地震发生后,作为地震应急快速响应的工作之一,作者获取了远震地震波数据,在震后2小时09分快速确定和发布了此次地震的破裂过程模型.此后,在快速反演工作基础上,采用了全球地震台网(GSN,Global Seismographic Network)震中距90°以内的宽频带地震数据,以及同震位移明显的两个台站的GPS位移数据,对破裂模型进行了更新,并根据反演结果与历史大地震的破裂分布情况,简单定性讨论了此次地震对加德满都附近区域地震活动性和危险性的影响.
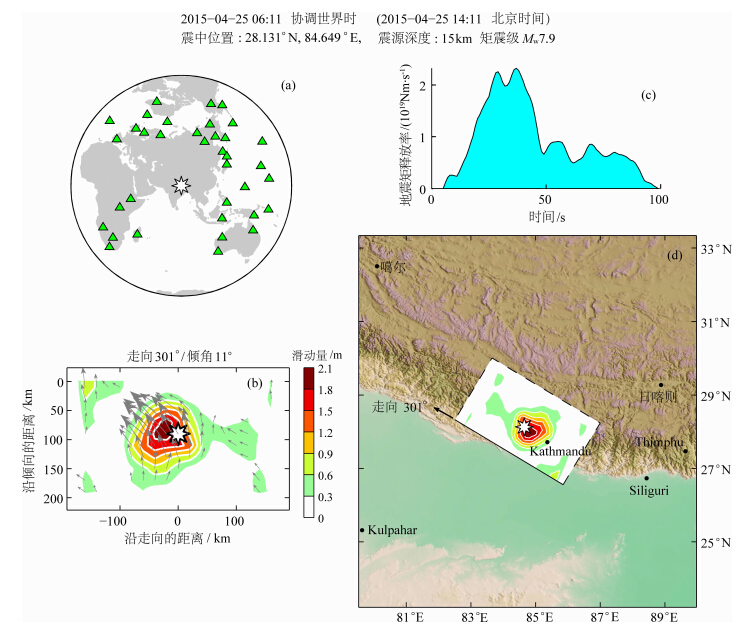
2 破裂过程快速反演快速反演工作采用IRIS(Incorporated Research Institutions for Seismology,美国地震学研究联合会)数据中心提供的GSN远震宽频带地震波形数据,选用了全球范围内震中距介于40°~90°且方位角分布均匀的32个台站的垂直向P波波形(图 1a).基于AK135全球大陆速度结构模型(Kennett et al., 1995),采用Wang(1999)的方法计算得到格林函数.在反演中,我们对数据和格林函数同时进行了0.01~0.1 Hz的带通滤波.采用作者发展的计算效率较高的线性反演方法,快速确定此次地震的破裂过程(Chen and Xu, 2000; Xu et al., 2002; Zhang et al., 2012).在快速反演开始阶段(约震后1小时),只有USGS(United States Geological Survey,美国地质调查局)提供了可供参考震源机制.根据震中区域的地质构造特征,我们采用了USGS发布的震源机制中断层面参数为走向301°/倾角11°/滑动角115°的节面,作为此次地震的发震断层.
 |
图 1 2015年尼泊尔地震快速反演结果 (a)震中与台站位置分布;(b)断层面上静态滑动量分布;(c)震源时间函数;(d)滑动量分布在地面的投影.Fig. 1 Fast inversion results of rupture process of the 2015 Nepal earthquake (a)Epicenter and seismic stations;(b)Static fault slip distribution;(c)Source time function;(d)Surface projection of fault slip distribution. |
破裂过程快速反演得到的矩震级为Mw7.9,断层面上滑动分布相对集中,存在一个主要滑动区域,大部分滑动分布于震中的东南方向(图 1).破裂过程持续近100 s,其中最主要的一次子事件发生在破裂开始后前50 s,50 s以后,后续破裂规模减弱,地震矩释放率的幅度相对较小,断层滑动与破裂进入缓慢愈合阶段.从断层面上滑动分布在地面的投影看,破裂主要朝震中东南方向传播,断层滑动主要发生在震中至加德满都一带.在加德满都附近区域,由于下方断层的错动,以及朝东南方向传播的破裂形成的地震波多普勒聚焦效应,可能导致地震波能量在该地区集中释放,形成较强的震感或破坏.
尽管快速反演工作确定了尼泊尔地震的初步震 源特征,但也存在一些问题.比如,由于破裂面积和滑动量大小之间存在权衡(trade-off)关系,远震地震波单独反演得到的滑动量大小存在较强的不确定性.尤其地,2015年尼泊尔地震是发生在板块边界处一次低倾角的逆冲型地震,由于倾角小、倾向方向延伸范围较大,绝对滑动量与破裂面积之间的权衡相对一般地震更为严重,确定反演滑动量绝对大小面临的不确定性也更强.比如,在对2011年日本东北(Tohoku)Mw9.0地震的研究中,反演远震地震波和陆地GPS同震位移数据得到的最大滑动量约为30 m(Ide et al., 2011;Wang et al., 2013),明显小于反演海底GPS位移和海啸波数据得到的50~60 m的结果(Lay et al., 2011a;Wang et al., 2013).再如,在2010年Mentawai Mw7.8地震的反 演工作中,不同作者得到的最大滑动量可介于3.5~20 m 之间(Lay et al., 2011b;Yue et al., 2014),显示出非常强的不确定性.因此,有必要选用覆盖更好和类型更多的数据,尤其是测量资料的同震位移数据,对破裂模型进行进一步修订.
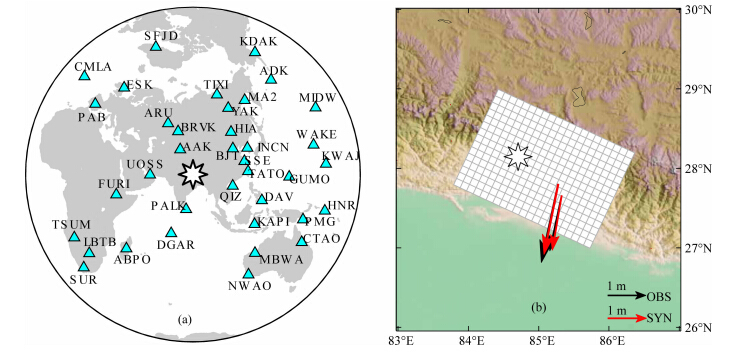
3 破裂过程后续反演为提高台网的空间分辨能力,我们增加了GSN全球台网中震中距更近的资料,并按照10°的方位角和离源角间隔筛选台站,最终得到了37个台站的宽频带P波波形(图 2a).此外,从UNAVCO网站(www.unavco.org)下载获取了2个GPS台站的同震位移数据(图 2b),以更好地约束静态滑动量的绝对大小.
 |
图 2 本研究所用的资料:(a)地震台站;(b)GPS台站以及断层面在地面的投影(b)中黑色箭头为观测GPS位移,红色箭头为根据本文联合反演模型计算得到的合成位移.Fig. 2 Data used in this work:(a)Seismic waveform stations;(b)Two GPS stations Rectangular area in(b)is the surface projection of fault plane. Black arrows are observed displacements, and red arrows are displacements synthesized with the joint rupture model of this work. |
后续反演采用了CRUST2.0(Bassin et al., 2000)给出的震中附近区域的地壳速度结构模型.在较近震中距距离上,存在多种震相混杂的情况.为更好地模拟所有震相波形,我们考虑和计算了每个子断层到每个台站之间的格林函数.对于GPS资料反演,采用Okada(1985)方法计算静态位错的格林函数.地震资料和GPS资料联合反演的技术细节可参考Zhang等(2012).联合反演中,基于资料拟合程度与权重平衡的原则,GPS资料整体权重固定为地震波资料的1/2.震源机制采用USGS更新后的震源机制,选用的断层面参数为:走向295°/倾角11°/滑动角108°.
图 3显示了地震波资料单独反演与联合反演分别确定的震源时间函数与断层面上的静态滑动量分 布.二者得到的矩震级皆约为Mw7.9,与快速反演结果相当;震源时间函数形态也与快速反演结果一致,但最大地震矩释放率略高(图 1c).联合反演得到的静态滑动量分布比地震波单独反演结果更紧凑,滑动分布范围有所缩小,但滑动量幅度增加,最大滑动量由地震波单独反演的3.2 m提高到联合反演的5.2 m.考虑到同震GPS位移对滑动量大小的约束更好,5.2 m的最大滑动量可能更接近实际情况.此外,地震波反演模型显示了较强的右旋走滑分量,且距震中越远,走滑分量越强;而在联合反演中,没有观察到这一现象.但由于本文采用的GPS资料偏少,这一现象还需引入更多数据予以核实.
 |
图 3 (a)地震波反演结果;(b)地震波与GPS联合反演结果 其中上方为震源时间函数,下方为断层面上静态滑动量分布.Fig. 3 (a)Results of seismic data inversion;(b)Results of joint inversion with seismic and GPS data In both(a) and (b),on the top and bottom are the source time functions(STFs) and static fault slip distributions,respectively. |
联合反演得到的时空破裂图像见图 4.滑动速率和滑动量的时空累积图像都显示,破裂从震源处以单侧破裂的形式朝东南方向传播.规模最大的一次子事件发生在破裂开始后0~45 s,位于断层走向方向上的深部区域;45 s以后,滑动速率的强度及其空间分布的整体性都有所减弱,但仍显示了朝东南传播的破裂方向性.60 s左右,在震中东南90~120 km处疑有较小规模的破裂抵达浅部区域.
 |
图 4 断层面上破裂的时空破裂图像 (a)滑动速率时空分布;(b)滑动量时空分布.Fig. 4 Images of spatial-temporal rupture processes on the fault (a)Spatial-temporal distribution of slip-rate on the fault;(b)Spatial-temporal distribution of slip on the fault. |
联合反演模型很好地同时拟合了地震数据(图 5)和GPS数据(图 2b).地震波观测波形与合成波形的平均相关系数约为0.85,其中接近一半的台站(17个台)的相关系数超过了0.9.GPS数据的拟合程度高达99%.由于只有两个台站存在明显的同震位移,数据数量和覆盖范围非常有限,这一拟合程度不能说明更多问题.但这两个台站的引入显著提高了最大滑动量,在一定程度上增强了对破裂强度和分布的有效约束.
 |
图 5 联合反演得到的观测与合成地震图的比较 每个子图的左边从上到下依次为台站名、震相名/分量名、以及观测波形与合成波形之间的相关系数.Fig. 5 Comparison between observed and synthetic seismograms of joint inversionOn the left of each sub-graph from top to bottom are the station code,the phase name/component name, and the correlation coefficient of observed and synthetic waves,respectively. |
本文报道了2015年尼泊尔地震后的破裂过程快速反演工作,以及采用GSN全球台网的宽频带地震波形与目前可用的两个台站的GPS同震位移,联合反演确定的破裂模型.结果显示,采用地震波资料快速反演得到的破裂模型尽管在滑动量绝对大小方 面存在一定的低估,但仍然能够较好地确定地震破裂方向和破裂延伸范围等与地震灾害密切联系的震源特征.通过地震波资料和GPS资料的联合反演,滑动分布更加紧凑,滑动量绝对大小也得到了更好地约束.
根据反演结果,地震破裂朝东南方向传播,形成 的静态滑动主要分布在震中至加德满都(Kathm and u)一带.从余震分布看(图 6),几乎所有余震都分布在震中东南方向,与本文确定的主震破裂方向与图像一致.具体地说,余震主要分布在主震破裂区域周围,余震区与主震破裂区形成了互补的关系.这再一次说明余震的发生是主震破裂导致的周围应力增强静态触发的结果.同时我们也注意到,尼泊尔地震之后,在我国西藏自治区日喀则地区的定日县境内也发生了多次地震,其中最大震级为MS5.9,由于距主震破裂相对较远,存在破裂远程动态触发的可能.图 6同时显示了此次地震主震破裂与余震分布,以及1833年M7.6地震与1934年Mw8.2地震的大致位置.从地震活动的空间位置看,2015年尼泊尔地震的破裂区域位于1833年M7.6地震与1934年Mw8.2地震以西,其深部破裂与余震活动紧邻1833年M7.6地震的宏观震中,且接近1934年Mw8.2地 震的Ⅷ度区;而浅部破裂基本衔接了1934年Mw8.2 地震的地表破裂,在很大程度上表明这三次地震的破裂区域可能存在一定的空间连续性.表明此次地震之后,发生破裂的加德满都地区原来存在的破裂空区在一定程度上得到了“填充”.然而另一方面,大 震之后主震破裂区与余震分布区的应力释放与调整过程往往会延续一段时间,短期内仍然存在发生强余震的可能.
 |
图 6 2015年尼泊尔地震滑动分布、余震分布,以及震中区域附近的历史大地震 青色圆圈为USGS 2015年5月1日发布的2015年尼泊尔地震的余震震中(M>3.8),圆圈直径正比于地震震级,红色实线和虚线为不同工作得到的1934年Mw8.2地震的烈度Ⅷ区等震线( Pandey and Molnar, 1988;Delcailleau,1992),黄色粗线标示了1934年地震的地表破裂位置(Sapkota et al., 2013),黑线为印度板块与欧亚板块的边界.除2015年尼泊尔地震外,另外两个白色八角星分别表示1833年和1934年地震的宏观震中(Delcailleau,1992)与微观震中(Hough and Bilham, 2008).Fig. 6 Fault slip distribution and aftershocks of the 2015 Nepal earthquake, and historical large earthquakes nearby Cyan circles are aftershocks(M>3.8)up to 1 May 2015(from USGS),whose radius are proportional to magnitudes. Red solid and dashed lines are isoseismals of intensity Ⅷ determined from different studies( Pandey and Molnar, 1988;Delcailleau,1992). Yellow bold line marks the surface ruptures of the 1934 earthquake(Sapkota et al., 2013), and black line is the boundary between the India Plate and the Euro-Asia Plate. In addition to the epicenter of the 2015 Nepal earthquake,other two white stars are macroseismic and instrumental epicenters of the 1833 and 1934 earthquakes,respectively. |
需要说明的是,本文反演都采用了既有的震源位置和震源机制.由于目前近断层强震资料和大地测量资料的匮乏,这些基本震源参数不能得到很好地约束,可能存在不确定性,并在一定程度上影响破裂过程结果.其中,宽频带地震波反演只能获取破裂相对于震中的相对位置,一旦震中位置出现偏差,滑动分布也会发生相应的偏移.另外,2015年尼泊尔Mw7.9地震是一次比较典型的板间低倾角逆冲型地震事件,对于此类地震,断层面倾角有可能随深度发生改变,即断层几何模型存在相当的复杂性,可能降低采用简单断层模型对破裂过程成像的精细和可靠程度.在下一步工作中,迫切需要搜集更多的近断层地震波形资料和大地测量资料,对此次地震的震源位置和断层几何模型进行深入全面的分析,提高破裂过程模型的准确度与可靠性.
致谢 本文地震波数据来自IRIS数据中心,GPS数据下载自网页www.unavco.org.中国科学院测量与地球物理研究所的刘成利博士在GPS数据方面给予了帮助,两位审稿专家提出了非常中肯的修改意见,作者对他们致以诚挚谢意!| [1] | Bassin C, Laske G, Masters G. 2000. The current limits of resolution for surface wave tomography in North America. , EOS Trans.AGU 81, F897. |
| [2] | Bilham R, Gaur V K, Molnar P. 2001. Himalayan seismic hazard. Science, 293(5534):1442-1444. |
| [3] | Chen Y T, Xu L S. 2000. A time-domain inversion technique for the tempo-spatial distribution of slip on a finite fault plane with applications to recent large earthquakes in the Tibetan Plateau. Geophys. J. Int., 143: 407-416. |
| [4] | Delcailleau B. 1992. Les Siwaliks du Népal oriental. Presses du CNRS (Editions du Centre National de la Recherche Scientifique). |
| [5] | Hough S E, Bilham R. 2008. Site response of the Ganges basin inferred from re-evaluated macroseismic observations from the 1897 Shillong, 1905 Kangra, and 1934 Nepal earthquakes. J. Earth Syst. Sci., 117: 773-782. |
| [6] | Ide S, Baltay A, Beroza G C. 2011. Shallow dynamic overshoot and energetic deep rupture in the 2011 Mw9.0 Tohoku-Oki earthquake. Science, 332(6036): 1426-1429. |
| [7] | Kennett B L N, Engdahl E R, Buland R. 1995. Constraints on seismic velocities in the earth from traveltimes. Geophys. J. Int., 122: 108-124. |
| [8] | Lay T, Ammon C J, Kanamori H, et al. 2011a. Possible large near-trench slip during the 2011 Mw9.0 off the Pacific coast of Tohoku Earthquake. Earth Planet and Space, 63(7): 687-692. |
| [9] | Lay T, Ammon C J, Kanamori H, et al. 2011b. The 25 October 2010 Mentawai tsunami earthquake (Mw7.8) and the tsunami hazard presented by shallow megathrust ruptures. Geophys. Res. Lett., 38(6): L06302, doi:10.1029/2010GL046552. |
| [10] | Molnar P, Pandey M R. 1989. Rupture zones of great earthquakes in the Himalayan region. Proceedings of the Indian Academy of Sciences-Earth and Planetary Sciences, 98(1): 61-70. |
| [11] | Okada Y. 1985. Surface deformation due to shear and tensile faults in a half-space. Bull. Seism. Soc. Am., 75(4): 1135-1154. |
| [12] | Pandey M R, Molnar P. 1988. The distribution of intensity of the Bihar-Nepal earthquake of 15 January 1934 and bounds on the extent of the rupture zone. J. Nepal , Geol. Soc.5: 22-44. |
| [13] | Sapkota S N, Bollinger L, Klinger Y, et al. 2013. Primary surface ruptures of the great Himalayan earthquakes in 1934 and 1255. Nature Geoscience, 6(1): 71-76. |
| [14] | Wang R J. 1999. A simple orthonormalization method for stable and efficient computation of Green's functions. Bull. Seism. Soc. Am., 89(3): 733-741. |
| [15] | Wang R, Parolai S, Ge M, et al. 2013. The 2011 Mw9.0 Tohoku earthquake: comparison of GPS and strong-motion data. Bull. Seism. Soc. Am., 103(2B): 1336-1347. |
| [16] | Xu L S, Chen Y T, Teng T L, et al. 2002. Temporal and spatial rupture process of the 1999 Chi-Chi earthquake from IRIS and GEOSCOPE long period waveform data using aftershocks as empirical Green's functions. Bull. Seism., Soc. Am.92: 3210-3228. |
| [17] | Yue H, Lay T, Rivera L,et al. 2014. Rupture process of the 2010 Mw7.8 Mentawai tsunami earthquake from joint inversion of near-field hr-GPS and teleseismic body wave recordings constrained by tsunami observations. J. Geophys. Res. Solid Earth, 119: 5574-5593. |
| [18] | Zhang Y, Feng W P, Chen Y T, et al. 2012. The 2009 L'Aquila Mw6.3 earthquake: a new technique to locate the hypocentre in the joint inversion of earthquake rupture process. Geophys. J. Int., 191: 1417-1426, doi:10.1111/j.1365-246X.2012.05694.x. |
 2015, Vol. 58

