 2015, Vol. 58


Firstly, calculate uplifting height of the base of gas hydrate stability zone (BGHS) based on the falling height of sea level, the natural gas hydrate phase equilibrium equation, the hydrostatic pressure formula, the temperature-depth equation of seafloor and the temperature-depth equation of deposition layer. Then establish two-dimensional axisymmetric model according to the characteristic of cold seepage, and set its material properties according to the previous studies on the composition of seafloor sediments and the properties of methane hydrate, methane, and sea water. The timeframe for this study is set as 26500 years, starting from the beginning of the Last Glacial Maximum (26.5 ka BP), and the hydrate decomposition time is set as 7500 years. The computational time step is set as 100 years. The excess pore pressure of upper boundary and lower boundary is set as zero, the right boundary set as impervious, and the left boundary is set as symmetric. Use structured quadrilateral mesh generation method to divide the model, and refine the mesh of hydrate zone and tubular channel. Finally, solve the two-dimensional axisymmetric unsteady seepage flow equation by the finite element method, and quantitatively analyze the influence of the sea-level falling on the formation of cold seepage.
The main results are as following: (1) With hydrate decomposition lasting, the maximum value of excess pore pressure gradually increases, the area moves up, the range of fluid diffusion enlarges, and the highest excess pore pressure in the decomposition zone can even rise to 13180 Pa. But at the same depth, the excess pore pressure of tubular channel is larger than that of the sediment above the decomposition zone, and the range of fluid diffusion around tubular channel changes with depth. After the hydrate decomposition stops, the maximum value of excess pore pressure is smaller and smaller, but the range of fluid diffusion is larger and larger. Finally a funnel is formed at the bottom of the tubular channels, and the range of the funnel increases with time. (2) Just the same, the Darcy velocity in tubular channel increases with time and can rise to m/s during the hydrate decomposition process, decreases with time after the hydrate decomposition stops, and can reach m/s now. Also, the Darcy velocity in tubular channel increases with depth during the hydrate decomposition process, and the effect of depth on the Darcy velocity is very small after the hydrate decomposition stops. (3) The factors that influence the seepage Darcy velocity can be as the followings: (a) The larger the permeability of the tubular channel, the larger the seepage Darcy velocity, but the shorter the seepage duration. (b) The impact from the permeability of the media around the channel on the Darcy velocity changes with time; the larger the permeability of the media, the smaller the Darcy velocity with hydrate decomposition lasting; after the hydrate decomposition stops, the smaller the permeability of the media, the smaller the Darcy velocity. (c) The smaller the radius of channel, the larger the Darcy velocity.
The results based on this model seem to show that cold seepage, caused by sea-level falling in Last Glacial Maximum (26.5~19.0 ka BP), can continue to this day, and even last for more than ten thousand years. But after hydrate decomposition stops, the excess pore pressure continues to decrease over time, and seepage Darcy velocity decreases fast at first then get slow. Also, the seepage Darcy velocity has something to do with the permeability of the tubular channel, the permeability of the media around the channel, and the radius of the channel. Thus, it may be reasonable that the gas hydrate decomposition caused by sea-level falling can be an important factor affecting the global climate change.
海底冷泉是指在压力梯度的影响下,从沉积体中运移和排放出的以水、碳氢化合物、硫化氢或二氧化碳为主要成分、温度与海水相近、并具有一定流速的流体(陈忠等,2007).冷泉中碳氢化合物的来源之一是天然气水合物分解产生的甲烷(邸鹏飞等,2008),所以海底冷泉指示其下方可能存在天然气水 合物.1958年,Emery和Hoggan(Emery and Hoggan, 1958)首次报道了海底冷泉的存在,50多年来,随着海洋调查技术的不断提高,调查范围从浅水区逐渐扩展到半深水和深水区,已经在近岸区、陆架区、大陆坡区、增生复合体区域、大陆边缘的深水区等发现了海底冷泉(栾锡武等,2010).近年来的调查研究表明,我国南海是重要的水合物资源远景区(姚伯初, 1998,2001;张洪涛等,2007),不仅通过钻探获得了水合物实物样品,还发现了大量与冷泉活动有关的地质证据(泥火山、泥底辟、麻坑、海底滑塌、冷泉生物群落和冷泉碳酸盐岩等)(黄永样等,2008).在我国,已经初步确认的近海冷泉区主要有 7 个,东海仅发现冲绳海槽 1个冷泉区,南海海域分布 6 个,包括台西南海域、东沙群岛西南海域、东沙群岛东北海域、神狐海域、南沙海槽和西沙海槽海区(徐翠玲,2013).
甲烷冷泉的重要成因之一是天然气水合物的分解(陈忠等,2008).天然气水合物的稳定性依赖于周围环境的温度和压力,在低温高压环境下稳定存在,但其稳定性可能被海平面变化、或上覆底层海水温度的变化破坏,导致其分解,形成冷泉.
温度对冷泉形成影响的研究主要集中在温度对天然气水合物稳定性的研究上,但温度对水合物稳定性的影响存在一定争议.Macdonal等(1994)通过对墨西哥湾北部陆坡出露的天然气进行原位观测研究认为水合物温度的波动和水合物底下浮力的聚集会导致气体的释放和封闭的交替.但也有研究发现温度对水合物稳定性的影响不明显,Macdonal等(2005)对布什海山进行原位观测发现底层水温度短期的变化对海底水合物的稳定性没有显著影响;Vardaro等(2006)发现水文短期变化和一天为周期的温度和光度显著变化对海底水合物稳定没有显著影响.
海平面下降,深海沉积物所受的静水压力减少,使原本处于稳定域的水合物由于静水压力的降低而失稳分解,将导致赋存其中的天然气水合物快速释 放(Paull et al., 2002; 韩喜球等,2013).Kvenvolden等(1993)认为阿拉斯加北坡发生的大面积滑坡是由冰期水合物释放引起的,当时全球海平面下降约120m.Kortsenshteyn(1970)研究认为,海平面降低120 m,将使水合物的底部抬升约20 m,其结果会使得气水合物溶解并引起洋底滑塌.Maslin等(1998)研究表明出现在35 ka和42~45 ka的两次大冰期,造成海平面下降速率约为15~ 25 m/ka,由此导致的气体水合物分解而诱发的海底滑坡,是这两个时期南美亚马逊海底扇大量沉积物堆积的主要原因.
但是,受深海探测技术条件的限制及现有条件的复杂多变,对与冷泉活动有关的甲烷渗漏的研究才刚刚起步,并且海平面变化对冷泉形成的影响及甲烷渗漏时序变化规律的研究也未全面开展.目前仍不清楚南海大部分地区天然气水合物分解的确切时间、规模、触发机制、及其与气候变化、海平面变化的相关性.为了定量研究海平面下降对冷泉形成的影响,本文基于对冷泉渗漏特征的分析,建立了水合物分解的动态有限元模型,模拟在不同渗透率条件下,冷泉流体的渗流达西速度,以及由水合物分解造成的超孔隙压力随时间的变化. 2 方法原理 2.1 数值模型
天然气水合物的稳定带是指海底以下的特定区域,该区域内的温度和压力处于天然气水合物形成的热力学稳定范围(王淑红等,2005).其底界通常是根据海底温度、地温梯度、 天然气水合物相平衡曲线计算确定的,通常用深度-温度图来确定,其数值在地温曲线和纯水或海水相平衡曲线的交汇点上. Miles(1995)提出了海水中甲烷水合物稳定存在的压力-温度四阶多项式方程:

稳定带底界的静水压力P与海水深度及稳定带厚度的关系为

Shyu等(1998)在台湾西南部实测的14个海底温度数据,用三阶多项式拟合这些数据得到海底温度-深度方程(宋海斌等,2007):
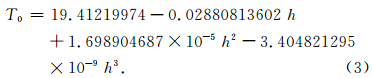

图 1表示了甲烷水合物的相平衡示意图.在甲烷水合物相边界曲线、海底温度曲线和沉积物的地温温度梯度曲线所包围的区域内,水合物是稳定的.相图中海底温度曲线和甲烷水合物相边界曲线的交点深度是甲烷水合物稳定存在的最小水深,而地温梯度曲线和甲烷水合物相边界曲线的交点深度是甲烷水合物稳定存在的最大深度.根据图 1可知,海平面下降时,稳定带底界抬升.Clark等(2009)研究发现末次冰盛期(26.5~19.0 ka BP),海平面下降130m.假设末次冰盛期开始时,某处的海底深度为1000 m,根据公式(1)—(4)可求出稳定带厚度为265.1 m,海平面下降130 m后,稳定带厚度为239.7 m,则稳定带底界抬升了25.4 m.天然气水合物的存在方式主要有4种(许红等,2005):(1)结核晶体状,出现在粗粒岩石孔隙之间;(2)球粒状,分散于细粒岩石之中;(3)薄层状,见于沉积物或填充于裂缝中;(4)厚层大块状,分布于沉积层中或深海海 底.本文中假设天然气水合物的存在形式为厚层大块 状,且甲烷不溶于水.水合物的密度为920 kg·m-3,水的密度为1000 kg·m-3,甲烷的密度采用Peng-Robinson状态方程计算(吴二林等,2012):
考虑到实际水合物的赋存状态非常复杂,并且水合物分解释放的甲烷等流体沿孔隙、裂缝、裂隙、断层或泥火山等运移通道穿过海底沉积层渗漏进入海水,形成冷泉,这些通道的渗透率比周围介质大很多,因此本文建立这样一个简单的模型:冷泉出露的 下方是一个渗透率比周围介质高的管状通道,此通 道一直延伸到水合物层的底部,甲烷水合物呈水平层状分布,简化示意图如图 2a所示.
根据水合物相变潜热公式(Selim and Sloan, 1989)可知,本模型中1s内单位面积水合物分解吸收的热量约为0.0383 J.徐行等(2006)测量了南海西沙海槽地区的海底热流,变化范围为83~112 mW·m-2,Yuan等(2009)测量的白云凹陷LW3-1-1钻孔的热流为92 mW·m-2,李亚敏等(2010)测量的白云凹陷区的热流变化范围为56~101 mW·m-2,因此1 s内单位面积流过的热量为0.056~0.112 J,大于水合物分解吸收的热量很多,而且本文中水合物的分解是一个十分缓慢的过程,所以在本模型中可以忽略温度的影响.本文仅考虑海平面下降造成水合物稳定带底部的抬升,即水合物是从底部开始分解的,且 假设海平面在下降过程中是匀速的.我们考虑三维 问题,但作轴对称简化假定,如图 2b 所示,即把管 状通道的竖直中心轴线(图 2b中的AB)作为模型的对称轴,平面ABCD绕轴线AB旋转360°即得到整个空间圆柱体的情况.计算模型如图 2b 所示,AB为对称轴.模型的横向尺度为200 m,管状通道的半径为10 m,纵向尺度为400 m,上边界表示海底,水合物分解前的底界位于海底以下265.1 m.关于天然气水合物的顶界,目前还没有很好的方法来确定,且不同地区顶界的埋深相差很大;曹运诚和陈多福(2014)计算的ODP1245和IODP1327站位水合物顶界埋深分别为海底之下53 m和83 m;广州海洋地质调查局在神狐海域实施了钻探,结合测井结果与钻孔沉积物取芯结果可以断定在SH2站位水合物赋存于海底之下188~228 m,含水合物的沉积物层厚度约为40 m(杨睿等,2011);本文中取水合物的顶界埋深为200 m.
2.2 基本方程 二维轴对称非稳态渗流方程为
影响渗透率的因素较为复杂,目前关于海底沉积物的渗透率的研究较少,对于海底沉积物渗透率的大小还没有统一的认识,但是目前已知海底沉积物主要的岩性组分是粘土、粉砂质粘土、粉砂和砂(何静等,2013),因此本文中把海底沉积物当作半透水地质材料来处理.本文中为简化计算,把混有甲烷的水作为一种流体处理,其性质近似为混合流体的平均,这样简化后的流体模型便于说明海平面下降影响孔隙压力和渗流达西速度这一物理问题的机理,而且对计算结果的数量级不会造成大的影响.
2.3 边界条件和计算参数 我们研究的时间段为末次冰盛期开始(26.5 ka BP)到现今,总的计算时间为26500 a,水合物的分解时间为7500 a,时间步为100 a.模型上、下边界的超孔隙压力为零,右边界为CD不透水边界,左边界AB为对称边界.采用四边形单元进行结构化网格剖分,并对水合物区及管状通道进行局部加密,整个模型节点数为107133,总单元数为106400.沉积物、水合物、管状通道的渗透率k分别为2.5×10⁻¹⁶、2.5×10⁻¹⁷、2.5×10⁻¹³m2,S为2.5×10⁻⁵、1.2×10⁻⁵和9.0×10⁻⁵ Pa-1,分解区的流体源项为2.06×10⁻¹⁰ s-1.
3 结果及讨论
图 4为不同时间的渗流达西速度,图中空白的区域表示渗流达西速度超出标尺的上限值.由图 4可知,水合物分解的过程中,管状通道中的渗流达西速度不断增大,海底渗流达西速度可达1.9×10⁻⁵ m·s-1,且随着深度的增加而增加;水合物停止分解后,管状通道中的渗流达西速度随时间减小,现如今海底渗流的达西速度为1.6×10⁻⁶ m·s-1.管状通道中的渗流达西速度在海平面停止下降、水合物停止分解后随时间减小很容易理解,因为失去了孔隙压力的新来源,仅是原有高压的逐步扩散.管状通道中渗流达 西速度随深度减小而减小的原因,是由于管道内的 压力高于围绕在其周围的沉积物内的压力,因此流 体在上升途中会不断有部分向管道四壁外扩散,从
而管道内的流体达西速率越来越小.
图 5更清楚地显示了不同时间管状通道中的渗流达西速度随深度的变化,图中横轴表示海底以下的深度,纵轴表示管状通道的渗流达西速度;粉色、绿色、红色、蓝色表示不同的时间.由图可知水合物分解过程中,同一时间通道中的渗流达西速度随着深度的减小而减小,例如水合物分解的第7500年,海底以下180 m处的达西速度为2.3×10⁻⁵ m·s-1,海底的达西速度为1.9×10⁻⁵ m·s-1; 相同深度的渗流达西速度随分解的进行而增大,如海底的达西速度在第2500年时为1.0×10⁻⁵ m·s-1,在第7500年 的达西速度为1.9×10⁻⁵ m·s-1;水合物停止分解后,同一时间的渗流达西速度随深度的变化不明显,第1700年管道中各深度的渗流达西速度在2×10⁻⁶ m·s-1左右,现阶段(第26500年)管道中各深度的渗流达西速度在1.5×10⁻⁶ m·s-1左右,但是可看出随深度的减小渗流达西速度缓慢增大,相同深度的渗流达西速度随时间的增大而减小.
图 6给出了管状通道中不同深度的渗流达西速度随时间的变化,并比较了不同的渗透率对渗流达西速度的影响.图中195 m、1 m指的是海底以下的深度,a、b、c代表的是不同的渗透率,a代表的沉积物、水合物及管状通道的渗透率k分别为2.5×10⁻¹⁶、2.5×10⁻¹⁸、2.5×10⁻¹³ m2,b代表的沉积物、水合物及管状通道的渗透率k分别为2.5×10⁻¹⁷、2.5×10⁻¹⁸、2.5×10⁻¹³ m2,c代表的沉积物、水合物及管状通道的渗透率k分别为2.5×10⁻¹⁷、2.5×10⁻¹⁸、2.5×10⁻¹⁴ m2,S、Q的取值与2.3节相同.由图可知,当通道中的渗透率较大(2.5×10⁻¹³m2)时,在水合物分解过程中,渗流达西速度随着时间迅速增大,且深度越大渗流达西速度越大;当水合物停止分解后,海底以下195 m处的渗流达西速度迅速降低到1m处的渗流达西速度以下,渗流达西速度先迅速减小,然后随着时间的变化减小得越来越缓慢,且深度越大渗流达西速度越小.当通道中的渗透率较小(2.5×10⁻¹⁴ m2)时,在水合物分解过程中,渗流达西速度随着时间的变化相对较缓慢.可以看出沉积物的渗透率、管状通道的渗透率对渗流达西速度都有很大的影响,尤其对水合物分解过程中的渗流达西速度.沉积物的渗透率相同时,水合物分解过程中通道的渗透率越大渗流达西速度越大;水合物分解停止后,随着时间的演化,通道的渗透率越小渗流达西速度越大.通道的渗透率相同时,水合物分解期间,沉积物的渗透率越大,渗流达西速度越小,原因是沉积物的渗透率越大,从通道渗出的流体越多.但是分解停止后,随着时间的演化,反而是沉积物的渗透率较小时,通道中的渗流达西速度小.这种现象可以解释为,水合物分解停止后,随着流体从通道不断的渗出,通道底部的超孔隙压力逐渐低于周围介质的超孔隙压力,此后,从通道中渗出的流体主要来源于在分解过程中渗透到通道周围介质的流体,介质的渗透率小,相同时间内渗透到通道中的流体较少,因而通道中的渗流达西速度小.
图 7显示了管状通道半径对渗流达西速度的影响,计算参数的取值与2.3节相同.横轴表示海底以下的深度,纵轴表示管状通道的渗流达西速度;粉色、绿色、红色、蓝色表示不同的通道半径.总体来说通道半径越小,渗流达西速度越大.水合物分解期间,通道中的渗流达西速度随着深度的减小而减小.分解停止后,通道半径为8 m时,在第17000年,渗 透达西速度随深度的减小而减小;通道半径为10 m、 15 m时,渗透达西速度随深度的减小略微增大.
大多数情况下,我们更关注的是渗流通量.如图 8所示,通道半径对渗流通量的影响更为复杂.由图可知,水合物分解过程中,通道的渗流通量都是随着深度的减小而减小,这说明在该时间范围内,同一海底深度下通道中的孔隙压力较大,流体在通道中向上运移时还伴随着横向的渗漏,这也是图 8c中通道半径为8 m时,渗流通量随深度减小的原因.图 8(c、d)中,通道半径为10、15 m时,通道的渗流通量随着深度的减小而增大,这说明在此时间段内,同一海底深度下通道中的压力较小,流体在通道中的向上运移是由周围介质向通道中的渗透引起的,向上运移时伴随着周围介质向通道的渗透.对比图 7和图 8可知,通道中的渗流达西速度同渗流通量随时间、深度的变化趋势是一致的.决定渗流通量的主要因素是渗流达西速度和通道半径,图中4个不同时间,同一深度渗流通量的大小顺序取决于该深度的渗流达西速度与通道半径的比例关系.
本文利用有限元方法计算了海平面下降对冷泉形成的影响.结果表明,在本文设定的水文条件下,末次冰盛期海平面下降引起的流体向海底的渗漏可以持续到现在.海平面下降期间水合物分解速率较 高,达西速度为1.9×10⁻⁵ m·s-1,渗流通量为6.1× 10⁻³ m3·s-1,海平面停止下降、因而天然气水合物 分解停止以后,渗流仍持续,不过速率减小到1.6×10⁻⁶ m·s-1,通量减小到5.2×10⁻⁴ m3·s-1.从计算结果的趋势看,这种渗漏有可能继续持续上万年.流体向海底的渗漏达西速度与下列因素有关:(1)管状通道的渗透率.通道的渗透率越大,渗漏达西速度越大,但能够持续的时间越短;(2)通道周围介质的渗透率.其对渗漏达西速度的影响随时间变化,水合 物分解期间周围介质的渗透率越大,渗漏达西速度越小;其后沉积物的渗透率越小,通道中的渗漏达西速度越小;(3)通道半径.通道半径越小,渗漏达西速度越大.
由于计算天然气水合物资源量的约束条件的不 确定性,不同学者估算的全球天然气水合物含甲烷资源量存在一定的差异:1990年MacDonald估算的结果为1.0×10¹⁶ m3,2001年Alexei 估算为 1.1×10¹⁶ m3(许红等,2005);Milkov(2004)为2.1×10¹⁶ m3; Makogon(2010)预测的储量约为1.5×10¹⁶ m3,其中97%储存在海底;根据每立方米饱和天然气水合物可释放出约 164 m3的甲烷气体可估算出海底天然气水合物的储量为5.91×10¹³-1.24×10¹⁴ m3.全球海洋中水合物稳定带厚度50~450 m(许红等,2005),则全球约有1.31×10¹¹~2.48×10¹² m2的 海底赋存水合物;假设每1万平方米水合物中有一个1平方米的冷泉,则根据计算可知现阶段由末次冰 盛期海平面下降引起的甲烷渗漏通量约为490 kg·m-2·a-1;所以在此假设的基础上,现阶段全球每年因末次冰盛期海平面下降产生的甲烷约为6.42×10⁹~1.22×10¹¹ kg,如果这部分甲烷全部进入大气,则大气中这部分甲烷的年通量约为4.81~91.14 TgC/a,与Westbrook等(2009)估算的20 Tg /a由全球发现的250多处天然气气泡羽输入大气的碳通量吻合,为实际大气中甲烷年通量(593 TgC /a)(叶黎明等,2011)的0.8%~15.4%,其造成的温室效应不可小觑;如果这部分甲烷全部 在海水中被氧化,则每年约消耗海水中2.57×10¹⁰~4.86×10¹¹ kg氧,可能引起海水氧浓度降低,导致海洋生物死亡.总而言之,海平面下降引起的天然气水合物分解,可能会加剧温室效应,破坏海洋生态平衡,可能是影响全球气候变化的一个重要因素.
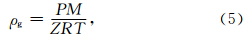

图 1 甲烷水合物相平衡与稳定带厚度示意图Fig. 1 Sketch of the phase equilibrium for methane hydrate
and the thickness of the gas hydrate stability zone

图 2 计算模型Fig. 2 Calculation model
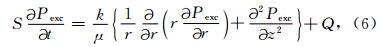

图 3 不同时间的超孔隙压力Fig. 3 The excess pore pressure at different times

图 4 不同时间的渗流达西速度Fig. 4 The seepage Darcy velocity at different times

图 5 不同时间的渗流达西速度随深度的变化Fig. 5 The relationship between seepage Darcy velocity
and depth at different times

图 6 不同深度的渗流达西速度随时间的变化Fig. 6 The relationship between seepage Darcy velocity and time at different depth

图 7 管状通道的半径对渗流达西速度的影响Fig. 7 The relationship between seepage Darcys velocity and the radius of channel

图 8 管状通道的半径对渗流通量的影响Fig. 8 The relationship between seepage flux and the radius of channel
| [1] | Cao Y C, Chen D F. 2014. Modeling calculation of top occurrence of marine gas hydrates. Chinese Journal of Geophysics (in Chinese), 57(2): 618-627. |
| [2] | Chen Z, Yang H P, Huang C Y, et al. 2007. Characteristics of cold seeps and structures of chemoauto-synthesis-based communities in seep sediments. Journal of Tropical Oceanography (in Chinese), 26(6): 73-82, doi: 10.3969/j.issn.1009-5470.2007.06.013. |
| [3] | Chen Z, Yang H P, Huang C Y, et al. 2008. Diagenetic environment and implication of seep carbonate precipitations from the Southwestern Dongsha Area, South China Sea. Geoscience (in Chinese), 22(3): 382-389, doi: 10.3969/j.issn.1000-8527.2008.03.006. |
| [4] | Clark P U, Dyke A S, Shakun J D, et al. 2009. The last glacial maximum. Science, 325(5941): 710-714. |
| [5] | Di P F, Feng D, Gao L B, et al. 2008. In situ measurement of fluid flow and signatures of seep activity at marine seep sites. Progress in Geophysics (in Chinese), 23(5): 1592-1602. |
| [6] | Emery K O, Hoggan D. 1958. Gases in marine sediments. AAPG Bulletin, 42(9): 2174-2188. |
| [7] | He J, Liu X W, Yu Z, et al. 2013. Factors influencing the porosity of gas hydrate bearing sediments. Science China Earth Sciences, 56(4): 557-567. |
| [8] | Han X Q, Yang K H, Huang Y Y. 2013. Origin and nature of cold seep in northeastern Dongsha area, South China Sea: Evidence from chimney-like seep carbonates. Chin. Sci. Bull., 58(30): 3689-3697. |
| [9] | Huang Y Y, Suess E, Wu N Y. 2008. The Methane and Natural Gas Hydrate Geology in Northern Continental Slope of South China Sea (in Chinese). Beijing: Geological Publishing House. |
| [10] | Kortsenshteyn V N. 1970. Effect of periodic glaciations on the formation of the enormously large gas fields in the northern part of the Tyumen Oblast. Akademiya Nauk SSSR. Doklady, 191: 1366-1369. |
| [11] | Kvenvolden K A, Lilley M D, Lorenson T D, et al. 1993. The Beaufort Sea continental shelf as a seasonal source of atmospheric methane. Geophysical Research Letters, 20(22): 2459-2462. |
| [12] | Li Y M, Luo X H, Xu X, et al. 2010. Seafloor in-situ heat flow measurements in the deep-water area of the northern slope, South China Sea. Chinese Journal of Geophysics (in Chinese), 53(9): 2161-2170, doi: 10.3969/j.issn.0001-5733.2010.09.016. |
| [13] | Luan X W, Liu H, Yue B J, et al. 2010. Characteristics of cold seepage on side scan sonar sonogram. Geoscience (in Chinese), 24(3): 474-480. |
| [14] | MacDonald I R, Guinasso N L, Sassen R, et al. 1994. Gas hydrate that breaches the sea floor on the continental slope of the Gulf of Mexico. Geology, 22(8): 699-702. |
| [15] | MacDonald I R, Bender L C, Vardaro M, et al. 2005. Thermal and visual time-series at a seafloor gas hydrate deposit on the Gulf of Mexico slope. Earth and Planetary Science Letters, 233(1-2): 45-59. |
| [16] | Makogon Y F. 2010. Natural gas hydrates—A promising source of energy. Journal of Natural Gas Science and Engineering, 2(1): 49-59. |
| [17] | Maslin M, Mikkelsen N, Vilela C, et al. 1998. Sea-level-and gas-hydrate-controlled catastrophic sediment failures of the Amazon Fan. Geology, 26(12): 1107-1110. |
| [18] | Miles P R. 1995. Potential distribution of methane hydrate beneath the European continental margins. Geophysical Research Letters, 22(23): 3179-3182. |
| [19] | Milkov A V. 2004. Global estimates of hydrate-bound gas in marine sediments: how much is really out there?. Earth-Science Reviews, 66(3-4): 183-197. |
| [20] | Paull C K, Brewer P G, Ussler W, et al. 2002. An experiment demonstrating that marine slumping is a mechanism to transfer methane from seafloor gas-hydrate deposits into the upper ocean and atmosphere. Geo-Marine Letters, 22(4): 198-203. |
| [21] | Selim M S, Sloan E D. 1989. Heat and mass transfer during the dissociation of hydrates in porous media. AIChE Journal, 35(6): 1049-1052. |
| [22] | Shyu C T, Hsu S K, Liu C S. 1998. Heat flows off southwest Taiwan: measurements over mud diapers and estimated from bottom simulating reflectors. Terrestrial Atmospheric and Oceanic Sciences, 9: 795-812. |
| [23] | Song H B, Wu S G, Jiang W W. 2007. The characteristics of BSRs and their derived heat flow on the profile 973 in the northeastern South China Sea. Chinese Journal of Geophysics (in Chinese), 50(5): 1508-1517. |
| [24] | Vardaro M F, MacDonald I R, Bender L C, et al. 2006. Dynamic processes observed at a gas hydrate outcropping on the continental slope of the Gulf of Mexico. Geo-Marine Letters, 26(1): 6-15. |
| [25] | Wang S H, Song H B, Yan W. 2005. Discussion of the calculation methods and selection of parameters of the gas hydrate stability zone. Geoscience (in Chinese), 19(1): 101-107. |
| [26] | Westbrook G K, Thatcher K E, Rohling E J, et al. 2009. Escape of methane gas from the seabed along the West Spitsbergen continental margin. Geophysical Research Letters, 36(15): L15608. |
| [27] | Wu E L, Wei H Z, Yan R T, et al. 2012. FEM-based simulation of decomposition process of gas hydrate-bearing sediments. Rock and Soil Mechanics (in Chinese), 33(9): 2811-2821. |
| [28] | Xu C L. 2013. In situ observation of methane seepage in the South China Sea (in Chinese). Qingdao: Ocean University of China. |
| [29] | Xu H, Huang J Q, Xia B, et al. 2005. Current research situation and resource potential evaluation of natural gas hydrate in the world. Natural Gas Industry (in Chinese), 25(5): 21-25. |
| [30] | Xu X, Shi X B, Luo X H, et al. 2006. Heat flow measurements in the Xisha trough of the South China Sea. Marine Geology & Quaternary Geology (in Chinese), 26(4): 51-58. |
| [31] | Yang R, Zhang Y, Lei X H, et al. 2011. Identification of gas hydrate reservoir and its depth estimation in Shenhu area, South China Sea. Marine Geology & Quaternary Geology (in Chinese), 31(4): 141-147. |
| [32] | Yao B C. 1998. Preliminary exploration of gas hydrate in the northern margin of the South China Sea. Marine Geology & Quaternary Geology (in Chinese), 18(4): 11-18. |
| [33] | Yao B C. 2001. The gas hydrate in the South China Sea. Journal of Tropical Oceanography (in Chinese), 20(2): 20-28. |
| [34] | Ye L M, Luo P, Yang K H. 2011. Advances in climatic effect study of gas hydrates. Advances in Earth Science (in Chinese), 26(5): 565-574. |
| [35] | Yuan Y, Zhu W, Mi L, et al. 2009. "Uniform geothermal gradient" and heat flow in the Qiongdongnan and Pearl River Mouth Basins of the South China Sea. Marine and Petroleum Geology, 26(7): 1152-1162. |
| [36] | Zhang H T, Zhang H Q, Zhu Y H. 2007. Gas hydrate investigation and research in China: Present status and progress. Geology in China (in Chinese), 34(6): 953-961. |
| [37] | Zhou L Z. 1989. Further discussion on the definition of storativity and coefficient of storage. Hydrogeology and Engineering Geology (in Chinese), (3): 50-51, 52. |
| [38] | Zhou L Z, Yang C B, Hou J. 1994. The definition of the specific yield. Hydrogeology and Engineering Geology (in Chinese), 21(1): 31-33. |
| [39] | 曹运诚, 陈多福. 2014. 海洋天然气水合物发育顶界的模拟计算. 地球物理学报, 57(2): 618-627. |
| [40] | 陈忠, 杨华平, 黄奇瑜等. 2007. 海底甲烷冷泉特征与冷泉生态系统的群落结构. 热带海洋学报, 26(6): 73-82, doi: 10.3969/j.issn.1009-5470.2007.06.013. |
| [41] | 陈忠, 杨华平, 黄奇瑜等. 2008. 南海东沙西南海域冷泉碳酸盐岩特征及其意义. 现代地质, 22(3): 382-389, doi: 10.3969/j.issn.1000-8527.2008.03.006. |
| [42] | 邸鹏飞, 冯东, 高立宝等. 2008. 海底冷泉流体渗漏的原位观测技术及冷泉活动特征. 地球物理学进展, 23(5): 1592-1602. |
| [43] | 何静, 刘学伟, 余振等. 2013. 含天然气水合物地层的孔隙度影响因素分析. 中国科学: 地球科学, 43(3): 368-378. |
| [44] | 韩喜球, 杨克红, 黄永样. 2013. 南海东沙东北冷泉流体的来源和性质: 来自烟囱状冷泉碳酸盐岩的证据. 科学通报, 58(19): 1865-1873. |
| [45] | 黄永样, Suess E, 吴能友等. 2008. 南海北部陆坡甲烷和天然气水合物地质. 北京: 地质出版社. |
| [46] | 李亚敏, 罗贤虎, 徐行等. 2010. 南海北部陆坡深水区的海底原位热流测量. 地球物理学报, 53(9): 2161-2170, doi: 10.3969/j.issn.0001-5733.2010.09.016. |
| [47] | 栾锡武, 刘鸿, 岳保静等. 2010. 海底冷泉在旁扫声纳图像上的识别. 现代地质, 24(3): 474-480. |
| [48] | 宋海斌, 吴时国, 江为为. 2007. 南海东北部973剖面BSR及其热流特征. 地球物理学报, 50(5): 1508-1517. |
| [49] | 王淑红, 宋海斌, 颜文. 2005. 天然气水合物稳定带的计算方法与参数选择探讨. 现代地质, 19(1): 101-107. |
| [50] | 吴二林, 魏厚振, 颜荣涛等. 2012. 含天然气水合物沉积物分解过程的有限元模拟. 岩土力学, 33(9): 2811-2821. |
| [51] | 徐翠玲. 2013. 南海冷泉区甲烷渗漏过程的原位观测研究. 青岛: 中国海洋大学. |
| [52] | 许红, 黄君权, 夏斌等. 2005. 最新国际天然气水合物研究现状与资源潜力评估 (上). 天然气工业, 25(5): 21-25. |
| [53] | 徐行, 施小斌, 罗贤虎等. 2006. 南海西沙海槽地区的海底热流测量. 海洋地质与第四纪地质, 26(4): 51-58. |
| [54] | 杨睿, 张媛, 雷新华等. 2011. 南海北部天然气水合物赋存带识别与深度预测. 海洋地质与第四纪地质, 31(4): 141-147. |
| [55] | 姚伯初. 1998. 南海北部陆缘天然气水合物初探. 海洋地质与第四纪地质, 18(4): 11-18. |
| [56] | 姚伯初. 2001. 南海的天然气水合物矿藏. 热带海洋学报, 20(2): 20-28. |
| [57] | 叶黎明, 罗鹏, 杨克红. 2011. 天然气水合物气候效应研究进展. 地球科学进展, 26(5): 565-574. |
| [58] | 张洪涛, 张海启, 祝有海. 2007. 中国天然气水合物调查研究现状及其进展. 中国地质, 34(6): 953-961. |
| [59] | 邹立芝. 1989. 关于贮水率与贮水系数概念的再探讨. 水文地质工程地质, (3): 50-51, 52. |
| [60] | 邹立芝, 杨昌兵, 侯杰. 1994. 关于给水度的定义. 水文地质工程地质, 21(1): 31-33. |