 2015, Vol. 58


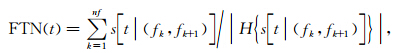
We collected continuous waveform data recorded by 557 temporal and permanent stations in Chuan-Dian fragment region. After removing instrument responses, bandpass filtering, frequency-time normalization, cross-correlation and stacking, more than 50000 empirical Green's functions were acquired. Furthermore, 13972 Rayleigh wave fundamental mode dispersion curves of high signal-to-noise ratio waveforms were measured with application of multiple filtering technique. To guarantee the validity of dispersion curves, we selected reliable dispersion curves according to the setting station-distance criteria and cluster analysis. At last, we determined group velocity structures of Rayleigh wave from periods of 6 to 48 s in the study area with traditional surface wave tomography technique.
From periods of 6 to 20 s, group velocity in west and north of Sichuan basin is characterized as low velocity, while the central and southeast Sichuan basin is imaged as high velocity. From periods of 30 to 48 s, the group velocity in Sichuan basin is obviously higher than that in the Tibetan Plateau and surrounding orogenic belts. In the meantime, the southwest part of the Sichuan basin is shown as relative low velocity. This phenomenon indicates the lateral variation of velocity structure in the lower crust and upper mantle. At 30 s, low group velocity is observed in Songpan-Ganzi fold belt, western Chuan-Dian fragment block and Xiaojiang fault zone. At Panzhihua and its surrounding area, a high-velocity anomaly exists at all periods. From 6 s to 24 s, this high-velocity anomaly is oriented in a nearly west-east direction, however between 30 s and 48 s in a northeast-southwest direction. Along with the growth of periods, the anomaly is concentrated to Panzhihua. At periods of 14 s and 20 s, high group velocity anomaly exists at the south of Lijiang-Xiaojinhe Fault and the anomaly is parallel with the fault. Since 24 s, high-velocity anomaly shows up at the southeast of the study region and becomes larger with periods turning longer. At 30 s, the range of the high velocity anomaly is consistent with Nanpanjiang Basin. The S-wave velocity cross section reveals that the S-wave velocities of crust and upper mantle in the Nanpanjiang Basin are higher than those in other surrounding regions.
High-resolution Rayleigh wave group velocity maps in the southeast of the Tibetan Plateau are obtained using ambient noise tomography based on intensive seismic observation data. Low velocities in Sichuan Basin at short periods reflect the sediments in the basin being younger than the surrounding blocks. In this basin, the different subsidence rate and sediments thickness since Jurassic result in the inhomegeneous distribution of low velocities. In the north and northwest of the basin, the sediments are thickest. For periods of 30 to 48 s, the low velocity in the northwestern margin of the Sichuan Basin may be related with high temperature in the lower crust and upper mantle. The high temperature decreases the mechanical strength of the crust in the southwestern basin, resulting in the crust deforming easier because of the pinching action of the Tibetan Plateau, and probably is the reason of Cenozoic folds, fault movements and crustal shortening in the brittle upper crust. High-velocity anomaly existing from the surface to upper mantle in Panzhihua and surrounding areas is probably caused by the intrusion of mafic-ultramafic magma in Emeishan magmatic activity. This high-velocity anomaly with strong medium strength impedes the material extrusion of Chuanxibei sub-block to some extent, bringing about the enormous difference of topography between the two sides of the Lijiang-Xiaojinhe Fault. The high group velocity anomaly in the southeast of the study area is consistent with the range of the Nanpanjiang Basin. Having a higher S-wave velocity, the Nanpanjiang Basin has different deep structure comparing with other regions to the north of Nanpanjiang. Meanwhile, this high velocity anomaly may offer an impact of blocking the southeast extrusion of the plateau material.
印度—欧亚大陆碰撞是新生代地球上最为壮观的重大地质事件,它导致了青藏高原快速隆升、周边地区强烈的造山运动、大型走滑断裂活动,以及大量物质的侧向逃逸(Tapponnier et al., 2001;Molnar and Tapponnier, 1978).为了解释青藏高原隆升与演化机制,学者们提出了多种不同模型,其中最具代表性的有:高原地壳物质东向挤出模型、地壳挤压增 厚模型以及地壳流模型等(Molnar and Tapponnier, 1975; Allegre et al., 1984; Royden et al., 1997). 青藏高原东缘地区作为构造逃逸和可能的地壳流的必经区域,是研究和检验不同模型的理想场所.对该地区壳幔三维速度结构的研究,有助于深入认识青藏高原的形成机制和动力学演化过程.
长期以来,青藏高原东南缘的深部结构研究一直受到人们的高度重视,取得了一系列很有意义的成果(刘福田等,2000;吴建平等,2001;王椿镛等, 2007,2008;陈九辉等,2009; 邓文泽等,2014;Huang et al., 2002; Wang et al., 2003,2010b; Li et al., 2008;Yao et al., 2008,2010; 刘启元等,2009;郭飚等,2009;Lei et al., 2009;Zhang et al., 2010;李昱等,2010;Chen et al., 2013; Liu et al., 2014).然而由于受台站分布的限制,有关青藏高原东南缘整体区域的高分辨率S波成像研究仍然不多.噪声层析成像在近年来迅速发展,与传统的天然地震面波成像方法相比,噪声层析成像不依赖天然地震的方位分布,可以获得较短周期的面波频散信息和较为密集的射线覆盖,因此能够对地壳内部进行高分辨率的成像.近年来,这一方法在很多地区得到了广泛 应用(Shapiro et al., 2005; Yao et al., 2008,2010; Fang et al., 2010; 房立华等,2013).
自2011 年3 月份以来,中国地震局地球物理研究所等单位在青藏高原东南缘布设了350套宽频带流动地震仪,平均台站间距约为35km(图 1).这是迄今为止在该地区布设的台站数量最多、密度最高的地震台阵.本文利用青藏高原东南缘地区流动地震台阵和固定地震台网557个宽频地震台的连续波形资料,采用背景噪声成像方法,获得了这一地区6~48 s的面波群速度分布图像.新的观测结果为研究青藏高原东南缘地壳和上地幔结构、构造边界、壳幔变形和耦合机制等重要问题提供了新的信息.
 |
图 1 青藏高原东南缘构造分区、断裂和台站分布图 白色三角为地震台站.黑线为块体边界,灰线为次级块体边界, CXB-川西北次级块体,DZB-滇中次级块体,NPB-南盘江盆地.Fig. 1 Sketch map of tectonic boundaries and seismic stations in the southeastern margin of the Tibetan Plateau White triangles represent seismic stations. Black and gray lines represent boundaries of blocks and subblocks respectively. CXB,Chuanxibei Subblock; DZB,Dianzhong Subblock; NPB,Nanpanjiang Basin. |
我们收集了青藏高原东南缘557个台站垂直分量的连续波形数据,这些台站包括吴忠良、丁志峰等承担的中国地震科学探测台阵一期的350个宽频带流动台站,观测时间为2011年10月初至2012年10月末;吴建平等负责在小江断裂带及周边地区布设的50个宽频带流动台站,观测时间为2009年1月初至12月;麻省理工学院和成都理工大学在川滇地区布设的25个流动台站,观测时间为2003年9月至2004年10月;以及青藏高原东南缘的132个固定台站(Zheng et al., 2010;郑秀芬等,2009),观测时间为2009年1月初至12月.台站分布如图 1所示.
本文采用的数据处理步骤与Bensen等(2007)类似,主要包括去线性趋势、去均值、去除仪器响应、带通滤波和降采样(2 Hz)处理.与One-bit时间域归一化方法不同,我们采用了Shen等(2012)提出的频率-时间域正则化方法,这种方法解决了传统方法中无法得到均衡能量谱的问题.其基本原理为
 |
图 2 滤波频带宽度为0.02~0.25 Hz,部分台站对之间的互相关波形. 其中横坐标为互相关延时,纵坐标为台站对之间的距离Fig. 2 Cross-correlation waveforms filtered with a Butterworth filter at 0.02~0.25 Hz. The horizontal axis gives the lag time of cross-correlations; the vertical axis represents distances between stations |
本研究采用Herrmann和Ammon(2002)基于多重滤波方法开发的CPS软件来测量基阶瑞利面波的群速度频散曲线,共得到13972条频散曲线.为了获得可靠的面波成像结果,我们对这些频散曲线进行了筛选,要求台站间距大于3倍波长(Bensen等,2007)且不小于180 km.同时使用群簇分析方法(Fang et al., 2010; Wang et al., 2014)提高所选取的频散曲线的可靠性和射线覆盖的均匀性,最终挑选出6023条频散曲线.图 3为各个周期用于面波成像的射线路径数量.
 |
图 3 不同周期用于反演的射线路径的数目,横坐标代表面波群速度周期,纵坐标代表射线路径的数量Fig. 3 Ray path numbers at different periods. The abscissa represents periods and the ordinate denotes ray path numbers |
在反演瑞利波群速度时,本文采用Ditmar和Yanovskaya(1987),Yanovskaya和Ditmar(1990)提出的面波层析成像方法.它是在Tikhonov正则化方法框架下同时满足多条限制条件时求解群速度分布的一种方法,其数学表达如下所示:
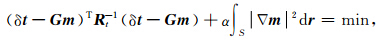
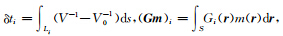 ,m(x,y)=(V-1-V-10)V0,Rt为数据协方差矩阵,α为正则化参数.在本文反演过程中,我们分别测试了 1°×1°,0.5°×0.5°,0.25°×0.25°三个网格尺度,发现1°×1°的分辨率分布和0.5°×0.5°的基本一致,而 0.25°×0.25°分辨率明显较差,因此最终选定了0.5°×0.5° 的网格剖分;正则化参数α为权衡模型光滑程度和数据误差的参数,经过多次尝试,取值为0.2,可使模型较为平滑且误差较小.反演过程中,每次迭代完成之后,计算每条路径的走时残差及所有走时残差的均方根.选择走时残差小于3倍均方根的频散曲线进行下一次迭代反演.
3 反演结果
,m(x,y)=(V-1-V-10)V0,Rt为数据协方差矩阵,α为正则化参数.在本文反演过程中,我们分别测试了 1°×1°,0.5°×0.5°,0.25°×0.25°三个网格尺度,发现1°×1°的分辨率分布和0.5°×0.5°的基本一致,而 0.25°×0.25°分辨率明显较差,因此最终选定了0.5°×0.5° 的网格剖分;正则化参数α为权衡模型光滑程度和数据误差的参数,经过多次尝试,取值为0.2,可使模型较为平滑且误差较小.反演过程中,每次迭代完成之后,计算每条路径的走时残差及所有走时残差的均方根.选择走时残差小于3倍均方根的频散曲线进行下一次迭代反演.
3 反演结果 使用上述层析成像方法,我们反演得到了6~48 s周期的群速度分布图像.图 4(a—f)分别为6 s,14,20,24,30 s和48 s周期的群速度分布图像,图 5(a—f)为对应上述6个周期的分辨率.在图 5中可以看出大部分地区的横向分辨率在60 km以内,研究区的中心区域,由于射线分布密集,分辨率优于40 km.
 |
图 4 青藏高原东南缘各周期瑞利面波群速度分布图 黑色实线为断裂,F1 龙门山断裂带,F2 龙泉山断裂,F3 华蓥山断裂,F4 鲜水河断裂,F5 大凉山断裂,F6 则木河断裂,F7 安宁河断裂, F8 小江断裂带,F9 弥勒断裂,F10 红河断裂带,F11 丽江—小金河断裂,F12 甘孜—理塘断裂,F13 理塘—德巫断裂.Fig. 4 Rayleigh wave group velocity maps at different periods in the southeastern margin of the Tibetan Plateau Black lines represent faults. F1,Longmenshan Fault Zone; F2,Longquanshan Fault; F3,Huayingshan Fault; F4,Xianshuihe Fault; F5,Daliangshan Fault; F6,Zemuhe Fault; F7,Anninghe Fault; F8,Xiaojiang Fault Zone; F9,Mile Fault; F10,Red River Fault Zone; F11,Lijiang-Xiaojinhe Fault; F12,Ganzi-Litang Fault; F13,Litang-Dewu Fault. |
 |
图 5 各周期瑞利面波群速度层析成像分辨率图Fig. 5 Resolution maps of Rayleigh wave group velocity tomography |
瑞利面波群速度对S波速度比较敏感,不同周期的瑞利面波反映了不同深度范围的S波速度特征,周期越长穿透深度越大.我们计算了基阶瑞利面波群速度对横波速度的敏感核(图 6),速度模型参考Wang等(2014).地壳厚度设为46 km,地壳内分为4层,上地幔采用AK135模型.
 |
图 6(a)计算敏感核所用模型参数,横坐标为参数数值大小,纵坐标为深度;(b)各周期基阶瑞利面波群速度对 横波速度结构的敏感核,横坐标为群速度对横波的导数值,纵坐标为深度Fig. 6(a)Model parameters used in sensitivity kernel calculation. The horizontal axis represents parameters corresponding to P-wave velocity,S-wave velocity and density. The vertical axis represents depth.(b)Depth sensitivity kernels of fundamental Rayleigh wave group velocity with respect to shear wave velocity structure at different periods. The x-axis represents values of derivative of group velocities with respect to shear velocities. The y-axis represents depth. |
周期为6s的群速度(图 4a)对5~7 km深度的S波速度较为敏感,主要反映地壳浅部的结构.图 4a中四川盆地、楚雄盆地和兰坪—思茅盆地等表现为低速异常,沿弥勒断裂至黔西一带也存在低速异常,其中四川盆地的低速异常面积最大、速度值最低.在四川盆地内部,龙泉山断裂带和华蓥山断裂带之间的川中丘陵西部群速度相对较高.在石棉西侧、理塘—德巫断裂带以东,以及研究区的西侧表现为明显的高速异常.攀枝花向东至昭通附近也有零散的高速异常体分布.
周期为14 s的群速度(图 4b)对8~15 km深度的S波速度较为敏感.14 s周期的群速度分布图像与6 s的相似,但整体速度值增大.沉积盆地仍然表现为低速异常,西南部盆地间的低速异常连成一体,范围明显扩大.四川盆地内华蓥山断裂带西侧存在与之平行的弱相对高速异常.攀枝花至昭通的高速异常明显呈现近东西走向带状分布的特点.理塘—德巫断裂带东侧的高速异常范围增大,北西端一直到研究区域的边界,南东端到达西昌.
周期为20~24 s的群速度(图 4c,d)对10~30 km深度的S波速度结构较为敏感(图 6),群速度分布图像主要体现了中下地壳结构横向变化特征.图中研究区西南部为大范围的低速异常,速度值低于14 s周期的速度.小江断裂带中部存在横跨断裂带的低速异常,其东南边界为南盘江盆地所限.攀枝花及其周边仍然显示为高速异常,与丽江—小金河断裂带西北侧的低速异常形成鲜明对比.
周期为30 s(图 4e)和48 s(图 4f)的群速度主要对深度20~70 km的S波速度结构比较敏感,其速度分布特征与下地壳和上地幔结构有关.低速异常主要分布在松潘—甘孜褶皱带、川滇菱形块体的西部,以及小江断裂带附近.四川盆地和南盘江盆地表现为高速异常,且后者的异常幅度要远大于前者.接收函数研究表明,研究区域的地壳厚度从东南方向的30 km左右向西北逐渐增厚至~70 km(Xu et al., 2007;Wang et al., 2010a),地壳厚度的横向变化是影响这两个周期速度分布的主要因素. 4 讨论
在四川盆地,6~20 s周期的群速度表现为明显的低速异常和很强的横向不均匀性.四川盆地内部主要沉积盖层为侏罗系和白垩系(Yokoyama et al., 2001),盆地周边造山带出露的主要是三叠纪或更老的地层(程裕淇,2004).四川盆地厚度较大、 相对年轻的沉积盖层是导致低速异常的主要原因. 地质研究表明,四川盆地曾经历过复杂的沉积演化过程,三叠纪至白垩纪的盆地沉积主要受周边各造山带逆冲推覆作用的控制,在推覆体前缘的盆地形变带内形成沉积中心,接受周边的风化剥蚀物,最终造成边缘沉积层厚度大于盆地中心.侏罗纪和白垩纪四川盆地北部及西北部的沉降幅度最大,与短周期群速度揭示的低速区存在较好的一致性.与之前的研究相比(Zhang et al., 2010,2013;Xu et al., 2007;Yao et al., 2008;Liu et al., 2014),本研究给出了四川盆地内部更高分辨率的群速度分布.6~20s周期群速度分布表现出的西部和北部速度低、中部和东南速度相对较高的特征,较好地揭示四川盆地内部沉积层厚度的横向变化.
在30~48 s周期,四川盆地的群速度值明显高于青藏高原及周边造山带.根据不同周期群速度的敏感深度分布,这两个周期主要对20~70 km的S波速度比较敏感,可以推测四川盆地中下地壳和上地幔的S波速度明显高于青藏高原地区.四川盆地西部的群速度不仅比中东部地区低,而且还存在其北部相对较高、南部相对较低的特征,表明下地壳和上地幔速度结构可能存在明显的横向差异.从短周期群速度分布看,北部比南部的低,因此在30~48 s周期南部速度相对较低的特征并不是由于中上地壳S波速度较低造成的.接收函数研究揭示,该地区北部和南部具有相近的地壳厚度(Hu et al., 2011).可见较低的群速度也不是由地壳厚度差异造成.因此推断,该低速异常是由下地壳和上地幔的相对低速结构引起.该地区上地幔范围内相对较低的地震波速度在远震层析成像中也被观测到(Yang et al., 2014),并认为青藏高原东部地区低速上地幔物质可能侵蚀了四川盆地的一部分岩石圈地幔.
地质研究表明,四川盆地西南地区上地壳存在新生代褶皱、断裂地质构造活动和明显的地壳缩短(Hubbard and Shaw, 2009).接收函数研究揭示四川盆地西部在成都以南泊松比为0.28~0.33,而以北大多小于0.26(王椿镛等,2010).影响介质泊松比的主要因素包括物质组分和温度等,温度的增加可以导致泊松比增高.地热研究表明在川西成都以南的地表热流约为60 mW·m-2,并且向西南逐渐增加,而成都以北约为45 mW·m-2(徐明等,2011).鉴于上述多种地质地球物理观测证据,我们推测四川盆地西南地区相对西北部地区下地壳和上地幔较低的S波速度,是由相对较高的温度引起的.温度的升高,不仅使下地壳,也使上地壳介质强度降低,在青藏高原物质的挤压作用下,其更易发生地壳缩短和断裂、褶皱等构造活动.
在攀枝花及其周边区域不同周期的群速度均表现为相对高速的特征.在6 s到24 s,此高速异常为近东西走向,西起攀枝花以西东至昭通以东;在30 s到48 s,高速异常呈北东—南西向,并逐渐收缩于攀枝花附近.短周期高速异常意味着浅层存在高速、高密度岩石.区域地质和地球化学研究表明(徐义刚和钟孙霖,2001),在晚二叠世263~251 Ma期间,华南块体西部云南、四川和贵州三省境内发生了著名的峨眉山大火成岩省岩浆活动,其动力作用模式很 可能与地幔柱活动有关,壳内岩浆岩侵入体的物质来源与喷发玄武岩一致,都来自于深部地幔(Xu et al., 2001).由穹窿构造和玄武岩厚度分布揭示的地幔柱活动中心位于攀枝花附近(沈传波等,2007;徐义刚和钟孙霖,2001).我们认为攀枝花附近由浅至深的高速异常,可能与地幔柱上升过程中岩石圈不同深度的高密度基性和超基性岩侵入体有关.
在印度板块和欧亚板块的碰撞过程中,高原物质发生侧向挤出和逃逸,川滇菱形块体是青藏高原 物质侧向逃逸的主要通道(Clark and Royden, 2000; Houseman and England ,1986; Tapponnier et al., 2001).川滇菱形块体分为北部的川西北次级块体和南部的滇中次级块体.在两个次级块体分界的丽江-小金河断裂带处,大地水准面和布格重力异常都发生了显著的变化(Jiménez-Munt et al., 2008). GPS观测的水平运动速度表明,川西北次级块体的东向分量平移速率为~9 mm·a-1,南向分量~13 mm·a-1;滇中次级块体的东向平移速率~5 mm·a-1,南向~11 mm·a-1(Shen et al., 2005).水平和垂直方向的差异运动也主要发生在分隔南北两个次级块体的丽江—小金河断裂带两侧附近(何宏林等,1993).Chen等(2010)给出的瑞利波和勒夫波群速度分布同样在此断裂带处发生明显变化.我们的结果中14 s、20 s的层析成像结果表明,在丽江—小金河断裂带南侧存在高速异常,且异常体展布与断裂带走向基本平行.在20 s以上周期,高速异常体缩小在攀枝花附近,从中上地壳至下地壳和上地幔似乎存在向下延伸的根.攀枝花附近的高速异常,在体波层析成像中也可以被观测到(吴建平等,2013).我们推测从上地壳延伸至地幔的攀枝花高速异常体是滇中次级块体相对于川西北次级块体具有更大力学强度的原因(Chen et al., 2013),同时它还导致北部物质东南方向的运动受到一定程度的阻碍,致使川西北次级块体快速隆升,海拔远高于南部的滇中次级块体.
从24 s开始,研究区域东南部出现明显的高速异常,且异常范围随周期增大而增大.在30 s周期,高速异常体与南盘江盆地的范围基本一致,北部边界大致与南盘江一致,表明南盘江盆地与华南块体西部其他区域的深部结构存在明显差异.为了揭示南盘江盆地与周边区域的深部结构差异,我们计算了南盘江两侧不同区域范围内的平均群速度频散曲线,使用阻尼最小二乘线性化反演方法(Herrmann and Ammon, 2002)进行了S波速度结构的反演.地壳厚度由接收函数方法确定,在反演过程中固定不变.图 7给出了两个区域的平均S波速度结构.可以看出,从地壳浅部至上地幔顶部南盘江盆地的S波速度均高于华南块体西南其他区域的速度值,特别是在中下地壳速度差异非常明显.因此,推测南盘江盆地高速异常体可能具有和四川盆地相似的性质,对青藏高原物质东南向的逃逸起到了阻挡作用,导致其西侧地壳物质主要向南部运动(Shen et al., 2005).
 |
图 7 南盘江两侧不同区域的平均频散曲线拟合结果和反演得到的S波速度结构 (a)两个区域的平均频散曲线(三角)和其拟合曲线(实线);横坐标为面波周期,纵坐标为群速度.(b)反演的S波速度结构;横坐标为S波速度,纵坐标为深度.Fig. 7 The average dispersion curves with their fitting results and the inverted S wave velocity structures at both sides of Nanpanjiang (a)Average dispersion curves(triangles) and their fitting curves(solid lines)of these two regions. The horizontal axis represents periods of surface wave; the vertical axis denotes group velocities.(b)S wave velocity structures. The x-axis gives the S-wavevelocities; the y-axis denotes depth. |
本文利用青藏高原东南缘557个地震台站记录的垂直向连续波形资料,基于改进的背景噪声数据处理流程,采用噪声层析成像方法获得了6~48 s的瑞利面波群速度分布图像.与之前的研究相比,本文以较高的横向分辨率揭示了一些新的速度异常分布特征,并对其成因和机制进行了分析.本文的主要结论如下:
四川盆地内部短周期的低速异常及其不均匀分布与四川盆地的演化过程密切相关.四川盆地内部相对周边造山带较年轻的沉积地层是导致低速异常的主要原因.速度分布的强烈不均匀性与盆地内部侏罗纪以来的差异沉降和沉积有关,沉积层总厚度在四川盆地北部和西北部地区最大.在30~48 s周期,龙门山断裂以东的四川盆地西部群速度存在南部低北部高的分布特征,可能是盆地西南部地区中下地壳和上地幔温度较高引起的.温度的增高进一步降低了地壳的力学强度,在新生代以来青藏高原物质向东挤压过程中,导致盆地内部发生上地壳褶皱、断裂和缩短等构造活动.
攀枝花及其周边上地壳至上地幔深度表现出的高速异常,可能与地幔柱成因的峨眉山大火成岩省的岩浆活动有关.地幔柱上升的过程中,岩石圈不同深度赋存大量的镁铁质和超镁铁质岩浆,冷却结晶后形成高速异常体.它在中上地壳位于滇中次级块体北缘、深部收缩至攀枝花附近,具有相对较大的力学强度,对青藏高原物质的侧向挤出起到一定的阻挡作用,可能是丽江—小金河断裂两侧水平与垂直差异运动和巨大高程差异的重要原因.
研究区域东南端的高速异常与南盘江盆地的范围一致,表明南盘江盆地与华南块体西南部其他区域的深部结构存在明显差异.推测具有中下地壳高S波速度的南盘江盆地,对青藏高原物质东南向逃逸起到了阻挡作用,可能是高原物质没有进一步沿着红河断裂带向东南方向运动的重要因素.
致谢 感谢中国地震台阵数据中心、中国地震台网 备份中心、美国地震研究联合会(IRIS)数据中心提 供的连续波形数据.对圣彼得堡大学T. B. Yanovskaya 提供面波层析成像程序表达诚挚的谢意.两位审稿专家对本文提出的诸多宝贵建议,使文章增色不菲,在此一并表示感谢.| [1] | Allegre C J, Courtillot V, Tapponnier P, et al. 1984. Structure and evolution of the Himalaya-Tibet orogenic belt. Nature, 307(5946): 17-22, doi: 10.1038/307017a0. |
| [2] | Bensen G D, Ritzwoller M H, Barmin M P, et al. 2007. Processing seismic ambient noise data to obtain reliable broad-band surface wave dispersion measurements. Geophys. J. Int., 169(3): 1239-1260, doi: 10.1111/j.1365-246X.2007.03374.x. |
| [3] | Chen J H, Liu Q Y, Li S C, et al. 2009. Seismotectonic study by relocation of the Wenchuan Ms8.0 earthquake sequence. Chinese J. Geophys. (in Chinese), 52(2): 390-397. |
| [4] | Chen Y, Badal J, Hu J F. 2010. Love and Rayleigh wave tomography of the Qinghai-Tibet Plateau and surrounding areas. Pure Appl. Geophys., 167(10): 1171-1203, doi: 10.1007/s00024-009-0040-1. |
| [5] | Chen Y, Zhang Z J, Sun C Q, et al. 2013. Crustal anisotropy from Moho converted Ps wave splitting analysis and geodynamic implications beneath the eastern margin of Tibet and surrounding regions. Gondwana Res., 24(3-4): 946-957. |
| [6] | Cheng Y Q. 2004. The Geology Map of China. 2nd ed. (in Chinese). Beijing: Geological Publishing House. |
| [7] | Clark M K, Royden L H. 2000. Topographic ooze: Building the eastern margin of Tibet by lower crustal flow. Geology, 28(8): 703-706, doi: 10.1130/0091-7613(2000)28〈703:tobtem〉2.0.co;2. |
| [8] | Deng W Z, Chen J H, Guo B, et al. 2014. Fine velocity structure of the Longmenshan fault zone by double-difference tomography. Chinese J Geophys (in Chinese), 57(4): 1101-1110, doi: 10.6038/cjg20140408. |
| [9] | Ditmar P G, Yanovskaya T B. 1987. A generalization of the Backus-Gilbert method for estimation of lateral variations of surface wave velocities. Izv. Akad. Nauk. SSSR, Fiz. Zeml. (in Russian), 6: 30-60. |
| [10] | Fang L H, Wu J P, Ding Z F, et al. 2010. High resolution Rayleigh wave group velocity tomography in North China from ambient seismic noise. Geophys. J. Int., 181(2): 1171-1182, doi: 10.1111/j.1365-246X.2010.04571.x. |
| [11] | Fang L H, Wu J P, Wang W L, et al. 2013. Love wave tomography from ambient seismic noise in North-China. Chinese J. Geophys. (in Chinese), 56(7): 2268-2279, doi: 10.6038/cjg20130714. |
| [12] | Guo B, Liu Q Y, Chen J H, et al. 2009. Teleseismic P-wave tomography of the crust and upper mantle in Longmenshan area, west Sichuan. Chinese J. Geophys. (in Chinese), 52(2): 346-355. |
| [13] | He H L, Fang Z J, Li P. 1993. A preliminary approach to the fault activity of southern segment on Xiaojiang west branch fault. Journal of Seismological Research (in Chinese), 16(3): 291-298. |
| [14] | Herrmann R B, Ammon C J. 2002. Computer Programs in Seismology version 3.20: Surface Waves, Receiver Functions, and Crustal Structure. Missouri: St. Louis University. |
| [15] | Houseman G, England P. 1986. Finite strain calculations of continental deformation: 1. Method and general results for convergent zones. J. Geophys. Res.-Solid Earth, 91(B3): 3651-3663, doi: 10.1029/JB091iB03p03651. |
| [16] | Hu J F, Xu X Q, Yang H Y, et al. 2011. S receiver function analysis of the crustal and lithospheric structures beneath eastern Tibet. Earth Planet. Sci. Lett., 306(1-2): 77-85, doi: 10.1016/j.epsl.2011.03.034. |
| [17] | Huang J L, Zhao D P, Zheng S H. 2002. Lithospheric structure and its relationship to seismic and volcanic activity in southwest China. J. Geophys. Res., 107(B10): ESE 13-1-ESE 13-14, doi: 10.1029/2000jb000137. |
| [18] | Hubbard J, Shaw J H. 2009. Uplift of the Longmen Shan and Tibetan plateau, and the 2008 Wenchuan (M=7.9) earthquake. Nature, 458(7235): 194-197, doi: 10.1038/nature07837. |
| [19] | Jiménez-Munt I, Fernàndez M, Vergés J, et al. 2008. Lithosphere structure underneath the Tibetan Plateau inferred from elevation, gravity and geoid anomalies. Earth Planet. Sci. Lett., 267(1-2): 276-289, doi: 10.1016/j.epsl.2007.11.045. |
| [20] | Lei J S, Zhao D P, Su Y J. 2009. Insight into the origin of the Tengchong intraplate volcano and seismotectonics in southwest China from local and teleseismic data. J. Geophys. Res., 114(B5): B05302, doi: 10.1029/2008JB005881. |
| [21] | Li C, van der Hilst R D, Meltzer A S, et al. 2008. Subduction of the Indian lithosphere beneath the Tibetan Plateau and Burma. Earth Planet. Sci. Lett., 274(1-2): 157-168, doi: 10.1016/j.epsl.2008.07.016. |
| [22] | Li Y, Yao H J, Liu Q Y, et al. 2010. Phase velocity array tomography of Rayleigh waves in western Sichuan from ambient seismic noise. Chinese J. Geophys. (in Chinese), 53(4): 842-852, doi: 10.3969/j.issn.0001-5733.2010.04.009. |
| [23] | Liu F T, Liu J H, Zhong D L, et al. 2000. The subducted slab of Yangtze continental block beneath the Tethyan orogen in western Yunnan. Chinese Science Bulletin, 45(5): 466-472. |
| [24] | Liu Q Y, Li Y, Chen J H, et al. 2009. Wenchuan Ms8.0 earthquake: preliminary study of the S-wave velocity structure of the crust and upper mantle. Chinese J. Geophys. (in Chinese), 52(2): 309-319. |
| [25] | Liu Q Y, van der Hilst R D, Li Y, et al. 2014. Eastward expansion of the Tibetan Plateau by crustal flow and strain partitioning across faults. Nat. Geosci., 7(5): 361-365, doi: 10.1038/ngeo2130. |
| [26] | Molnar P, Tapponnier P. 1975. Cenozoic tectonics of Asia-effects of a continental collision. Science, 189(4201): 419-426, doi: 10.1126/science.189.4201.419. |
| [27] | Molnar P, Tapponnier P. 1978. Active tectonics of Tibet. J. Geophys. Res.-Solid Earth, 83(B11): 5361-5375, doi: 10.1029/JB083iB11p05361. |
| [28] | Royden L H, Burchfiel B C, King R W, et al. 1997. Surface deformation and lower crustal flow in eastern Tibet. Science, 276(5313): 788-790, doi: 10.1126/science.276.5313.788. |
| [29] | Shapiro N M, Campillo M, Stehly L, et al. 2005. High-resolution surface-wave tomography from ambient seismic noise. Science, 307(5715): 1615-1618, doi: 10.1126/science.1108339. |
| [30] | Shen Z K, Lü J N, Wang M, et al. 2005. Contemporary crustal deformation around the southeast borderland of the Tibetan Plateau. J. Geophys. Res.-Solid Earth, 110(B11): B1140, doi: 10.1029/2004jb003421. |
| [31] | Shen C B, Mei L F, Xu Z P, et al. 2007. Architecture and tectonic evolution of composite basin-mountain system in Sichuan Basin and its adjacent areas. Geotectonica et Metallogenia (in Chinese), 31(3): 288-299. |
| [32] | Shen Y, Ren Y, Gao H, et al. 2012. An improved method to extract very-broadband empirical Green's functions from ambient seismic noise. Bull. Seismol. Soc. Am., 102(4): 1872-1877, doi: 10.1785/0120120023. |
| [33] | Tapponnier P, Xu Z Q, Roger F, et al. 2001. Oblique stepwise rise and growth of the Tibet Plateau. Science, 294(5547): 1671-1677, doi: 10.1126/science.105978. |
| [34] | Wang C Y, Chan W W, Mooney W D. 2003. Three-dimensional velocity structure of crust and upper mantle in southwestern China and its tectonic implications. J. Geophys. Res., 108(B9): 2442, doi: 10.1029/2002jb001973. |
| [35] | Wang C Y, Chang L J, Lü Z Y, et al. 2007. The anisotrophy of the upper mantle in eastern Tibetan Plateau and related crust-mantle coupling model. Science in China (Series D) (in Chinese), 37(4): 495-503. |
| [36] | Wang C Y, Lou H, Lü Z Y, et al. 2008. S-wave crustal and upper mantle's velocity structure in the eastern Tibetan Plateau-deep environment of lower crustal flow. Science in China Series D: Earth Sciences (in Chinese), 51(2): 263-274. |
| [37] | Wang C Y, Zhu L P, Lou H, et al. 2010a. Crustal thicknesses and Poisson's ratios in the eastern Tibetan Plateau and their tectonic implications. J. Geophys. Res.-Solid Earth, 115(B11): B11301, doi: 10.1029/2010jb007527. |
| [38] | Wang C Y, Lou H, Yao Z X, et al. 2010. Crustal thicknesses and Poisson's ratios in Longmenshan mountains and adjacent regions. Quaternary Sciences (in Chinese), 30(4): 652-661, doi: 10.3969/j.issn.1001-7410.2010.04.02. |
| [39] | Wang W L, Wu J P, Fang L H, et al. 2014. S wave velocity structure in southwest China from surface wave tomography and receiver functions. J. Geophys. Res. Solid Earth, 119(2): 1061-1078, doi: 10.1002/2013jb010317. |
| [40] | Wang Z, Zhao D P, Wang J. 2010b. Deep structure and seismogenesis of the north-south seismic zone in southwest China. J. Geophys. Res., 115(B12): B12334, doi: 10.1029/2010jb007797. |
| [41] | Wu J P, Ming Y H, Wang C Y. 2001. The S wave velocity structure beneath digital seismic stations of Yunnan province inferred from teleseismic receiver function modelling. Chinese J. Geophys. (in Chinese), 44(2): 228-237, doi: 10.3321/j.issn:0001-5733.2001.02.010. |
| [42] | Wu J P, Yang T, Wang W L, et al. 2013. Three dimensional P-wave velocity structure around Xiaojiang fault system and its tectonic implications. Chinese J. Geophys. (in Chinese), 56(7): 2257-2267, doi: 10.6038/cjg20130713. |
| [43] | Xu Y G, Chung S L, Jahn B M, et al. 2001. Petrologic and geochemical constraints on the petrogenesis of Permian-Triassic Emeishan flood basalts in southwestern China. Lithos, 58(3-4): 145-168, doi: 10.1016/S0024-4937(01)00055-X. |
| [44] | Xu Y G, Chung S L. 2001. The Emeishan large igneous province: Evidence for mantle plume activity and melting conditions. Geochimica (in Chinese), 30(1): 1-9. |
| [45] | Xu L L, Rondenay S, van der Hilst R D. 2007. Structure of the crust beneath the southeastern Tibetan Plateau from teleseismic receiver functions. Phys. Earth Planet. Inter., 165(3-4): 176-193, doi: 10.1016/j.pepi.2007.09.002. |
| [46] | Xu M, Zhu C Q, Tian Y T, et al. 2011. Borehole temperature logging and characteristics of subsurface temperature in Sichuan Basin. Chinese J. Geophys. (in Chinese), 54(4): 1052-1060, doi: 10.3969/j.issn.0001-5733.2011.04.020. |
| [47] | Yang T, Wu J, Fang L, et al. 2014. Complex structure beneath the Southeastern Tibetan Plateau from teleseismic P-wave tomography. Bull. Seismol. Soc. Am., 104(3): 1056-1069, doi: 10.1785/0120130029. |
| [48] | Yanovskaya T B, Ditmar P G. 1990. Smoothness criteria in surface wave tomography. Geophys. J. Int., 102(1): 63-72, doi: 10.1111/j.1365-246X.1990.tb00530.x. |
| [49] | Yao H J, Beghein C, van der Hilst R D. 2008. Surface wave array tomography in SE Tibet from ambient seismic noise and two-station analysis—II. Crustal and upper-mantle structure. Geophys. J. Int., 173(1): 205-219, doi: 10.1111/j.1365-246X.2007.03696.x. |
| [50] | Yao H J, van der Hilst R D, Montagner J P. 2010. Heterogeneity and anisotropy of the lithosphere of SE Tibet from surface wave array tomography. J. Geophys. Res.Solid Earth, 115(B12): B12307, doi: 10.1029/2009jb007142. |
| [51] | Yokoyama M, Liu Y Y, Halim N, et al. 2001. Paleomagnetic study of Upper Jurassic rocks from the Sichuan basin: tectonic aspects for the collision between the Yangtze Block and the North China Block. Earth Planet. Sci. Lett., 193(3-4): 273-285, doi: 10.1016/s0012-821x(01)00498-8. |
| [52] | Zhang Z J, Yuan X H, Chen Y, et al. 2010. Seismic signature of the collision between the east Tibetan escape flow and the Sichuan Basin. Earth Planet. Sci. Lett., 292(3-4): 254-264, doi: 10.1016/j.epsl.2010.01.046. |
| [53] | Zhang P Z. 2013. A review on active tectonics and deep crustal processes of the Western Sichuan region, eastern margin of the Tibetan Plateau. Tectonophysics, 584: 7-22, doi: 10.1016/j.tecto.2012.02.021. |
| [54] | Zheng X F, Ouyang B, Zhang D N, et al. 2009. Technical system construction of Data Backup Centre for China Seismograph Network and the data support to researches on the Wenchuan earthquake. Chinese J. Geophys. (in Chinese), 52(5): 1412- 1417, doi: 10.3969/j.issn.0001-5733.2009.05.031. |
| [55] | Zheng X F, Yao Z, Liang J, et al. 2010. The role played and opportunities provided by IGP DMC of China National Seismic Network in Wenchuan earthquake disaster relief and researches. Bull. Seismol. Soc. Am., 100(5B): 2866-2872, doi: 10.1785/0120090257. |
| [56] | 陈九辉, 刘启元, 李顺成等. 2009. 汶川Ms8.0地震余震序列重新定位及其地震构造研究. 地球物理学报, 52(2): 390-397. |
| [57] | 程裕淇. 2004. 中国地质图 (第二版). 北京: 地质出版社. |
| [58] | 邓文泽, 陈九辉, 郭彪等. 2014. 龙门山断裂带精细速度结构的双差层析成像研究. 地球物理学报, 57(4): 1101-1110, doi: 10.6038/cjg20140408. |
| [59] | 房立华, 吴建平, 王未来等. 2013. 华北地区勒夫波噪声层析成像研究. 地球物理学报, 56(7): 2268-2279, doi: 10.6038/cjg20130714. |
| [60] | 郭飚, 刘启元, 陈九辉等. 2009. 川西龙门山及邻区地壳上地幔远震P波层析成像. 地球物理学报, 52(2): 346-355. |
| [61] | 何宏林, 方仲景, 李玶. 1993. 小江断裂带西支断裂南段新活动初探. 地震研究, 16(3): 291-298. |
| [62] | 李昱, 姚华健, 刘启元等. 2010. 川西地区台阵环境噪声瑞利波相速度层析成像. 地球物理学报, 53(4): 842-852, doi: 10.3969/j.issn.0001-5733.2010.04.009. |
| [63] | 刘福田, 刘建华, 何建坤等. 2000. 滇西特提斯造山带下扬子地块的俯冲板片. 科学通报, 45(1): 79-84. |
| [64] | 刘启元, 李昱, 陈九辉等. 2009. 汶川Ms8.0地震: 地壳上地幔S波速度结构的初步研究. 地球物理学报, 52(2): 309-319. |
| [65] | 沈传波, 梅廉夫, 徐振平等. 2007. 四川盆地复合盆山体系的结构构造和演化. 大地构造与成矿学, 31(3): 288-299. |
| [66] | 王椿镛, 常利军, 吕智勇等. 2007. 青藏高原东部上地幔各向异性及相关的壳幔耦合型式. 中国科学(D辑: 地球科学), 37(4): 495-503. |
| [67] | 王椿镛, 楼海, 吕智勇等. 2008. 青藏高原东部地壳上地幔S波速度结构—下地壳流的深部环境. 中国科学(D辑: 地球科学), 38(1): 22-32. |
| [68] | 王椿镛, 楼海, 姚志祥等. 2010. 龙门山及其邻区的地壳厚度和泊松比. 第四纪研究, 30(4): 652-661, doi: 10.3969/j.issn.1001-7410.2010.04.02. |
| [69] | 吴建平, 明跃红, 王椿镛. 2001. 云南数字地震台站下方的S波速度结构研究. 地球物理学报, 44(2): 228-237, doi: 10.3321/j.issn:0001-5733.2001.02.010. |
| [70] | 吴建平, 杨婷, 王未来等. 2013. 小江断裂带周边地区三维P波速度结构及其构造意义. 地球物理学报, 56(7): 2257-2267. |
| [71] | 徐明, 朱传庆, 田云涛等. 2011. 四川盆地钻孔温度测量及现今地热特征. 地球物理学报, 54(4): 1052-1060, doi: 10.3969/j.issn.0001-5733.2011.04.020. |
| [72] | 徐义刚, 钟孙霖. 2001. 峨眉山大火成岩省: 地幔柱活动的证据及其熔融条件. 地球化学, 30(1): 1-9. |
| [73] | 郑秀芬, 欧阳飚, 张东宁等. 2009. "国家数字测震台网数据备份中心"技术系统建设及其对汶川大地震研究的数据支撑. 地球物理学报, 52(5): 1412-1417, doi: 10.3969/j.issn.0001-5733.2009.05.031. |