 2015, Vol. 58


The method of spectral filtering was used to filter sampling noise in the EDA raw background error estimation. At first, an experimental EDA system was built based on the operational YH4DVAR analysis. This system consisted 10 lower resolution members generated by perturbing observations, sea surface temperature (SST) fields and model physical tendencies. Secondly, the vorticity background error of the 9th typhoon in 2013 calculated from 10, 20 and 30 members respectively were compared with the operational one. Though EDA estimates showed superiority to the later, its slow rate convergence of sampling noise with respect to ensemble size and the limited ensemble dimensions made the filtering process still necessary. Following Raynaud's theory, the sampling noise power spectrum was calculated from the expectation of the ensemble-based error covariance matrix. Then, a smooth spectral filter was applied to the 10 member raw estimate. The filter's truncation wave number was determined according to the typical horizontal length scales of noises and valuable signals. The filtered result was compared with 30 member raw estimate.
In this typhoon assimilation experiment, flow-dependent background error variances can be estimated accurately from the experimental EDA system with 10, 20 or 30 members. Corresponding to the operational one, the location of the maximum of vorticity background error on model level 91 is closer to the center position of typhoon, and its structure also exactly represents the uncertainty in the background state in this dynamically active areas. With similar structure, the difference between those estimates is the levels of sampling noise, the larger size the lower level. In operational context, it is reasonable to choose 10 members' estimate as the raw signal. After the spherical spectral transform, the separation in spectral space of the signal (10 member variance estimate) from the sampling noise power is clear up to about wavenumber 195. This corresponds to the definition of a truncation wavenumber (Ntrunc). Based on the Ntrunc, a smooth filtering is designed whose coefficient is close to 0 when wavenumber is equal or bigger than Ntrunc. Otherwise, the coefficient is a sinusoidal function of wavenumber. It enables us to get rid of some large oscillations in the raw filter whose coefficient is determined directly by the noise-to-signal ratio. The application of those low-pass filters in spectral space can be seen as a weighted spatial averaging technique in grid-point space, which enables the large-scale signal of interest to be extracted while filtering out the small-scale sampling noise effectively. The two filtered vorticity background error fields are similar in large-scale, but the smooth filter reveals a heavier filtering as coefficients beyond the Ntrunc are set to 0. Whatever, 10-members' filtered variances exhibit better performance than 30-members's estimations while saving computer resource obviously.
An ensemble data assimilation system is built to provide flow-dependent estimates of background error statistics for operational data assimilation YH4DVAR. A spectral filtering method is used to deal with the sampling noise caused by limited ensemble members. The employed smooth filter enables the large-scale signal of interest to be preserved while filtering out the small-scale sampling noise. For this reason, it can reduce the size of EDA system running in operational context. Further work is using heterogeneous filter that depends on the geographical position to deal with error structures of varying scales, and in particular to extract localised patterns of useful signal which is often smoothed out by smooth filter.
资料同化系统将观测资料和背景信息进行优化组合,为数值天气预报系统提供大气初始状态的最优估计值(钱维宏,2012;乐新安等,2010;林振山,1999).这一过程需要精确定义观测误差协方差矩阵 R和背景误差协方差矩阵B.但是,由于可用信息量少,维度大,对B的精确定义依然是资料同化领域的一大挑战.通常的处理方法是用静态的、均一的和各向同性的B模型取代真实的B(Mitchell et al., 1990;Courtier et al., 1998; Berre,2000;Weaver and Courtier, 2001).这些假设和简化能有效节省大量计算资源,简化矩阵运算,但无法反应出大气的时 空变化特征(Laroche et al., 1998;Derber and Bouttier, 1999). 因此大量研究开始尝试采用不同方法来获取 流依赖B(Evensen, 1994,Houtekamer and Mitchell, 1998;Buizza et al., 2005),比较典型的方法有NMC方法(Parrish and Derber, 1992)、蒙特卡洛方法(Fisher and Andersson, 2001)和集合资料同化(EDA)等(Houtekamer et al., 1996;Fisher,2003;Kalnay,2003; Pereira and Berre, 2006;Isaksen et al., 2006;Raynaud et al., 2009;Bonavita et al., 2011).其中EDA是通过扰动观测资料、边界条件和预报模式构造一组能够反映背景误差方差(背景误差协方差矩阵B的对角元素)统计信息的低分辨率扰动集合,并以此估算流依赖的背景误差方差.目前,国际上几大数值预报业务中心均设有EDA的业务模块,为确定性资料同化系统提供流依赖的背景误差方差,如欧洲中期天气预报中心(ECMWF)(Bonavita et al., 2011)、法国气象局(Berre and Desroziers, 2010)等.
EDA的关键是集合成员数的选择.由于EDA成员是通过随机扰动方法构造的,利用有限EDA成员统计背景误差方差时,估计值中通常包含有随机取样噪声,估计精度与集合成员数的均方根成正比(Pereira and Berre, 2006).理论上,为了消除随机取样噪声对估计值的影响,提高估计精度,可将集合成员数N无限扩大,但会导致计算量的N倍递增.为了满足业务时效性,一种解决方案是继续扩大计算资源和并行规模并利用FPGA、GPU等加速计算技术,在某种程度上可以允许计算更多的样本数,但由于估计精度的低收敛性限制了这一方案的实际效率;另一种行之有效的方案是发展计算量小的滤波方法,在保留有用信号的基础上,滤除估计值中的噪声,从而提高估计精度.
针对以上需求,Raynaud(Raynaud et al., 2008)于2008年根据噪声和信号的特征尺度发展了一种基于空间平均的低通滤波方法,以空间加权的方式来平滑高频、小尺度的随机噪声.经过上述方法处理后的10个样本背景误差方差估计值在精度上与50个样本的直接统计结果相当.但这种处理噪声方法的效能受模式变量、高度层等因素影响,且滤波过程中需要根据天气形势对平滑的尺度长度进行人为调整和优化,达不到业务化要求.2009年,Raynaud(Raynaud et al., 2009)对此进行了改良和优化,利用噪声与B矩阵之间的尺度关系,发展了一种自适应的谱滤波方法.其基本思想是根据信号和噪声能量在谱空间的分布特征定位出信噪分离的截断波数,由于噪声能量主要集中在波数较大的小尺度空间上,因此可以构造一个低通滤波器,滤除大于截断波数的高频小尺度噪声,对小于截断波数的大尺度噪声,则采用类似于Wiener 的线性处理方法(Wiener,1949).该方案一方面降低了对集合样本数的要求,减少了计算量,另一方面又显著提高了集合方差的估算精度(Bonavita et al., 2011,2012;Raynaud et al., 2008,2009).
本文首先介绍了谱滤波的基本原理和方法;其次在我国YH4DVAR业务同化系统上设计和构建了EDA试验平台和谱滤波模块,用10个EDA样本估算了2013年第九号台风“飞燕”影响区域的流依赖背景误差,并进行了相关的滤波试验和分析.最后为总结. 2 滤波原理
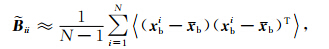
EDA通过扰动观测资料、海表温度和模式物理倾向项来表征观测、边界及模式物理过程的不确定性.多个表征误差分布特征的扰动初值,经模式积分得到的预报集合可统计出流依赖的背景误差(Parrish and Derber, 1992;Fisher,2003;Isaksen et al., 2006).但是EDA作为一种纯粹的随机方法,有限个成员统计得到的结果中包含了随机取样噪声.理论上,可将估计误差分解成为随机误差项和系统误差项两部分:

 是格点i和j之间的背景误差协方差统计值,Bij*代表真值,E-Bij*为系统误差项,是由扰动方法和模式的不完美性引起的(Isaksen et al., 2006;Fisher,2007),可通过集合误差-离散度诊断曲线进行校正(Palmer et al., 2009).-E(ij)为随机误差项,其中E(ij)为B矩阵的集合样本的数学期望.如果成员个数趋近于无穷,无限趋近Bij*,则随机噪声消除.但实际中,由于成员个数有限,随机噪声对估计值的影响不可忽略.Mallat(Mallat et al., 1998)和Raynaud(Raynaud et al., 2009)研究发现,取样噪声的协方差和集合误差协方差矩阵满足以下关系:
是格点i的背景误差方差的集合估计值,N是集合样本个数.由此计算得到噪声与背景误差之间的Daley长度尺度关系(Daley,1993)满足
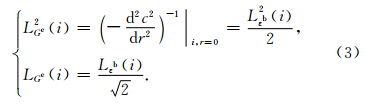
 *和集合估计方差转换到谱空间,并分别用*和表示.在谱空间中,格点空间的尺度可以用波数的大小表示,尺度越大(小),谱空间的波数越小(大),频率越低(高).根据等式(3)可知,随机取样噪声的能量谱主要集中在相对较高的频段,而误差方差的能量则主要集中在低频波段,因此通过构造一个简单的低通滤波器即可消除原始信号中的随机取样噪声(Berre et al., 2007).
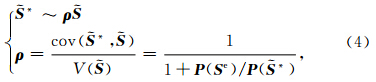
 *)= P()- P(S e)为无噪声方差能量谱,ρ为滤波系数,大小在[0,1]之间变化,反映了总能量中信号与噪声所占比重.ρ=1表明此波数上的方差估计值不包含噪声,ρ=0则表示方差估计值全部为噪声.等式(4)定义的滤波器称为原滤波器,其特点是滤波系数的大小完全由信号和噪声的能量决定,因此滤波系数随波数变化剧烈.
另一种滤波器采用以下经验形式的平滑滤波系数(Raynaud et al., 2009):
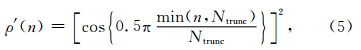
*)大小相当时所对应的波数.以下约定,对大于Ntrunc的信号称为小尺度信号,反之称为大尺度信号.波数Ntrunc在程序实现时可采用对照表方法来确定.这种滤波器称为平滑滤波器,最关键的参数为Ntrunc.两种滤波器的滤波过程是相同的,都是在计算出滤波系数后,将其作用到原估计值的能量谱上即可消除随机取样噪声.但是因滤波系数的定义不同,滤波效果有所区别,我们将在第四节进行详细讨论. 3 基于YH4DVAR系统的滤波试验
YH4DVAR是我国自主研发的全球四维变分资料同化系统,能够为全球中期和区域短期数值天气预报模式提供高质量的初值场(曹小群等,2008; Zhang et al., 2010;张卫民等,2012).目前该系统每天在00和12世界时运行两次,分辨率为T799L91.本文在此基础上采用以下配置来构造集合资料同化试验平台:
(1)为了减少计算量,选择TL399L91分辨率(谱三角截断波数为399、线性网格、91个混合坐标层),分别运行一个控制分析和30个扰动分析.
(2)对进入到同化系统之前的探空、地面、飞机、辐射率和GPS掩星弯曲角等探测资料进行扰动,扰动满足(0,R)的高斯分布.R为四维变分资料同化系统中指定的观测误差协方差矩阵.
(3)在预报模式中引入物理过程随机倾向扰动(SKEB),因此不需要再显示扰动背景场.
(4)四维变分的同化窗口设为12 h,配置两次最小化迭代,即两次外循环,第一次的分辨率设为T95,第二次的分辨率设为T159,第一个最小化迭 代次数固定为50次,第二次最小化迭代固定为30次.
(5)每天运行两次集合资料同化,晚上00时的同化使用了21UTC到09UTC时间窗口的观测资料.白天12时的同化使用09UTC到次日21UTC时间窗口的观测资料,控制和扰动分析采用与业务相同的质量控制方式,分析循环中模式积分长度为15 h.
一次循环过程如图 5所示,首先对进入到四维变分同化系统的三个输入量都进行扰动,其中背景场扰动是在数值预报模式中扰动物理过程倾向隐式实现的.其次,将第一步扰动方法构造的N组资料输入到四维变分同化系统中,处理后得到N个扰动的分析场;最后利用数值预报模式向前积分15 h得到背景场(预报场)集合成员.
 |
图 1 集合资料同化试验平台生成流依赖背景场集合成员的流程图Fig. 1 The process for ensemble of flow-dependent background fields generated by the experimental EnsembleData Assimilation system |
利用这些成员即可估计出流依赖的背景误差方差:
进行滤波处理的主要过程如下:
(1)根据等式(2),由业务采用的静态B来计算随机噪声能量谱 ,这里Trans表示格点到谱空间的转换操作.由于B的近似值是已知的,因此可以在EDA业务流程运行之前预先计算好.
(2)将方差转换到谱空间,并统计能量谱
(3)根据P()和P(Se)在谱空间中的分布特征计算原滤波器ρ(n)、截断波数Ntrunc和平滑滤波器ρ′(n).
(4)将原滤波系数或平滑滤波系数作用到P()上,实现谱滤波.
(5)将滤波处理好的 P f()转换到格点空间,滤波完成.
4 试验结果分析
4.1 EDA方法对背景误差的改进 为了验证EDA方法对背景误差的改进效果,采用上述EDA试验配置,分别用10、20、30个样本统计了2013年8月2日0900UTC时涡度场在第91模式层上的背景误差,并与YH4DVAR业务 “随机方法”进行了比较.“随机方法”是指从YH4DVAR 的静态B矩阵中随机取样生成标准偏差,其中所包含的流依赖特征只是通过非线性平衡方程和在背景场状态附近线性化的准地转Omega(垂直速度)方程得到(Fisher and Courtier, 1995;Kalnay,2003).
图 2a、2b、2c、2d分别是10、20、30个样本和随机方法统计得到的背景误差在东亚区域的分布情况.从图中可以看出,EDA方法统计得到的背景误差(图 2a,2b,2c)的最大值均位于海南省文昌市东南附近,正对应于我国2013年第九号台风“飞燕”的低压中心,而随机方法统计得到的背景误差在整个区域分布较为平滑,并没有反映出台风的结构和位置信息.如表 1所示,EDA背景误差最大值均超过 了12×10-5,是随机方法的6倍,且位置都位于(112°E,18°N)附近,接近台风低压的观测位置(111.2°E,19.2°N),其精度明显高于随机方法的最大值位置(120.93°E,15.40°N). 此外本文还计算了8月2日2100UTC、8月3日0900UTC等后续时次的背景误差,其结构和最大值均能与台风的变化对应起来,而业务采用的背景误差在此期间几乎没有变化.
以上分析表明EDA方法刻画出的背景误差具有随天气形势变化“流依赖”特性,有助于改善强对流天气影响区域的各种气象观测资料的质量控制决策能力,让更多“合法”的观测资料进入到同化系统中,最终提高对极端天气的预报能力.
4.2 样本个数对背景误差结构的影响 样本个数会影响EDA背景误差的结构.比较图 2a、 2b、 2c中背景误差方差的水平分布情况可以看出,三者的结构非常相似,但都带有不同程度的小尺度噪声,其中又以10个样本估计值居多,最少的是30个样本,即噪声尺度与集合成员数成反比.噪声降低了背景误差方差估计值的精度,使得方差估计值不能直接用到同化系统中,即需要进行滤波处理.
试验中,选用由10个样本直接估计的背景误差方差作为滤波对象,其原因在于10个样本的估算结果与30个样本估计值非常相似,除了噪声有所减少外,基本上无本质变化,背景误差随样本个数的变化已经接近或达到收敛.图 3给出10、20、30个样本统计得到散度标准,其比率(图 3b)最大值34.02%出现在11层约44.4 km高度,其可能原因在于该高层上不但具有较多的观测资料,且高空大气环流能在前15小时的模式积分中迅速传播初始扰动.
以上结果表明,10个成员集合能正确地刻画出背景误差的结构,这与Bonavita的试验结论非常吻合(Bonavita et al., 2012).谱滤波处理对象选用10个样本的统计值是合理的.
4.3 滤波结果 以10个EDA样本背景误差估计值作为研究 对象.图 4a 为10个样本估计值的能量谱P( 图 5给出了两种滤波结果,a图为平滑滤波,b图是原滤波.与原背景误差估计值(图 2a)相比,平滑滤波与原滤波在滤除小尺度噪声的同时,保留了原背景误差中有用信号,误差结构清晰度均好于30个样本估计值.所不同的是平滑滤波将N>Ntrunc的 滤波系数全部置零,从而使得N>Ntrunc上的原始信号都一并当做噪声处理.这种处理方式的优点是以损失小部分信号为代价滤除绝大部分噪声,提高了滤波效率.而原滤波器的滤波系数在N>Ntrunc时并不为零,在保留这些小尺度信号的同时也带入了大量的噪声,其滤波效果反而变差.另一方面,尽管平滑滤波是一种经验方法,但由于原滤波系数随波数变化较为剧烈,因此得到的背景误差的平滑性低于平滑滤波.
此外,利用相同方法处理了其他模式层上涡度、散度、温度等变量的背景误差估计值的随机噪声.限于篇幅,图 6只给出了涡度场截断波数随模式层的变化,可以看出,截断波数随着高度的上升逐渐变小,其原因在于高层大气没有受到地形、湍流的影响,流体尺度长度在整体上要大于低层的,相应的信号和噪声尺度也大于低层的.
5 结论
集合资料同化是YH4DVAR系统未来的发展方向之一,相关技术仍处在探索研究中.本文以YH4DVAR系统为基础构建了集合资料同化试验平台,利用10个成员计算了2013年第九号台风“飞燕”经过海南省文昌市附近时的背景误差,并成功地将谱滤波方法应用到背景误差处理中.试验结果表明,EDA获得的流依赖背景误差能正确反映台风影响区域的误差特性,结构特征和量级均明显优于业务随机方法的统计结果;缺点是因为估计中伴随了大量的小尺度随机取样噪声,从而降低了背景误差方差估计值的准确度.为了克服此问题,引入了谱滤波方法改进EDA背景误差方差的估计结果.谱滤波方法能够根据信号、噪声的能量谱关系计算出合理的截断波数,进一步构造低通滤波器消除集合估计值中的噪声.经处理后10样本的滤波结果优于30样本的未经滤波处理的统计结果.
但是谱滤波方法也具有一定的局限性.首先,噪声能量谱是利用气候态B估算得到的,精度和正确完全由B和集合成员数决定,由于B采用了静态近似处理,由此统计的随机取样噪声能量谱也是静态的定常量,不能反映误差局地变化较大的天气系统;其次,谱滤波通过在原始信号的谱系数乘上滤波系数将噪声滤除,在滤除噪声的同时,也在一定程度上削弱了信号,一些尺度特性非常小的背景误差方差可能被平滑掉;最后,作用在同一波数上的滤波系数是相同的,这等同于对格点空间中相同尺度的平滑处理在全球范围都是一致的,没有反映出局地特征.针对以上存在的局限性,有必要开展进一步研究,如发展非均匀滤波技术.此外,本文仅对背景误差方差项的随机取样噪声项处理进行了说明,统计背景误差的协方差则需要更多的EDA样本,其噪声处理也有所不同,需要进一步研究.
本文介绍的滤波方法及相关试验研究,有助于提高对集合资料同化方差滤波的认识,为我国数值天气预报EDA业务化设计和实现提供理论指导,具有一定的借鉴意义.

图 2 2013年8月2日0900 UTC第91模式层上涡度场背景误差,(a)、(b)、(c)分别为10、20、30个样本的EDA统计值,
(d)是随机方法统计值,单位10-5 s-1,间隔是0.7×10⁻⁵ s-1Fig. 2 St and ard deviations of voracity at model level 91,corresponding to 2 August 2013 at 0900 UTC. Unit: 0.7× 10⁻⁵ s-1. Raw estimates from 10,20,30 member ensemble separately for(a),(b) and (c); background errorestimate from the “r and omization” technique valid at the same time(d),contour: 0.7×10⁻⁵ s-1
![]()
表 1 图 1中背景误差的最大值及其位置,最后一列为台风中心位置的观测数据Table 1 The maximums and corresponding positions of background error according to Fig. 1 besides the center position of the typhoon from observation
图 3(a)不同样本个数的涡度场集合标准偏差的统计平均,(b)集合标准偏差均值与10个样本统计值的比率Fig. 3 Horizontal averages of st and ard deviations of voracity estimated with 10,20,30 members(a), and their ratios to 10 members(b),as a function of model level,valid on 2 August 2013 at 0900 UTC
)及噪声能量谱 P(Se).在波数N<100情况下,噪声能量占原始信号能量的比重小于30%,此时原始信号主要以较大尺度的方差信号为主;在波数N≥195时,波数所对应的尺度以噪声为主,几乎不存在有用的方差信号.根据Raynaud的理论(Raynaud et al., 2009),滤波后的残差为 ,为滤波系数,∈(ρ,ρ ′),其值的大小控制滤波强弱.因此采用形如公式(5)的平滑滤波,即可以削弱较大尺度上(N>195)噪声;也可完全滤除N≥195的小尺度噪声.图 4b给出了平滑滤波ρ′与原滤波ρ系数随波数的变化,可以看出两者在随波数变化趋势及大小方面非常相似.所不同的是,在N>195的波数上原滤波系数并不为零,因此原滤波器的滤波强度要小于平滑滤波.事实上,滤波的实质是格点空间的加权平均,滤波系数即为权重系数,它的大小决定了空间平均的范围,即长度尺度.将格点空间转换到谱空间后,空间尺度对应波数,将不同的滤波系数作用到谱系数上,从而可以实现滤波.

图 4 2013年8月2日0900 UTC第91模式层涡度场集合标准偏差,截断波数Ntrunc=195
(a)集合标准偏差的能量谱,黑线表示原始信号的能量谱,灰线为噪声能量谱;(b)平滑滤波(黑线)和原滤波系数(灰线). Fig. 4(a)Power spectra of ensemble st and ard deviations(full red line) and of the sampling noise(dashed black line)associated to the estimation of voracity variances at model level 91 with a 10- member ensemble,on 2th August 2013 at 0900 UTC. Unit: s-2. The resulting raw filter(dashed black line),the smoothed filter(full red line)obtained by equation 4 and 5 respectively

图 5 2013年8月2日0900 UTC第91模式层上涡度场背景误差滤波结果,处理对象为图 3a的10样本背景误差估计值,(a)为平滑滤波;(b)原滤波Fig. 5 St and ard deviations of vorticity near the surface,corresponding to 2 August 2013 at 09 UTC. Unit: 10-5 s-1.
Filtered result based on 10 members raw estimates same as Fig. 3 with(a)smooth filter and (b)raw filter

图 6 2013年8月2日09时91个模式层上的截断波数,处理对象为10样本背景误差估计值Fig. 6 Vertical profile of objective truncation wave number for the filtering of raw ensemble-based st and ard deviation of vorticity from 10 members,on 2th August2013 at 09 UTC
| [1] | Berre L. 2000. Estimation of synoptic and mesoscale forecast error covariances in a limited-area model. Mon. Wea. Rev., 128(3): 644-667. |
| [2] | Berre L, Pannekoucke O, Desroziers G, et al. 2007. A variational assimilation ensemble and the spatial filtering of its error covariances: Increase of sample size by local spatial averaging.// Proc. ECMWF Workshop on Flow-Dependent Aspects of Data Assimilation, 151-168. (Available from: http://www.ecmwf.int/publications/) |
| [3] | Berre L, Desroziers G. 2010. Filtering of background error variances and correlations by local spatial averaging: A review. Mon. Wea. Rev., 138(10): 3693-3720. |
| [4] | Bonavita M, Raynaud L, Isaksen L. 2011. Estimating background-error variances with the ECMWF Ensemble of Data Assimilations system: some effects of ensemble size and day-to-day variability. Quart. J. Roy. Meteor. Soc., 137(655): 423-434. |
| [5] | Bonavita M, Isaksen L, Hólm E. 2012. On the use of EDA background error variances in the ECMWF 4D-Var. Quart. J. Roy. Meteor. Soc., 138(667): 1540-1559. |
| [6] | Buizza R, Houtekamer P L, Pellerin G, et al. 2005. A comparison of the ECMWF, MSC, and NCEP global ensemble prediction systems. Mon. Wea. Rev., 133(5): 1076-1097. |
| [7] | Cao X Q, Huang S X, Du H D. 2008. The new method of modeling horizontal error functions in variational assimilation with orthogonal wavelet. Acta Physica Sinica (in Chinese), 57(3): 1984-1989. |
| [8] | Courtier P, Andersson E, Heckley W, et al. 1998. The ECMWF implementation of three-dimensional variational assimilation (3D-Var). I: Formulation. Quart. J. Roy. Meteor. Soc., 124(550): 1783-1807. |
| [9] | Daley R. 1993. Atmospheric Data Analysis. Cambridge: Cambridge University Press. |
| [10] | Derber J, Bouttier F. 1999. A reformulation of the background error covariance in the ECMWF global data assimilation system. Tellus A, 51(2): 195-221. |
| [11] | Evensen G. 1994. Sequential data assimilation with a nonlinear quasi-geostrophic model using Monte Carlo methods to forecast error statistics. J. Geophys. Res., 99(C5): 10143-10162. |
| [12] | Fisher M, Courtier P. 1995. Estimating the covariance matrices of analysis and forecast error in variational data assimilation. ECMWF Tech. Memo. No. 220. 1-29. (Available from: http://www.ecmwf.int/publications/). |
| [13] | Fisher M, Andersson E. 2001. Developments in 4D-Var and Kalman filtering: ECMWF Tech. Memo. No. 347. (available from European Centre for Medium-Range Weather Forecasts, Shinfield Park, Reading, Berkshire RG2 9AX, UK). |
| [14] | Fisher M. 2003. Background error covariance modelling.// Proc. ECMWF Seminar on Recent Development in Data Assimilation for Atmosphere and Ocean, 45-63. (Available from: http://www.ecmwf.int/publications/). |
| [15] | Fisher M. 2007. The sensitivity of analysis errors to the specification of background error covariances.// Proc. ECMWF Workshop on Flow-Dependent Aspects of Data Assimilation, 27-36. (Available from: http://www.ecmwf.int/publications/). |
| [16] | Houtekamer P L, Lefaivre L, Derome J, et al. 1996. A system simulation approach to ensemble prediction. Mon. Wea. Rev., 124(6): 1225-1242. |
| [17] | Houtekamer P L, Mitchell H L. 1998. Data assimilation using an ensemble Kalman filter technique. Mon. Wea. Rev., 126(3): 796-811. |
| [18] | Isaksen L, Fisher M, Berner J. 2006. Use of analysis ensembles in estimating flow-dependent background error variances.// Proc. ECMWF Workshop on Flow-Dependent Aspects of Data Assimilation, 65-86. (Available from: http://www.ecmwf.int/publications/). |
| [19] | Kalnay E. 2003. Atmospheric Modeling, Data Assimilation and Predictability. Cambridge: Cambridge University Press. |
| [20] | Laroche S, Gauthier P. 1998. A validation of the incremental formulation of 4D variational data assimilation in a nonlinear barotropic flow. Tellus A, 50(5): 557-572. |
| [21] | Lin Z S. 1999. The discuss of the predictability of climatic or atmospheric system. Chinese J. Geophys. (in Chinese), 42(S1): 13-17. |
| [22] | Mallat S, Papanicolaou G, Zhang Z F. 1998. Adaptive covariance estimation of locally stationary processes. Ann. Statist., 26(1): 1-47. |
| [23] | Mitchell H L, Charette C, Chouinard C, et al. 1990. Revised interpolation statistics for the Canadian data assimilation procedure: Their derivation and application. Mon. Wea. Rev., 118(8): 1591-1614. |
| [24] | Palmer T N, Buizza R, Doblas-Reyes F, et al. 2009. Stochastic Parametrization and Model Uncertainty. ECMWF Tech. Memo. No. 598. (available from European Centre for Medium-Range Weather Forecasts, Shinfield Park, Reading, Berkshire RG2 9AX, UK). |
| [25] | Parrish D F, Derber J C. 1992. The National Meteorological Center's spectral statistical-interpolation analysis system. Mon. Wea. Rev., 120(8): 1747-1763. |
| [26] | Pereira M B, Berre L. 2006. The use of an ensemble approach to study the background error covariances in a global NWP model. Mon. Wea. Rev., 134(9): 2466-2489. |
| [27] | Qian W H. 2012. How to improve the skills of weather and climate predictions. Chinese J. Geophys. (in Chinese), 55(5): 1532-1540, doi: 10.6038/j.issn.0001-5733.2012.05.010. |
| [28] | Raynaud L, Berre L, Desroziers G. 2008. Spatial averaging of ensemble-based background-error variances. Quart. J. Roy. Meteor. Soc., 134(633): 1003-1014. |
| [29] | Raynaud L, Berre L, Desroziers G. 2009. Objective filtering of ensemble-based background-error variances. Quart. J. Roy. Meteor. Soc., 135(642): 1177-1199. |
| [30] | Weaver A, Courtier P. 2001. Correlation modelling on the sphere using a generalized diffusion equation. Quart. J. Roy. Meteor. Soc., 127(575): 1815-1846. |
| [31] | Wiener N. 1949. Extrapolation, Interpolation, and Smoothing of Stationary Time Series. Cambridge, MA: MIT Press. |
| [32] | Yue X A, Wan W X, Liu L B, et al. 2010. Development of an ionospheric numerical assimilation nowcast and forecast system based on Gauss-Markov Kalman filter: An observation system simulation experiment taking example for China and its surrounding area. Chinese J. Geophys. (in Chinese), 53(4): 787-795, doi: 10.3969/j.issn.0001-5733.2010.04.003. |
| [33] | Zhang W M, Cao X Q, Xiao Q N, et al. 2010. Variational Data Assimilation Using Wavelet Background error covariance: Initialization of typhoon KAEMI(2006). J. Trop Meteorol, 16(4): 333-340. |
| [34] | Zhang W M, Cao X Q, Song J Q. 2012. Design and implementation of four-dimensional variational data assimilation system constrained by the global spectral model. Acta Physica Sinica (in Chinese), 61(24): 249202-249214. |
| [35] | 曹小群, 黄思训, 杜华栋. 2008. 变分同化中水平误差函数的正交小波模拟新方法. 物理学报, 57(3): 1984-1989. |
| [36] | 林振山. 1999. 大气(气候)系统可预报性问题的讨论. 地球物理学报, 42(S1): 13-17. |
| [37] | 钱维宏. 2012. 如何提高天气预报和气候预测的技巧. 地球物理学报, 55(5): 1532-1540, doi: 10.6038/j.issn.0001-5733.2012.05.010. |
| [38] | 乐新安, 万卫星, 刘立波等. 2010. 基于Gauss-Markov卡尔曼滤波的电离层数值同化现报预报系统的构建: 以中国及周边地区为例的观测系统模拟试验. 地球物理学报, 53(4): 787-795, doi: 10.3969/j.issn.0001-5733.2010.04.003. |
| [39] | 张卫民, 曹小群, 宋君强. 2012. 以全球谱模式为约束的四维变分资料同化系统YH4DVAR的设计和实现. 物理学报, 61(24): 249202-249214. |