 2015, Vol. 58


2. 四川赛思特科技有限责任公司, 成都 610041;
3. 地震动力学国家重点实验室, 中国地震局地质研究所, 北京 100029;
4. 中国地震局地质研究所, 北京 100029
2. Sichuan Seistech Corporation Ltd., Chengdu 610041, China;
3. State Key Laboratory of Earthquake Dynamics, Institute of Geology, China Earthquake Administration, Beijing 100029, China;
4. Institute of Geology, China Earthquake Administration, Beijing 100029, China
1 引言
据中国地震台网(CENC)测定,2014年11月22日16时55分25.5秒,四川省甘孜藏族自治州康定县发生M6.3级地震,其后于11月25日23时19分07.1秒,在M6.3级地震震中东南约10 km处再次发生M5.8级地震;美国地质调查局(USGS)也给出了这两次地震的震源参数,见表 1.
|
|
表 1 CENC和USGS给定的康定M6.3、M5.8级地震震源参数 Table 1 Source parameters of the M6.3 and M5.8 Kangding earthquakes from CENC and USGS |
康定M6.3级地震发生在川滇块体北东边界鲜水河断裂带中南段(见图 1a). 鲜水河断裂带位于青藏高原东缘、南北地震带中段,起源于青藏高原(Molnar and Deng, 1984),形成于松潘—甘孜造山带造山作用后期(王宗秀等,1996),是分割川滇块体与巴颜喀拉块体的一条呈弧形的大型活动断裂带(Allen et al., 1991)(图 1d),并在青藏高原东部晚 新生代地壳变形中起着重要的调节作用(Wang et al.,2008). 该断裂带北西起于甘孜北,向南东经炉霍、道孚、乾宁、康定、泸定磨西,至石棉新民以南活动形迹逐渐减弱,最终消失于石棉公益海附近(唐荣昌和韩渭宾,1993). 断裂带走向在康定木格措以西为N40°-50°W,过木格措后断裂带走向向南逐渐偏转呈N20°-30°W,断层主要倾向NE,部分倾向SW,倾角较陡(张家涛和姚光亮,1990;刘冠中等,2013),全长约400 km(Molnar and Deng, 1984). 晚新生代以来,鲜水河断裂带表现出强烈的左旋走滑运动,横切了松潘—甘孜造山带的主体,系造山运动后期陆内变形的产物(许志琴等,1992),晚新生代以来的总位移量为60 km左右(Wang et al., 1998). 鲜水河断裂带滑动速率为15 mm·a-1左右(Molnar and Deng, 1984;闻学泽等,1989;Allen et al., 1991),但分段特征明显,全新世以来的活动以乾宁惠远寺拉分盆地为界可分为两段:北西段长约 200 km,由一条单一的主干断裂(即f1鲜水河断裂)组成(见图 1),平均水平滑动速率在10~15 mm·a-1 之间(钱洪,1989;闻学泽等,1989;Allen et al., 1991;周荣军等,2001); 南东段结构较复杂,乾宁—康定段由三条次级断裂(即f2色拉哈、f3折多塘、f4雅拉河)组成,单条断裂的滑动速率<10 mm·a-1,其中色拉哈断裂滑动速率约为5.5 mm·a-1(Allen et al., 1991),但三条断层滑动速率之和为10 mm·a-1 左右(Zhou et al., 2000),而康定以南的段落又呈一条单一的主干断裂(即f5磨西断裂)延伸,滑动速率约9~10 mm·a-1(Zhou et al., 2000;周荣军等,2001).
 | 图 1 鲜水河断裂带构造展布及6.5级以上历史地震震源分布(据闻学泽(2000)改编) Fig.1 Tectonics and the sources of historical M≥6.5 earthquakes along the Xianshuihe fault zone(Modified from Wen,2000) |
由于所处的独特地理位置与构造环境,鲜水河断裂带成为中国大陆西部最主要的强震活动带之一. 四川西部历史地震记载时间相对较短,自1725年以来,该断裂带共发生6.5级以上地震15次(7级以上地震8次)(见图 1a—1c),最大地震为1786年6月1日康定73 / 4(图 1c),其中,仅鲜水河断裂带中-南段(道孚—石棉之间)在最近300多年中就发生过M≥6.5级地震10次(易桂喜等,2005),显示出强烈的近代活动性. 2014年11月22日康定M6.3和25日康定M5.8级地震就发生在鲜水河断裂带中-南段乾宁与康定之间的塔公附近(见图 1a).
根据历史地震记录,鲜水河断裂带6级以上地震之后短期内发生的最大余震与主震震级至少相差0.8,且绝大多数的震级差大于1.0,本次康定M6.3级地震序列最大地震(11月22日M6.3)与次大地震(11月25日M5.8)震级仅差0.5,打破了以往的余震活动规律. 弄清导致这种差异的原因对于后续地震趋势判定至关重要. 地震序列震源机制及重新定位后的余震时空分布对于确定发震构造、判定未 来地震趋势具有重要意义. 本文利用Long等(2015)所 发展的多阶段定位方法(multi-step locating method)对本次康定M6.3 级地震序列进行重新定位,同时,采用gCAP(generalized Cut and Paste)矩张量反演方法(Zhu and Ben-Zion, 2013)求解本次地震序列中M6.3与M5.8级地震的震源机制解与震源矩心深度,分析本次地震序列的发震构造. 结合强震破裂历史和2001年以来的小震重新定位后的震源深度分布,对鲜水河断裂带中段未来强震危险性进行初步探讨. 2 资料与方法
求解震源机制的地震波形资料来源于四川区域地震台网记录. 地震序列重新定位所用震相观测报告下载自全国地震编目网站,下载资料要求所要定位的事件在震源区及其附近50 km范围内具有4个以上台站的观测报告记录. 截止到2014年12月1日05时30分,四川区域台网共记录到康定M6.3级序列地震2514次,其中,ML2.0~2.9级地震72次,ML3.0~3.3级地震7次,M5级以上地震2次,即11月22日M6.3和25日M5.8. 四川区域台网给出定位结果的地震1000次,其震中分布以及用于重新定位和震源机制解计算的台站分布见图 2. 由于总数超过95%的余震震级小于ML 2.0,导致60%的余震(1510次)仅有单台记录,另有部分(465次)因震级小记录台站也较少,满足具有4个以上台站记录可用于重新定位的地震仅539次.
 | 图 2 四川地震台网给出的2014年11月22日康定M6.3级地震序列震中以及
用于重新定位和震源机制解计算的地震台站(▲)分布图 左下角为放大的5.8级地震前(红色)、后(蓝色)序列震中分布图. Fig. 2 Distribution of the M6.3 Kangding earthquake sequence on 22 Nov. 2014 from Sichuan regional seismic network and seismic stations(▲)for relocation and focal mechanism calculation Enlarged epicenter maps of the sequence before and after the M5.8 earthquake are at the lower left corner,marked by red and blue dots,respectively. |
我们采用多阶段定位方法(multi-step locating method)(Long et al., 2015)对本次康定地震序列进行重新定位. 首先,基于赵珠和张润生(1987)的 四川西部速度模型(SCAA),利用HYPOINVERSE2000(Klein,1989)对序列进行初定,获取震源位置和台站方位角等信息;然后,挑选其中具有6个以上台站记录、且方位角间隙小于150°的事件的观测报告,采用VELEST(Kissling,1988;Kissling et al., 1994,1995)反演康定地区的最小一维速度模型和台站校正;接着,将反演得到的速度模型和台站校正代入HYPOINVERSE2000进行重新定位;最后,采用10 km的搜索半径,对校正后的震源位置进行双差定位(Waldhauser and Ellsworth, 2000).
依据重新定位过程中获得的康定地区速度模型 以及M6.3和M5.8级地震重新定位结果,采用gCAP(generalized Cut And Paste)矩张量反演方法(Zhu and Ben-Zion, 2013),同时反演这2次地震的震源机制解与震源矩心深度. gCAP方法的优势在于反演结果对速度模型的依赖性相对较小(张广伟等,2014). 该方法通过对Pnl与S波(或面波)赋予不 同权重,计算理论波形与实际波形的拟合误差函数,采用网格搜索法获取误差最小的最优解. 本文在反演时选用震中距250 km范围内的台站记录,Pnl与S波滤波频率范围分别为0.05~0.2 Hz和0.05~0.1 Hz;走向、倾角与滑动角的搜索间隔均为1°,深度搜索间隔为1 km;格林函数采用频率波数法(FK)(Zhu and Rivera, 2002)计算,采样间隔设为0.08 s、采样点为2048个. 3 结果与分析 3.1 康定M6.3级地震序列重新定位结果
基于上节所述的多阶段定位方法,利用VELEST反演获得了康定地区0~27 km深度的一维速度模型(KD)(见表 2),并最终获得了本次康定地震序列中459个地震的重新定位结果. 定位相对误差为: 水平EW向0.26 km、NS向0.38 km,垂直向深度误差0.33 km. 重新定位获得的M6.3级 主震参数为:发震时刻2014-11-22 16 ∶ 55 ∶ 26.67,震 中位置101.69°E、30.27°N,震源初始破裂深度10.2 km; M5.8级地震参数为:发震时刻2014-11-25 23 ∶ 19 ∶ 08.20,震中位置101.73°E、30.18°N,震源初始破裂深度11.3 km. 整个序列的平均震源深度为9.2 km.
|
|
表 2 康定地区一维速度模型(KD) Table 2 1-D velocity model in Kangding area(KD) |
序列重新定位结果见图 3—5. 为了更好地揭示余震分布的时空变化特征,本文利用不同的颜色来展示不同时段的余震分布,红色代表 2014年11月22日M6.3级主震以及最初3天(至11月25日M5.8发生前)的余震,绿色表示25日M5.8级地震与之后的余震. 余震平面分布图(图 3)显示:序列最初3天的余震总体沿NW-SE走向的色拉哈断裂呈窄带分布,余震密集区长轴长度约20 km,余震主要分布在M6.3级地震震中的NW侧(图 3中红色余震),两侧呈现明显不对称分布特征; 25日M5.8级地震发生在色拉哈断裂南侧的折多塘断裂北端,其后的余震(图 3中绿色余震)除部分发生在前3天的余震区外,主要集中在M5.8级地震震中附近长约10 km的范围,总体呈NW-SE走向.
 | 图 3 M6.3级地震序列重新定位结果震中平面分布 Fig. 3 Map view of relocated M6.3 earthquake sequence |
 | 图 4 沿余震区长轴的A-B深度剖面 Fig. 4 Vertical cross-section A-B along the strike of the long-axis of the aftershock area |
 | 图 5 垂直于色拉哈断裂走向的深度剖面(C-D、E-F)和垂直于折多塘断裂走向的深度剖面(G-H) (a)C-D剖面:单侧投影宽度20 km;(b)E-F剖面;(c)G-H剖面:单侧投影宽度10 km. Fig. 5 Vertical cross-sections C-D and E-F perpendicular to the strike of the Selaha fault and G-H perpendicular to the strike of the Zheduotang fault Projection width for each side is 20 km for C-D(a) and 10 km for both E-F(b) and G-H(c)sections. |
沿余震区长轴的A-B深度剖面(图 4)显示,余震分布在1~17 km深度,绝大多数余震位于M6.3和M5.8级地震震源上部,偏离M6.3级主震较远的北西端(A端)余震稀疏且相对较深. 康定至道孚段上地壳厚度20~22 km(范军等,2015),自东向西略有增厚,因此,本次地震序列发生在上地壳内,且主要集中在6~11 km相当狭窄的深度范围. 不同时段的余震深度分布存在一定的差异,与前3天的余震相比,M5.8级地震之后的余震密集区深度范围似乎更加狭窄. 图 4还揭示在M6.3主震附近存在一个深度范围约6 km、长度约12 km的少震区(图 4中虚线框所示区域),这一余震分布特征在 2004年10月23日日本新潟(Mid-Niigata Prefecture)Mw6.6级地震中也曾观测到(Kato et al., 2010),该余震低活动区可能是一个较大的凹凸体(asperity)(Aki,1984),在主震中能量得以充分释放.
垂直于色拉哈断裂走向的C-D剖面(图 5a)单侧投影宽度为20 km,包括了余震区所有地震. 图像显示:M6.3级地震及最初3天多数余震所处断裂与M5.8级地震及之后主要余震所处断裂近乎平行,揭示了M6.3与M5.8级地震并非发生在同一断裂上. E-F剖面(图 5b)单侧投影宽度10 km,仅包括M6.3级地震及其NW侧的余震,图像显示 M6.3级地震的发震断层(即色拉哈断裂)近似直立. 垂直于折多塘断裂走向的G-H剖面(图 5b)单侧投影宽度与E-F剖面一样,同为10 km,该剖面仅包含M5.8级地震及其附近的余震,同样清晰地展示了M5.8级地震的发震断层(即折多塘断裂)也为近直立断层. M6.3与M5.8级地震发震断裂不同,推测M5.8级地震及其附近的余震为M6.3级地震触发其南侧相邻的折多塘断裂活动所致,这可能是本次地震序列活动有别于历史强震序列特征的最主要原因.
根据图 3—5所展示的本次康定M6.3级地震序列余震密集区分布范围,本次地震震源体尺度较小,粗略估计其震源体限定在长度约30 km、宽约4 km、深度范围约6 km的区域内. 3.2 M6.3、M5.8级地震震源机制
图 6和图 7分别给出了基于本文获得的KD速 度模型和重新定位结果、采用gCAP方法反演M6.3 与M5.8级地震矩张量解时的波形拟合图,从图中可以看出,理论波形(红色)与实际观测波形(黑色)具有较好的拟合关系. 反演方差减小值(VR)随深度 的变化图(图 8和图 9)显示M6.3与M5.8级地震的最佳拟合震源矩心深度同为9 km,略小于重新定位获得的这2次地震的震源初始破裂深度,但与整个序列约9 km的平均震源深度一致,反映了M6.3和M5.8级地震破裂均始于深部,然后向浅部扩展,终止于大约6 km深度(见图 4—5),这一结果或许可解释为什么余震主要分布在M6.3和M5.8级地震上方以及在震中区几乎观测不到地表破裂的现象.
 | 图 6 基于KD速度模型的2014年11月22日康定M6.3级地震矩张量解及理论波形(红色)与观测波形(黑色)对比图 波形下方的数字表示理论波形相对于实际波形的移动时间(s)和二者的相关系数(%),左侧大写字母表示台站名,台站名下方数字为震中距(km)和相对偏移时间(s). Fig. 6 Moment tensor solution and comparison between the synthetic(red) and observed(black)waveforms of the M6.3 Kangding earthquake on 22 Nov. 2014 based on the KD velocity model The numbers below each trace are relative time shift in second and correlation coefficient in percent. The station names are given on the left and the numbers below station names are epicentral distance in km and relative time shift in second. |
 | 图 7 基于KD速度模型的2014年11月25日康定M5.8级地震矩张量解及理论波形(红色)与观测波形(黑色)对比图 波形拟合图中各数字的意义同图 6. Fig. 7 Moment tensor solution and comparison between the synthetic(red) and observed(black)waveforms of the M5.8 Kangding earthquake on 25 Nov. 2014 based on the KD velocity model The meaning of numbers on the waveform fitting diagram is the same as in Fig. 6. |
 | 图 8 基于KD速度模型的2014年11月22日康定M6.3级地震矩张量反演方差减小值(VR)随深度的变化 Fig. 8 Variation of variance reduction(VR)with depth during the moment tensor inversion for the M6.3 Kangding earthquake on 22 Nov. 2014 based on the KD velocity model |
 | 图 9 基于KD速度模型的2014年11月25日康定M5.8级地震矩张量反演方差减小值(VR)随深度的变化 Fig. 9 Variation of variance reduction(VR)with depth during the moment tensor inversion for the M5.8 Kangding earthquake on 25 Nov. 2014 based on the KD velocity model |
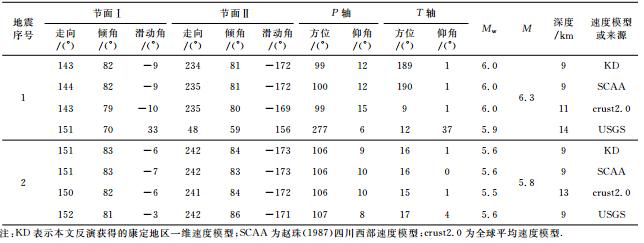
用gCAP方法反演获得的M6.3与M5.8级地震的震源机制解见表 3. 为了检验结果的可靠性,本文还同时采用赵珠和张润生(1987)的四川西部速度模型(SCAA)以及全球平均速度模型crust2.0进行了计算,结果均列于表 3中.
矩张量反演结果(表 3a和表 3b)显示:M6.3、M5.8级地震均以双力偶分量(Pdc)占主导. 表 3c为这两个地震的最佳双力偶解,从所列结果可以看 出,3个速度模型(KD、SCAA、 crust2.0)给出的震 源机制结果一致,揭示M6.3与M5.8级地震的发震断层均为近直立的走滑断层;P轴方位100°左右,呈NWW-SEE向,与该区域应力场主压应力方向一致(成尔林,1981;Xie et al., 1993;杨树新等,2012);P轴与T轴仰角分别在10°和1°左右,呈近水平或水平. USGS给出的M6.3级地震震源机制与本文结果有较大差异,具有较大的逆冲分量;而M5.8级地震机制解与本文结果一致. 不同速度模型获得的震源矩心深度略有差异,KD模型与 SCAA 模型结果一致,crust2.0模型获得的深度略大.
依据余震长轴空间展布以及断裂走向,分析认为,走向NW的节面Ⅰ为发震断层面,断面略微倾向SW,M6.3和M5.8级地震机制类型均为带有微 小正断分量的左旋走滑型. 同时,从表 3c可以发 现,与M6.3级地震相比,3个模型给出的结果均显示M5.8级地震的节面Ⅰ走向向北发生了约7°的偏转,因3个速度模型获得的节面Ⅰ走向差异仅1°,因此,7°量值可能反映了M5.8级地震发震构造部位(折多塘断裂北端)与M6.3级地震发震构造部位(色拉哈断裂中段,见图 3)走向的差异.
|
|
表 3a 2014年11月22日康定M6.3级地震矩张量解 Table 3a Moment tensor solutions of the Kangding M6.3 earthquake on Nov. 22,2014 |
|
|
表 3b 2014年11月25日康定M5.8级地震矩张量解 Table 3b Moment tensor solutions of the Kangding M5.8 earthquake on Nov. 25,2014 |
|
|
表 3c 2014年11月22日康定M6.3、25日康定M5.8级地震最佳双力偶解 Table 3c Best-double-couple solutions of the Kangding M6.3 and M5.8 earthquakes on Nov. 22 and 25,2014,respectively |
2014年11月22日康定M6.3级地震序列发生 在鲜水河断裂带中-南段乾宁与康定之间的色拉哈(或塔公)强震破裂空段(见图 1、图 10a),该空段长期处于低b值、高应力闭锁状态(易桂喜等,2005),被认为是鲜水河断裂带中-南段最可能发生强震的危险地段(易桂喜等,2005;Wen et al., 2008),并被圈定为7级地震重点危险区(M7工作组,2012),具有发生大震的构造条件与应力背景. 闻学泽(1995)的研究结果表明,在整个鲜水河—安宁河—则木河断裂带上,色拉哈断裂所处段落未来发生7级地震的概率最高,累积发震概率已超过90%. 同时,色拉哈段还处于汶川地震库仑破裂应力加载区(Parsons et al., 2008; Toda et al., 2008;邵志刚等,2010;单斌等,2009;万永革等,2009),也有利于其强震的发生. 自1982年6月16日甘孜6.0级地震后,鲜水河断裂带6.0级以上地震已经平静32年,本次康定M6.3级地震的发生可能标志着鲜水河断裂带强震平静期的结束. 根据余震密集区展布范围估计的本 次M6.3和M5.8级地震总体破裂尺度大约长30 km,尚不足以填补色拉哈强震破裂空段,本次地震NW侧仍为强震破裂空段(见图 10b虚线矩形框所示). 色拉哈段最近270年仅发生过1次6.5级地震(见图 10b),而鲜水河断裂带其他段落在相同时段均已发生过至少1次7级以上地震,基于色拉哈断裂平均滑动速率5.5 mm·a-1(Allen et al., 1991)、并假定7.0级地震的平均水平位错量1 m,可估算出色拉哈断裂7.0级地震的平均复发周期约182年,即使假设1748年发生在色拉哈断裂的地震震级为7级,其7级地震平静的时间也早已远超其平均复发周期,因此,该段未来几年存在发生7级地震的危险. 而与色拉哈段相邻的乾宁段同样长期处 于低b值、高应力闭锁状态(易桂喜等,2008),具有 发生大震的条件,以该段滑动速率值下限10 mm·a-1、 7.0级地震的平均水平位错量1 m估算的7.0级地震平均复发周期为100年,而自1893年M71 / 4级地震后,该段7.0级地震已平静121年(见图 1、图 10b),平静时间也已超过其平均复发周期估值,因此,该段未来几年同样存在发生7级地震的危险(Allen et al., 1991; 易桂喜等,2008; Ran,2014).
 | 图 10 鲜水河断裂带1725年以来6.5级以上历史强震破裂时-空分布(改编自Yi and Wen, 2000) (a)断裂展布,红色五星标示本次康定M6.3级地震震中;(b)M6.5级以上地震破裂时-空分布. 红色虚线表示破裂位置不确定. Fig. 10 The space-time distribution of historical M≥6.5 earthquake ruptures on the Xianshuihe fault zone since 1725(Modified from Yi and Wen, 2000) (a)Map of the fault zone trending,the red star marks the epicenter of the M6.3 Kangding earthquake;(b)Space-time distribution and the rupture segmentation of historical earthquake ruptures. Red dashed lines represent uncertain locations. |
此外,基于本文的KD速度模型(表 2),利用多阶段定位方法对2001年1月至2014年10月鲜水河断裂带中-南段小震重新定位,所获得的沿鲜水河断裂带走向的小震深度分布(见图 11a)显示:康定地震前,康定以西断裂段深部小震稀疏,其中,康定至塔公段7 km以下深部表现为一长约50 km的小震空缺段,康定序列(见图 11b)即发生在该小震空区内(见图 11c),这与1989年10月17日美国加州Loma Preta M7.1级地震前的情况非常类似. 在Loma Preta M7.1级地震之前20年,潜在震源断层段在0~15 km深度表现为一段长约30 km的小震活动空缺段,M7.1级地震的余震区正好填补了此 小震空段(Working Group on California Earthquake Probabilities,1990). 本次康定地震序列基本填补了塔公与康定间7 km以下深度的小震空区(见图 11c),但塔公至松林口段2 km以下深部仍存在明显的小震稀疏区,因此,未来强震发生在该深部小震稀 疏区的可能性很大,且破裂可能会比本次康定M6.3 级地震更接近地表.
 | 图 11 沿鲜水河断裂带中-南段2001年1月至2014年10月重新定位的小震(黑色)及2014年11月22日康定M6.3级地震序列(绿色)震源深度剖面 Fig. 11 Vertical cross-section of the relocated earthquakes from Jan. 2001 to Oct. 2014(black circles) and 22 Nov. 2014 M6.3 Kangding earthquake sequence(green circles)along the central-southern segment of the Xianshuihe fault zone |
基于中国国家数字地震台网和四川区域数字地震台网记录,我们采用多阶段定位方法对2014年11月22日康定M6.3级地震序列中539个地震进行了重新定位,最终获得了其中459个地震的重新定位结果. 同时,利用gCAP(generalized Cut And Paste)矩张量反演方法获得了该序列中11月22日M6.3与25日M5.8级地震的震源机制解和震源矩心深度,分析了本次地震序列的发震构造. 并结合历史强震破裂时空分布和2001年以来的小震重新定位震源深度分布,对鲜水河断裂带中段未来强震危险性进行了初步探讨. 获得的主要结论如下:
(1)康定M6.3级主震震中位于101.69°E、30.27°N,震源初始破裂深度约10 km,矩心深度约9 km;M5.8级地震震中位于101.73°E、30.18°N,初始破裂深度约11 km,矩心深度9 km. 矩张量反演结果揭示这两个地震均为双力偶分量占主导,M6.3级地震的最佳双力偶解节面Ⅰ走向143°/倾角82°/滑动角-9°,节面Ⅱ走向234°/倾角81°/滑动角-172°;M5.8级地震最佳双力偶解节面Ⅰ走向151°/倾角83°/滑动角-6°,节面Ⅱ走向242°/倾角84°/滑动角-173°. 与鲜水河断裂带和余震区长轴走向一致的节面Ⅰ为发震断层面,断面略微倾向SW,两地震均为带有微小正断分量的左旋走滑型地震.
(2)余震总体沿鲜水河断裂带呈NW-SE向展布. 最初3天的余震主要发生在M6.3级主震NW侧,两侧呈明显不对称分布;M5.8级地震后,余震主要密集分布在其震中附近长约10 km的区域. 序列平均震源深度约9 km,地震主要集中在6~11 km深度,余震基本发生在M6.3和M5.8级地震的上部,反映了M6.3和M5.8级地震破裂均始于深部,然后向浅部扩展至6 km左右深度,这一结果或许可解释为什么在震中区域几乎观测不到地表破裂. 余震分布密集区的范围揭示本次地震破裂尺度较小,震源体局限在长约30 km、宽约4 km、深度范围约6 km的区域. 此外,M6.3级主震震源附近存在的余震稀疏区可能属于一个较大的凹凸体(asperity),在主震中能量得以充分释放.
(3)康定M6.3级地震以及最初3天的多数余震发生在倾角约82°近直立的NW走向色拉哈断裂上,而M5.8级地震以及其后的多数余震发生在倾角约83°近直立的NW走向折多塘断裂北端走向向北偏转部位. M5.8级地震可能是M6.3级地震触发折多塘断裂活动所致,这可能是本次地震序列活动有别于鲜水河断裂带历史强震序列的最主要原因.
(4)康定M6.3级地震发生在鲜水河断裂带乾宁与康定之间的色拉哈(或塔公)强震破裂空段,该空段自1748年以来仅发生过1次6.5级地震,而鲜水河断裂带其他段落同时段均已发生过至少1次7级以上地震,本次M6.3和M5.8级地震尚不足以填补此强震空段,色拉哈段未来几年存在发生7级地震的危险;与色拉哈段相邻的乾宁段7级地震平静时间也已超过其平均复发周期,未来几年同样存在发生7级地震的危险. 康定M6.3级地震序列基本填补了塔公与康定之间的深部小震空区,未来强震发生在本次康定M6.3级地震西侧塔公至松林口段深部地震稀疏区内的可能性很大.
致谢 中国地震局地质研究所张培震研究员和另一位匿名审稿人给出了宝贵的修改建议;gCAP矩张量反演程序由美国圣路易斯大学的朱露培教授提供;部分图件采用GMT软件绘制; 在此一并致谢.| [1] | Aki K. 1984. Asperities, barriers, characteristic earthquakes and strong motion prediction. J. Geophys. Res., 89(B7):5867-5872. |
| [2] | Allen C R, Lou Z L, Qian H, et al. 1991. Field study of a highly active fault zone:The Xianshuihe fault of Southwestern China. Geological Society of America Bulletin, 103(9):1178-1199. |
| [3] | Cheng E L. 1981. Recent tectonic stress field and tectonic movement of the Sichuan Province and its vicinity. Acta Seismologica Sinica (in Chinese), 3(3):231-241. |
| [4] | Fan J, Zhu J S, Jiang X T, et al. 2015. Crustal structure of Sichuan from receiver functions. Earthquake (in Chinese), 34(1):65-76. |
| [5] | Kato A, Miyatake T, Hirata N. 2010. Asperity and barriers of the 2004 Mid-Niigata Prefecture earthquake revealed by highly dense seismic observations. Bull. Seismol. Soc. Am., 100(1):298-306. |
| [6] | Klein F W. 1989. HYPOINVERSE, a program for VAX computers to solve for earthquake locations and magnitudes. U.S.Geological Survey Open-File Report, 89-314, 59 pp. |
| [7] | Kissling E. 1988. Geotomography with local earthquake data. Rev. Geophys., 26(4):659-698. |
| [8] | Kissling E, Ellsworth W L, Eberhart-Phillips D, et al. 1994. Initial reference models in local earthquake tomography. J. Geophys. Res., 99(B10):19635-19646. |
| [9] | Kissling E, Kradolfer U, Maurer H. 1995. VELEST user's guide-short introduction, Tech. Rep. Institute of Geophysics, ETH Zurich. |
| [10] | Liu G Z, Ma J, Zhang H X, et al. 2013. Study on activity features of Xianshuihe fault zone with fault creep and short baseline observation for the last 20 years. Chinese J. Geophys. (in Chinese), 56(3):878-891, doi:10.6038/cjg20130317. |
| [11] | Long F, Wen X Z, Ruan X, et al. 2015. A more accurate relocation of the 2013 Ms7.0 Lushan, Sichuan, China, earthquake sequence, and the seismogenic structure analysis. J. Seismol., doi:10.1007/s10950-015-9485-0. |
| [12] | Molnar P, Deng Q. 1984. Faulting associated with large earthquakes and the average rate of deformation in central and eastern Asia. J. Geophys. Res., 89(B7):6203-6227, doi:10.1029/JB089iB07p06203. |
| [13] | Parsons T, Ji C, Kirby E. 2008. Stress changes from the 2008 Wenchuan earthquake and increased hazard in the Sichuan basin. Nature, 454(7203):509-510, doi:10.1038/nature07177. |
| [14] | Qian H. 1989. Faulted landforms along the Xianshuihe fault zone and their seismological significance. Seismology and Geology (in Chinese), 11(4):43-49. |
| [15] | Ran H L. 2014. A synthetic seismicity model for the northwestern portion of the Xianshuihe fault, southwestern China:simulation using the Monte Carlo method, based on historical earthquake data. Bull. Seismol. Soc. Am., 104(2):898-912, doi:10.1785/0120120313. |
| [16] | Shan B, Xiong X, Zheng Y, et al. 2009. Stress changes on major faults caused by Mw7.9 Wenchuan earthquake, May 12, 2008. Sci. China Ser. D-Earth Sci., 52(5):593-601. |
| [17] | Shao Z G, Zhou L Q, Jiang C S, et al. 2010. The impact of Wenchuan Ms8.0 earthquake on the seismic activity of surrounding faults. Chinese J. Geophys. (in Chinese), 53(8):1784-1795, doi:10.3969/j.issn.0001-5733.2010.08.004. |
| [18] | Tang R C, Han W B. 1993. Active Faults and Earthquakes in Sichuan Province (in Chinese). Beijing:Seismological Press, 1-368. |
| [19] | Toda S, Lin J, Meghraoui M, et al. 2008. 12 May 2008 M=7.9 Wenchuan, China, earthquake calculated to increase failure stress and seismicity rate on three major fault systems. Geophys. Res. Lett., 35(17):L17305, doi:10.1029/2008GL034903. |
| [20] | Waldhauser F, Ellsworth W L. 2000. A double-difference earthquake location algorithm:Method and application to the northern Hayward fault, California. Bull. Seismol. Soc. Am., 90(6):1353-1368. |
| [21] | Wang E, Burchfiel B C, Royden L H, et al. 1998. Late Cenozoic Xianshuihe-Xiaojiang, Red River, and Dali Fault Systems of Southwestern Sichuan and Central Yunnan, China. Boulder, Colorado, Geological Society of America Special, Paper 327. |
| [22] | Wang S F, Fan C, Wang G, et al. 2008. Late Cenozoic deformation along the northwestern continuation of the Xianshuihe fault system, Eastern Tibetan Plateau. GSA Bulletin, 120(3-4):312-327, doi:10.1130/B25833.1 |
| [23] | Wan Y G, Shen Z K, Sheng S Z, et al. 2009. The influence of 2008 Wenchuan earthquake on surrounding faults. Acta Seismologica Sinica (in Chinese), 31(2):128-139. |
| [24] | Wang Z X, Xu Z Q, Yang T N, et al. 1996. Study of deformation mechanism of the Xianshui river fault zone-A shallow-level, high-temperature ductile shear zone. Regional Geology of China (in Chinese), (3):244-251. |
| [25] | Wen X Z. 1995. Quantitative Estimates of Seismic Potential on Active Faults (in Chinese). Beijing:Seismological Press, 1-150. |
| [26] | Wen X Z. 2000. Character of rupture segmentation of the Xianshuihe-Anninghe-Zemuhe fault zone, Western Sichuan. Seismology and Geology (in Chinese), 22(3):239-249. |
| [27] | Wen X Z, Allen C R, Luo Z L, et al. 1989. Segmentation, geometric features, and their seismotectonic implications for the Holocene Xianshuihe fault zone. Acta Seismologica Sinica (in Chinese), 11(4):362-372. |
| [28] | Wen X Z, Ma S L, Xu X W, et al. 2008. Historical pattern and behavior of earthquake ruptures along the eastern boundary of the Sichuan-Yunnan faulted-block, southwestern China. Phys. Earth Planet. Inter., 168(1-2):16-36, doi:10.1016/j.pepi.2008.04.013. |
| [29] | Working Group of M7. 2012. Study on the Mid- to Long-term Potential of Large Earthquakes on the Chinese Continent (in Chinese). Beijing:Seismological Press, 1-336. |
| [30] | Working Group on California Earthquake Probabilities. 1990. Probabilities of large earthquakes in the San Francisco Bay Region, California, U. S. Geological Survey Circular, 51. |
| [31] | Xie F R, Zhu J Z, Liang H Q, et al. 1993. Basic characteristics of recent tectonic stress field in southwest China. Acta Seismologica Sinica, 6(4):843-855. |
| [32] | Xu Z Q, Hou L W, Wang Z X, et al. 1992. Oregenic Process of the Songpan-Garze Orogenic Belt of China (in Chinese). Beijing:Geological Publishing House, 1-188. |
| [33] | Yang S X, Yao R, Cui X F, et al. 2012. Analysis of the characteristics of measured stress in Chinese mainland and its active blocks and North-South seismic belt. Chinese J. Geophys. (in Chinese), 55(12):4207-4217, doi:10.6038/j.issn.0001-5733. |
| [34] | Yi G X, Wen X Z. 2000. Earthquake recurrence on whole active fault zones and its relation to that on individual fault-segments. Acta Seismologica Sinica, 13(5):563-574. |
| [35] | Yi G X, Fan J, Wen X Z. 2005. Study on faulting behavior and fault-segments for potential strong earthquake risk along the central-southern segment of Xianshuihe fault zone based on current seismicity. Earthquake (in Chinese), 25(1):58-66. |
| [36] | Yi G X, Wen X Z, Su Y J. 2008. Study on the potential strong-earthquake risk for the eastern boundary of the Sichuan-Yunnan active faulted-block, China. Chinese J. Geophys. (in Chinese), 51(6):1719-1725. |
| [37] | Zhang G W, Lei J S, Liang S S, et al. 2014. Relocations and focal mechanism solutions of the 3 August 2014 Ludian, Yannan Ms6.5 earthquake sequences. Chinese J. Geophys. (in Chinese), 57(9):3018-3027, doi:10.6038/cjg20140926. |
| [38] | Zhang J T, Yao G L. 1990. The characteristic of segmented activity of Xianshuihe fault zone. Crustal Deformation and Earthquake (in Chinese), 10(3):54-60. |
| [39] | Zhao Z, Zhang R S. 1987. The compilation of regional travel time table in Sichuan. Earthquake Research in Sichuan (in Chinese), (3):29-35. |
| [40] | Zhou R, He Y, Huang Z, et al. 2000. Slip rate and recurrence interval of strong earthquake of Qianning -Kangding segment on Xianshuihe fault. Earth Science Frontiers, 7:297-298. |
| [41] | Zhou R J, He Y L, Huang Z Z, et al. 2001. The slip rate and strong earthquake recurrence interval on the Qianning-Kangding segment on the Xianshuihe fault zone. Acta Seismologica Sinica (in Chinese), 23(3):250-261. |
| [42] | Zhu L P, Rivera L A. 2002. A note on the dynamic and static displacements from a point source in multilayered media. Geophys. J. Int., 148(3):619-627. |
| [43] | Zhu L P, Ben-Zion Y. 2013. Parametrization of general seismic potency and moment tensors for source inversion of seismic waveform data. Geophys. J. Int., 194(2):839-843, doi:10.1093/gji/ggt137. |
| [44] | 成尔林. 1981. 四川及其邻区现代构造应力场和现代构造运动特征. 地震学报, 3(3): 231-241. |
| [45] | 范军, 朱介寿, 江晓涛等. 2015. 利用接收函数方法研究四川地区地壳结构. 地震, 34(1): 65-76. |
| [46] | 刘冠中, 马瑾, 张鸿旭等. 2013. 二十年来蠕变和短基线观测反映的鲜水河断裂带活动特征. 地球物理学报, 56(3): 878-891, doi: 10.6038/cjg20130317. |
| [47] | 钱洪. 1989. 鲜水河断裂带的断错地貌及其地震学意义. 地震地质, 11(4): 43-49. |
| [48] | 单斌, 熊熊, 郑勇等. 2009. 2008年5月12日Mw7.9汶川地震导致的周边断层应力变化. 中国科学D辑: 地球科学, 39(5): 537-545. |
| [49] | 邵志刚, 周龙泉, 蒋长胜等. 2010. 2008年汶川Ms8.0地震对周边断层地震活动的影响. 地球物理学报, 53(8): 1784-1795, doi: 10.3969/j.issn.0001-5733.2010.08.004. |
| [50] | 唐荣昌, 韩渭宾. 1993. 四川活动断裂与地震. 北京: 地震出版社, 1-368. |
| [51] | 万永革, 沈正康, 盛书中等. 2009. 2008年汶川大地震对周围断层的影响. 地震学报, 31(2): 128-139. |
| [52] | 王宗秀, 许志琴, 杨天南等. 1996. 川西鲜水河断裂带变形机制研究——一个浅层次高温韧性平移剪切带. 中国区域地质, (3): 244-251. |
| [53] | 闻学泽. 1995. 活动断裂地震潜势的定量评估. 北京: 地震出版社, 1-150. |
| [54] | 闻学泽. 2000. 四川西部鲜水河—安宁河—则木河断裂带的地震破裂分段特征. 地震地质, 22(3): 239-249. |
| [55] | 闻学泽, Allen C R, 罗灼礼等. 1989. 鲜水河全新世断裂带的分段性、几何特征及其地震构造意义. 地震学报, 11(4): 362-372. |
| [56] | 许志琴, 侯立玮, 王宗秀等. 1992. 中国松潘—甘孜造山带的造山过程. 北京: 地质出版社, 1-188. |
| [57] | 杨树新, 姚瑞, 崔效锋等. 2012. 中国大陆与各活动地块、南北地震带实测应力特征分析. 地球物理学报, 55(12): 4207-4217, doi: 10. 6038/j.issn.0001-5733. |
| [58] | 易桂喜, 范军, 闻学泽. 2005. 由现今地震活动分析鲜水河断裂带中-南段活动习性与强震危险地段. 地震, 25(1): 58-66. |
| [59] | 易桂喜, 闻学泽, 苏有锦. 2008. 川滇活动地块东边界强震危险性研究. 地球物理学报, 51(6): 1719-1725. |
| [60] | 张广伟, 雷建设, 梁姗姗等. 2014. 2014年8月3日云南鲁甸Ms6.5级地震序列重定位与震源机制研究. 地球物理学报, 57(9): 3018-3027, doi: 10.6038/cjg20140926. |
| [61] | 张家涛, 姚光亮. 1990. 鲜水河断裂带的分段活动特征. 地壳形变与地震, 10(3): 54-60. |
| [62] | 赵珠, 张润生. 1987. 四川地区地震波分区走时表的编制. 四川地震, (3): 29-35. |
| [63] | 《中国大陆大地震中-长期危险性研究》M7工作组. 2012. 中国大陆大地震中-长期危险性研究. 北京: 地震出版社, 1-336. |
| [64] | 周荣军, 何玉林, 黄祖智等. 2001. 鲜水河断裂带乾宁—康定段的滑动速率与强震复发间隔. 地震学报, 23(3): 250-261. |