 2015, Vol. 58


2. 中国科学院大学, 北京 100049
2. University of Chinese Academy of Sciences, Beijing 100049, China
1 引言
自中生代开始,多个块体(如羌塘块体、拉萨块体等)向欧亚大陆南部拼贴,新特提斯洋关闭,印度与欧亚发生陆陆碰撞.在印度大陆持续向北推进的作用下,欧亚大陆南侧和拼贴块体的地表抬升,进而 形成青藏高原(Haines et al., 2003; Yin and Harrison, 2000). 欧亚大陆同印度板块间近南北向1400~2350 km巨大的缩短量(Harrison et al., 1992),使得地壳厚度显著增加(70~80 km),达正常大陆地壳厚度(Christensen and Mooney, 1995)的两倍,这一重要特征已被大量地球物理探测证实(滕吉文等, 1997,2012;吴庆举和曾融生,1998; 李秋生等,2004; Zhang et al., 2011;Nábělek et al., 2009; Shi et al., 2004; Tian et al., 2005; Tseng et al., 2009; Jiang et al., 2006; 高锐等2011).然而,众多研究表明:青藏高原的演化不是简单连续的,而是存在明显的时空脉动性变化,如21~18 Ma和8 Ma以来的两期高原大范围快速抬升(Harrison et al., 1992),又如青藏高原火山岩随时间向北再向南的多期次分布(Chung et al., 2005; Ding et al., 2003).由于岩石圈不同的动力学过程如低角 度俯冲(underthrusting)、板片回退(roll-back)、板 片断离(break-off 或detachment)、 高角度俯冲(subduction)、对流移除(convective removement),对应不同的地表形变模式和不同的火山时空及成分变化,基于此地质学家试图通过对这些事件分析研究,重建新生代青藏高原下方印度岩石圈、青藏高原岩石圈及欧亚大陆岩石圈的动力学过程(Chung et al., 2005; Ding et al., 2003; Molnar et al., 1993; Chen and Tseng, 2007),所以探测现今地幔岩石圈的几何形态,有助于陆陆碰撞和青藏高原隆升的动力学过程重建和高原演化研究(吴福元等,2008;Guillot and Replumaz, 2013).
区域固定台网数据层析成像研究显示印度岩石圈低角度俯冲在青藏高原下(Huang and Zhao, 2006),上地幔顶部回折波研究(McNamara et al., 1997)指示藏北上地幔顶部存在一个明显的Sn不发育的高衰减区(主要集中在羌塘和松潘—甘孜块体下方),并被认为是缺乏地幔盖层,地壳与软流圈直接接触(Owens and Zandt, 1997);体波远震层析成像也表明在藏北上地幔存在明显的低速异常(Liang et al., 2012; Tilmann et al., 2003; Wittlinger et al., 1996),但整个高原下方地幔岩石圈在汇聚过程中如何形变以及目前的空间位置和几何形态的研究远未达成共识.
近20年来,中外科学家在青藏高原已开展多条近南北向的宽频带地震探测.在85°E以西的西部,接收函数界面成像(Zhao et al., 2010)和远震走 时地震波速度成像(Li et al., 2008,Zhao et al., 2014)显示印度岩石圈低角度俯冲在青藏高原下方;在东部(90°E以东),接收函数界面成像(Kosarev et al., 1999; Zhao et al., 2011)显示印度岩石圈高角度俯冲至拉萨块体或班公—怒江缝合带下方;在85°E至90°E之间的中 部地区,接收函数界面成像研究(吴庆举等,2004; Zhao et al., 2010)和远震走时地震波速度成像(Zheng et al., 2007)显示印度俯冲板片小角度向北俯冲至羌塘块体下方; 而Tilmann等(2003)的远震P波走时地震波速度成像结果则显示汇聚增厚的岩石圈在班公—怒江缝合带南侧近垂直下沉(downwelling).这些不同研究方法获得的结果存在差异的原因可能来自多个方面,如岩石圈底界面深度较大导致其对应的地震信号信噪比较低,再如岩石圈结构在东西方向上可能存在明显的分带性而高原内部观测密度却是有限的(比如 Liang et al., 2012),以及高原下方的岩石圈与软流圈之间地震波速度差异较小.
尽管INDEPTH-Ⅲ宽频带天然地震观测已完成十多年,并已发表多项地震学探测结果,但对该剖面下方的地幔岩石圈结构的研究仍存在较大争议.Tilmann等(2003)通过远震走时地震波速度成像获得了剖面下方P波速度扰动图像,结果显示汇聚增厚的岩石圈在班公—怒江缝合带南侧近垂直下沉;而在相邻的位置,Zheng等(2007)的成像结果却显示印度俯冲板片小角度向北俯冲至羌塘块体下方,显然该地区需要开展更多的地幔岩石圈探测研究工作.考虑到S波速度对温度变化比较敏感,本文利用INDEPTH-Ⅲ剖面S波波形记录,使用多道互相关准确提取相对走时,通过层析成像获取剖面下方上地幔S波速度扰动图像,为青藏高原动力学研究提供更多约束. 2 方法与原理
地学层析成像是将医学X射线CT理论应用于调查地下物性参数分布状况的地球物理探测技术(Aki and Lee, 1976; Aki et al., 1977; Culter et al., 1984),其主要目的是确定地球内部的精细结构和局部非均匀性(杨文采,1993).地震层析成像通过对观察到的地震波各种震相的运动学(如走时、射线路径)和动力学(如波形、振幅)特性的资料进行分析,进而反演出地下介质的速度及其他物性参数结构等重要信息的一种地球物理方法(滕吉文等,2004).本文主要利用远震S波走时数据来反演上地幔介质的速度结构.
地震波走时是地震波能量沿射线经过不同速度区域所需时间的积分.一般,定义地震波的走时残差为地震波沿射线穿过实际地球介质和穿过参考模型之间走时的差异,它主要反映的是地震射线所经过区域的速度同参考模型之间的差异;其近似等同于沿射线所经过区域的慢度异常的积分值,同时受到地震震源定位误差和发震时刻误差等因素的影响.远震的传播路径在靠近震源的一侧基本相同,而在台站下方靠近台站部分存在明显的差别,因此不同台站所记录的远震震相波形相似,台站下方速度结构的横向非均匀性对台站间的相对走时残差起主要贡献,使用远震相对走时基本排除了研究区域外因素对反演研究区内速度异常的影响.所以,本研究中使用远震S波的相对走时残差作为约束,对台站下方的速度结构进行层析成像.
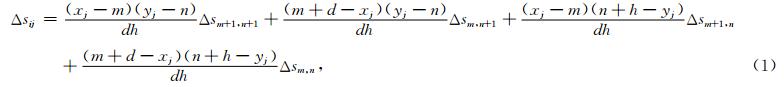
我们将研究区域沿剖面(28°N—36°N,80~400 km 之间)划分为反演所使用的规则四边形网格(0.25°×20 km),共693个节点,并假设四边形网格节点上的慢度异常值为Δsm,n.射线i经过第j个网格的慢度异常Δsij(中点(xj,yj))可以根据该网格周围四个节点(m,n)、(m+1,n)、(m,n+1)、(m+1,n+1)的慢度异常插值得到
射线i经过网格j的长度lij可以由相应节点坐标计算获得.每条射线的相对走时残差ti可以表示为:

cimn表示(m,n)节点对第i条射线的影响系数,是节点周围所有网格内射线长度lij及其在该网格内权重((1)式)的乘积之和,Δsmn表示在(m,n)节点上的慢度扰动.
在方程组(3)中,节点上的慢度异常为待求解的未知变量,已知条件包括地震射线路径构建的系数矩阵和相对走时残差构建的数据向量.
这里我们使用阻尼最小二乘QR分解(least squares QR-factorization,LSQR)方法(Paige and Saunders, 1982)求解该线性方程组,进而得到INDEPTH-III剖面下方的S波速度扰动异常分布.
在计算初始射线路径时,本文使用ISAP91模型的S波速度模型作为初始模型,然后通过反演出来的速度扰动对初始模型进行更新,并对射线路径进行重新计算,直到慢度扰动结果最终收敛.
人工拾取震相到时的精度受人员熟练程度的影响很大,拾取误差也不容易估计.为了弥补这些缺点,本研究中采用多道互相关的方法计算台站间的 相对走时残差(Hales and Doyle, 1967,Vandecar and Crosson, 1990).该方法的另外一个优点是对信 号的信噪比要求较低(Vandecar and Crosson, 1990),所以我们在筛选数据的时候对震级没有进行特别的限制.
在对接收到同一个地震的任意两个台站的地震波形进行互相关分析时,将截取的S波震相在±5 s进行扫描计算互相关系数,认为互相关系数最大(大于0.8)的时间差是两个台站(第i个和第j个台站)之间的相对走时残差Δtij,如果第i个台站相对于初始模型的相对走时残差记为ti,那么
考虑到地震波形中总是有噪声的影响,互相关得到的相对走时也会受到噪声的影响,这时为了对上述方程组(4)进行求解,需要引入一个到时差之和为零的假设作为约束:

由方程组(4)和方程(5)组成的方程组可以方便地用最小二乘法求解,从而得到每条射线的相对走时残差(Vandecar and Crosson, 1990). 3 数据和结果
本文用到的数据是中美等国合作于1998年7 月至1999年6月间在青藏高原中部布设的INDEPTH-Ⅲ 剖面(西藏德庆—龙尾错剖面)记录的宽频带地震波形数据.整条剖面共60个宽频带地震台构成,从拉萨块体跨越班公—怒江缝合带进入羌塘块体内部(图 1a),全长大约400 km.考虑到整条剖面基本沿着北北西走向在一条线上分布,而该区域内的主要构造带为近东西向延伸,我们忽略垂直测线方向的横向非均匀性.为了减小垂直于测线方向的射线可能引入的横向非均匀性的影响,我们仅使用反方位角与测线夹角在45°以内的地震事件(图 1b).在这些地震中,进一步挑选震中距在30°~150°之间,有清晰的S、SKS、PKS、ScS等S波震相的波形,并对数据进行0.05~0.25 Hz的带通滤波处理.为了保证数据的可靠性,要求每个地震事件至少被8个台站同时接收,并且剔除走时残差大于4 s的一些不合理的台站,确保排除仪器故障等特殊原因导致的严重异常.我们共筛选出49个宽频带地震台记录的30个远震事件,共计622条射线.
 | 图 1 台站以及应用到的事件的分布情况 (a)中三角形表示台站的位置,(b)中空心圆表示INDEPTH-Ⅲ接收到的所有事件的位置,实心圆表示我们用到的事件位置. Fig.1 The distribution of stations and the event applied (a)The triangles shows the location of the stations.(b)The hollow circular shows the location of the events recorded by INDEPTH-Ⅲ,the solid circular shows the location of the events we used. |
以1998年7月31日12时40分59秒发生在169.82°E,21.61°S震级Mw6.0的地震事件为例.通过对经过理论到时校正后的波形图和经过相对走时残差校正后的波形比较,可以明显发现经过相对走时残差校正后,所有台站的波形在到时和形态上都比较一致(图 2a);通过多道互相关方法得到的相对走时残差表现为:在32°N以南相对走时残差为负值,以北为正,说明该事件的地震射线经过的32°N以南地区的速度可能大于32°N以北地区(图 2b).
 | 图 2 多道互相关计算得出的相对走时残差 (a)中左图是将所有台站的理论到时进行校正后的波形,右图是进行相对走时残差校正后的波形. Fig. 2 Residual of travel times calculated by multichannel cross-correlation (a)shows the waveform before and after corrected by residual. |
因为远震射线在接近地表的时候入射角比较小,射线交叉少,对地壳内的速度异常不能提供有效约束;并且,拉萨块体与羌塘块体之间地壳结构存在明显的差异(Tseng et al., 2009),使用均匀地壳模型对远震走时残差进行校正显然是不合理的.所以我们根据Mechie等在2004利用INDEPTH Ⅲ宽角反射地震数据反演得到的研究区地壳S波速度(图 3)对多道互相关获得的相对走时残差进行校正,得出了排除地壳速度异常影响的相对走时残差(图 2).如图 3中所示,地壳速度结构在32°N班公—怒江缝合带附近非均匀性比较强.对地壳中的速度异常进行校正以后得到的80 km以下速度结构引起的相对走时残差(图 2)表明,32°N附近相对走时残差负值变大,深部的高速体相对于浅部可能更靠北.
 | 图 3 INDEPTH Ⅲ宽角地震数据得到的该区域 地壳中的S波速度(Mechie et al., 2004) Fig. 3 Crustal S wave velocity reference model along the profile INDEPTH Ⅲ provided by Mechie et al.(2004) |
由于反演问题本身的多解性,在反演过程中选择不同的反演参数可以获得多样的反演结果(张风雪等,2013),这就决定了确定最终的反演所使用的参数具有一定的经验性.地震波走时层析成像的分辨率很大程度上依赖于研究区域的地震波射线覆盖和相互交叉情况(田有等,2009).本研究中实际使用的射线分布如图 4所示,在30°N—34°N之间射线密度最大,中间的大部分区域节点附近的射线总长度达到600 km以上,而射线覆盖范围随着深度从浅到深而增加,但是射线密度随深度增 加而减小,射线交叉比较好的区域大约在150~300 km之间.同时,我们对模型进行了检测板测试(Humphreys and Clayton, 1988)(如图 5): 给定±10%速度异常相间的速度模型,并对正演计算的走时引入时间标准差0.1倍的随机噪声来模拟实际数据中存在的噪声干扰.两组大小不同的检测板实验表明,在射线密度比较大的范围内0.5°×80 km的检测板恢复情况比较清 楚,输入模型的特征基本能恢复(图 5a,5c);而0.5°×40 km 的检测板在射线交叉少的模型两侧200~400 km深的位置对输入模型的恢复明显变差(图 5b,5d).
 | 图 4 射线密度分布图 颜色深浅代表所有射线经过该节点附近射线的总长度. Fig. 4 Ray density distribution The darkness means the total length of all rays pass through the near nodes. |
 | 图 5 检测板实验 红色代表低速异常,蓝色代表高速异常.(a,c)的分辨率为0.5°×80 km,(b,d)的分辨率为0.5°×40 km. Fig. 5 Checkboard tests Red and blue colors denote low and high velocity abnormaly,respectively. The resolutions in(a,c)are horizontal 0.5° and 80 km in depth domain,while the resolution in depth domain decrease to 40 km in(b,d). |
最小二乘反演中的阻尼系数起到调和模型参数 分辨率和误差之间关系的作用(Paige and Saunders, 1982; Nolet,1987). 不同阻尼系数的反演结果中,模型光滑程度与走时残差之间的关系如图 6a所示.经过多次试验,我们选取最佳的阻尼系数为10.经过四次迭代以后速度结构趋于稳定.每次迭代后的结果与上一次迭代结果之间的差异(其中第1次相对于均匀模型)如表 1所示.反演前后的相对走时残差的分布情况如图 6b所示,反演之后走时残差明显减小,同时残差的方差也明显减小.
 | 图 6 不同阻尼系数的反演结果中,光滑程度与走时残 差之间的关系(a)和反演前后相对走时残差分布的对比(b) Fig. 6 The relationship between smooth degree and the residual travel time by different damping coefficient shows in(a). The contrast of the distribution between before and after inversion shows in(b) |
|
|
表 1 迭代次数与速度模型稳定性的变化趋势 Table 1 The relationship between the total times of iterations and the stability of the velocity model change trend |
为避免反演图像中相邻网格点之间速度扰动的异常跳变,我们对反演图像进行了光滑处理,以获得我们所关心的大尺度结构图像.结果中每一个格点的异常值用它周围相邻的八个格点和它本身值的加 权平均代替(权系数取为:本身1/4,边上的临点1/8,角上的点1/16).结果如图 7所示:一个高速体自拉萨块体中部(约31°N)高角度向北并向深部延伸,倾斜角度约为65°,可分辨的深度可达300 km.
 | 图 7 INDEPTH-Ⅲ剖面下S波慢度异常层析成像的结果 蓝色表示慢度小,代表高速异常,红色表示慢度大,代表低速异常. Fig. 7 S tomographic imaging results under INDEPTH-Ⅲ profile Blue color indicates small(negative)slowness and represents high seismic velocity,while red color indicates large(positive)slowness and represents low seismic velocity. The block arrows are the possible dynamic interpretations of downwelling and upwelling. |
在进行地震波走时层析成像时,分布不合理的射线可能导致反演得到的异常形态同异常的实际形态之间存在明显差异,因此,有必要进行可恢复实验(Zhao et al., 1992)来验证我们所使用的数据和方法是否具有区分最终结果中得到高速异常为高角度异常或垂直异常的能力.为此,本文进行了三种不同形态高速异常模型的可恢复实验,如图 8所示,三个输入模型中分别包含竖直展布的高速异常体、向北倾斜65°的高速异常体和垂直向下的倒梯形高速异常体,输入S波速度异常的幅度设定为5%.使用与实际数据相同的震源分布和台站分布,通过正演计算获取模型所对应的走时异常,并加入走时异常标准差0.1倍的噪声,通过层析成像反演获得不同输入模型所对应的恢复结果.从恢复结果看(图 8),在300 km深度以上,三种输入模型的基本特征都能够得到恢复并加以区分.
 | 图 8 三个不同形态高速异常模型的可恢复实验 蓝色代表高速异常,红色代表低速异常.分别给出三种形态不同的高速异常(a)、(c)、(e),恢复结果如图(b)、(d)、(f)所示. Fig. 8 Recoverable tests of anomaly model with three different shapes Three high velocity anomaly models(a),(c), and (e)are the input,while(b),(d), and (f)are output,respectively. |
从图 8可以看出,在使用向北倾斜65°的高速异常体作为输入模型进行可恢复实验时,高速体北侧仅出现范围有限的微弱虚假低速异常,异常幅度和分布范围远不及实际数据反演结果(图 7)中班公—怒江缝合带以北羌塘块体上地幔的低速异常.为了检验该低速异常的可靠性,我们进行了另一种可恢复实验(图 9),在倾斜高速异常体的北侧并排设置一个低速异常(正异常和负异常的幅度同样设定为 5%),从恢复结果看,正负异常的基本特征在300 km 深度以上可以很好地恢复.两组可恢复实验表明,本文结果中高角度倾斜S波高速体及其上方和北侧的S波低速异常都是可信的异常体.
 | 图 9 同时存在高速异常和低速异常倾斜模型的可恢复实验 Fig. 9 Recoverable test for model with a high and a low velocity anomaly coexisting |
反演得到的S波速度成像结果(图 7)显示一个高速体自拉萨块体中部(约31°N)高角度向北并向 深部延伸,倾斜角度约为65°,可分辨的深度可达300 km.该S波高速体形态明显同Tilmann等(2003)获得的P波高速体存在差异(在32°N—33°N之间深度小于100 km的区域,我们的S波结果呈现低速异常,而Tilmann的结果表现为高速异常).这两者的差异可能主要来源于以下两个方面,首先是射线覆盖程度的不同造成的分辨率差异,因为P波通常有比S波更密集的射线分布;其次,S波和P波对温度异常和物性差异的敏感度不同,S波速度对温度异常更敏感,而P波速度对物质成分差异更敏感(Boyd et al., 2004).P波和S波层析成像分别在同样地区发现了高速异常,说明该异常的可靠性.Tilmann等(2003)认为他们反演的异常主要 是因为印度大陆岩石圈不断向北汇聚增厚,因为力 学不稳定性或者之前高密度的海洋岩石圈的拖曳,导致增厚的印度大陆岩石圈发生重力下沉. 同样的解释也可以用来帮助我们理解反演得到S波速度异常图像,这个异常也可能是岩石圈不断增厚进而发生拆沉后的残留部分.
| [1] | Aki K, Lee W H K. 1976. Determination of three-dimensional velocity anomalies under a seismic array using first P arrival times from local earthquakes:1. A homogeneous initial model. Journal of Geophysical Research, 81:4381-4399. |
| [2] | Aki K, Christoffersson A, Husebye E S. 1977. Determination of the three-dimensional seismic structure of the lithosphere. Journal of Geophysical Research, 82:277-296. |
| [3] | Boyd O S, Jones C H, Sheehan A F. 2004. Foundering lithosphere imaged beneath the southern Sierra Nevada, California, USA. Science, 305(5684):660-662 |
| [4] | Chen W P, Tseng T L. 2007. Small 660-km seismic discontinuity beneath Tibet implies resting ground for detached lithosphere. Journal of Geophysical Research:Solid Earth (1978—2012), 112(B5), doi:10.1029/2006JB004607. |
| [5] | Christensen N I, Mooney W D. 1995. Seismic velocity structure and composition of the continental crust:A global view. Journal of Geophysical Research:Solid Earth (1978—2012), 100(B6):9761-9788. |
| [6] | Chung S L, Chu M F, Zhang Y Q, et al. 2005. Tibetan tectonic evolution inferred from spatial and temporal variations in post-collisional magmatism. Earth-Science Reviews, 68(3-4):173-196. |
| [7] | Culter R T, Bishop T N, Wyld H W, et al. 1984. Seismic tomography:formulation and methodology. SEG Technical Program Expanded Abstracts, 711-712. |
| [8] | Ding L, Kapp P, Zhong D L, et al. 2003. Cenozoic volcanism in Tibet:Evidence for a transition from oceanic to continental subduction. Journal of Petrology, 44(10):1833-1865. |
| [9] | Engdahl E R, Van der Hilst R, Buland R. 1998. Global teleseismic earthquake relocation with improved travel times and procedures for depth determination. Bulletin of the Seismological Society of America, 88(3):722-743. |
| [10] | Gao R, Wang H Y, Wang C S, et al. 2011. Lithospheric deformation shortening of the Northeastern Tibetan Plateau:Evidence from reprocessing of deep seismic reflection data. Acta Geoscientica Sinica (in Chinese), 32(5):513-520. |
| [11] | Guillot S, Replumaz A. 2013. Importance of continental subductions for the growth of the Tibetan plateau. Bulletin de la Société Géologique de France, 184(3):199-223. |
| [12] | Haines S S, Klemperer S L, Brown L, et al. 2003. INDEPTH Ⅲ seismic data:From surface observations to deep crustal processes in Tibet. Tectonics, 22(1), doi:10.1029/2001TC001305. |
| [13] | Hales A L, Doyle H A. 1967. P and S travel time anomalies and their interpretation. Geophysical Journal International, 13(4):403-415. |
| [14] | Harrison T M, Copeland P, Kidd W S F, et al. 1992. Raising Tibet. Science, 255(5052):1663-1670. |
| [15] | Huang J L, Zhao D P. 2006. High-resolution mantle tomography of China and surrounding regions. Journal of Geophysical Research:Solid Earth (1978—2012), 111(B9), doi:10.1029/2005JB004066. |
| [16] | Humphreys E, Clayton R W. 1988. Adaptation of back projection tomography to seismic travel time problems. Journal of Geophysical Research:Solid Earth (1978—2012), 93(B2):1073-1085. |
| [17] | Jiang M, Galvé A, Hirn A, et al. 2006. Crustal thickening and variations in architecture from the Qaidam basin to the Qang Tang (North-Central Tibetan Plateau) from wide-angle reflection seismology. Tectonophysics, 412(3):121-140. |
| [18] | Kosarev G, Kind R, Sobolev S V, et al. 1999. Seismic evidence for a detached Indian lithospheric mantle beneath Tibet. Science, 283(5406):1306-1309. |
| [19] | Li C, Van der Hilst R D, Meltzer A S, et al. 2008. Subduction of the Indian lithosphere beneath the Tibetan Plateau and Burma. Earth and Planetary Science Letters, 274(1-2):157-168. |
| [20] | Li Q S, Peng S P, Gao R. 2004. A review on the Moho Discontinuity beneath the Tibetan Plateau. Geological Review (in Chinese), 50(6):598-612. |
| [21] | Liang X F, Sandvol E, Chen Y J, et al. 2012. A complex Tibetan upper mantle:A fragmented Indian slab and no south-verging subduction of Eurasian lithosphere. Earth and Planetary Science Letters, 333-334:101-111. |
| [22] | McNamara D E, Walter W R, Owens T J, et al. 1997. Upper mantle velocity structure beneath the Tibetan Plateau from Pn travel time tomography. Journal of Geophysical Research, 102(B1):493-505. |
| [23] | Mechie J, Sobolev S V, Ratschbacher L, et al. 2004. Precise temperature estimation in the Tibetan crust from seismic detection of the α-β quartz transition. Geology, 32(7):601-604. |
| [24] | Molnar P, England P, Martinod J. 1993. Mantle dynamics, uplift of the Tibetan Plateau, and the Indian monsoon. Reviews of Geophysics, 31(4):357-396. |
| [25] | Nábělek J, Hetényi G, Vergne J, et al. 2009. Underplating in the Himalaya-Tibet collision zone revealed by the Hi-CLIMB experiment. Science, 325(5946):1371-1374. |
| [26] | Nolet G. 1987. Seismic wave propagation and seismic tomography.//Seismic Tomography. Netherlands:Springer, 1-23. |
| [27] | Owens T J, Zandt G. 1997. Implications of crustal property variations for models of Tibetan plateau evolution. Nature, 387(6628):37-43. |
| [28] | Paige C C, Saunders M A. 1982. LSQR:An algorithm for sparse linear equations and sparse least squares. ACM Transactions on Mathematical Software (TOMS), 8(1):43-71. |
| [29] | Shi D N, Zhao W, Brown L, et al. 2004. Detection of southward intracontinental subduction of Tibetan lithosphere along the Bangong-Nujiang suture by P-to-S converted waves. Geology, 32(3):209-212. |
| [30] | Teng J W, Xiong S B, Zhang Z J. 1997. Review and prospects for geophysical study of the deep lithosphere structure and tectonics in Qinghai-Xizang (Tibet) Plateau. Chinese Journal of Geophysics (in Chinese), 40(S1):121-139. |
| [31] | Teng J W, Ruan X M, Zhang Y Q, et al. 2012. The stratificational velocity structure of crust and covering strata of upper mantle and the orbit of deep interaquifer substance locus of movement for Tibetan Plateau. Acta Petrologica Sinica (in Chinese), 28(12):4077-4100. |
| [32] | Teng J W, Zhang Z J, Bai W M, et al. 2004. Lithosphere Physics (in Chinese). Beijing:Science Press. |
| [33] | Tian Y, Zhao D P, Liu C, et al. 2009. A review of body-wave tomography and its applications to studying the crust and mantle structure in China. Earth Science Frontiers (in Chinese), 16(2):347-360. |
| [34] | Tian X B, Wu Q J, Zhang Z J, et al. 2005. Joint imaging by teleseismic converted and multiple waves and its application in the INDEPTH-Ⅲ passive seismic array. Geophysical Research Letters, 32(21):L21315. |
| [35] | Tilmann F, Ni J, INDEPTH Ⅲ Seismic Team. 2003. Seismic imaging of the downwelling Indian lithosphere beneath central Tibet. Science, 300(5624):1424-1427. |
| [36] | Tseng T L, Chen W P, Nowack R L. 2009. Northward thinning of Tibetan crust revealed by virtual seismic profiles. Geophysical Research Letters, 36(24), doi:10.1029/2009GL040457. |
| [37] | Vandecar J C, Crosson R S. 1990. Determination of teleseismic relative phase arrival times using multi-channel cross-correlation and least squares. Bulletin of the Seismological Society of America, 80(1):150-169. |
| [38] | Wittlinger G, Masson F, Poupinet G, et al. 1996. Seismic tomography of northern Tibet and Kunlun:evidence for crustal blocks and mantle velocity contrasts. Earth Planet. Sci. Lett., 139(1-2):263-279. |
| [39] | Wu F Y, Huang B C, Ye K, et al. 2008. Collapsed Himalayan-Tibetan orogen and the rising Tibetan Plateau. Acta Petrologica Sinica (in Chinese), 24(1):1-30. |
| [40] | Wu Q J, Zeng R S. 1998. The crustal structure of Qinghai-Xizang plateau inferred from broadband teleseismic waveform. Chinese Journal of Geophysics (in Chinese), 41(5):669-679. |
| [41] | Wu Q J, Zeng R S, Zhao W J. 2004. Himalaya-Tibet Plateau up mantle inclined structure and continental collision process. Science in China (in Chinese), 34(10):919-925. |
| [42] | Yang W C. 1993. Application of Seismic Tomography (in Chinese). Beijing:Geological Publishing House. |
| [43] | Yin A, Harrison T M. 2000. Geologic evolution of the Himalayan-Tibetan orogen. Annual Review of Earth and Planetary Sciences, 28(1):211-280. |
| [44] | Zhang F X, Wu Q J, Li Y H. 2013. The traveltime tomography study by teleseismic P wave data in the Northeast China area. Chinese Journal of Geophysics (in Chinese), 56(8):2690-2700, doi:10.6038/cjg20130818. |
| [45] | Zhang Z J, Deng Y F, Teng J W, et al. 2011. An overview of the crustal structure of the Tibetan plateau after 35 years of deep seismic soundings. Journal of Asian Earth Sciences, 40(4):977-989. |
| [46] | Zhao D P, Hasegawa A, Horiuchi S. 1992. Tomographic imaging of P and S wave velocity structure beneath northeastern Japan. Journal of Geophysical Research:Solid Earth (1978—2012), 97(B13):19909-19928. |
| [47] | Zhao J M, Yuan X H, Liu H B, et al. 2010. The boundary between the Indian and Asian tectonic plates below Tibet. Proceedings of the National Academy of Sciences of the United States of America, 107(25):11229-11233. |
| [48] | Zhao J M, Zhao D P, Zhang H, et al. 2014. P-wave tomography and dynamics of the crust and upper mantle beneath western Tibet. Gondwana Research, 25(4):1690-1699. |
| [49] | Zhao W J, Kumar P, Mechie J, et al. 2011. Tibetan plate overriding the Asian plate in central and northern Tibet. Nature Geoscience, 4(12):870-873. |
| [50] | Zheng H W, Li T D, Gao R, et al. 2007. Teleseismic P-wave tomography evidence for the Indian lithospheric mantle subducting northward beneath the Qiangtang Terrane. Chinese Journal of Geophysics (in Chinese), 50(5):1418-1426. |
| [51] | 高锐, 王海燕, 王成善等. 2011. 青藏高原东北缘岩石圈缩短变形——深地震反射剖面再处理提供的证据. 地球学报, 32(5): 513-520. |
| [52] | 李秋生, 彭苏萍, 高锐. 2004. 青藏高原莫霍面的研究进展. 地质论评, 50(6): 598-612. |
| [53] | 滕吉文, 熊绍柏, 张忠杰. 1997. 青藏高原深部结构与构造地球物理研究的回顾和展望. 地球物理学报, 40(S1): 121-139. |
| [54] | 滕吉文, 张中杰, 白武明等. 2004. 岩石圈物理学. 北京: 科学出版社. |
| [55] | 滕吉文, 阮小敏, 张永谦等. 2012. 青藏高原地壳与上地幔成层速度结构与深部层间物质的运移轨迹. 岩石学报, 28(12): 4077-4100. |
| [56] | 田有, 赵大鹏, 刘财等. 2009. 体波走时层析成像方法及其在中国壳幔结构研究中的应用评述. 地学前缘, 16(2): 347-360. |
| [57] | 吴福元, 黄宝春, 叶凯等. 2008. 青藏高原造山带的垮塌与高原隆升. 岩石学报, 24(1): 1-30. |
| [58] | 吴庆举, 曾融生. 1998. 用宽频带远震接收函数研究青藏高原的地壳结构. 地球物理学报, 41(5): 669-679. |
| [59] | 吴庆举, 曾融生, 赵文津. 2004. 喜马拉雅—青藏高原的上地幔倾斜构造与陆-陆碰撞过程. 中国科学: D 辑, 34(10): 919-925. |
| [60] | 杨文采. 1993. 应用地震层析成像. 北京: 地质出版社. |
| [61] | 张风雪, 吴庆举, 李永华. 2013. 中国东北地区远震P波走时层析成像研究. 地球物理学报, 56(8): 2690-2700, doi: 10.6038/cjg20130818. |
| [62] | 郑洪伟, 李廷栋, 高锐等. 2007. 印度板块岩石圈地幔向北俯冲到羌塘地体之下的远震P波层析成像证据. 地球物理学报, 50(5): 1418-1426. |