1 引言
自从华北克拉通东部岩石圈地幔根大规模减薄以及物理化学性质发生明显改变这一地质现象被地学界广泛认识以来,由于对该现象的深入研究可望为认识大陆的形成及演化、构筑更完善的地球形成与演化体系提供新的突破口(朱日祥等,2011),因此,华北克拉通破坏越来越成为世界地学界研究热点.
华北克拉通破坏研究的一个重要内容是对其范围、过程和机制的研究,多年来学者们从不同的角度或研究领域给出了各自的观点和认识,对破坏过程主要有岩石圈或下地壳拆沉和软流圈物质热化学侵蚀等不同解释(周新华,2006;高山等,2009;郑永飞等,2009;朱光等,2008).地震波探测方法作为确定岩石圈物理性质、分层及横向不均匀结构以及获取各向异性等动力学特征的主要手段,尤其在精确了解岩石圈的结构和厚度方面在华北克拉通的构造演化研究中起着非常重要的作用,近年来也取得一些重要成果(Chen et al., 2008,2009,2006b; Chen,2009a; 朱日祥等, 2011,2012; 朱日祥和郑天愉,2009;陈凌等, 2007,2010).然而,由于经济技术等因素的影响,对地壳以下更深部的研究资料大多来源于天然地震,对于深达地幔的大量地震波探测研究数据来自于远震,作为与天然源相比有着显著特点和优势的人工源探测数据却比较稀少.我们将岩石圈除去地壳的以下部分称为地幔盖层(滕吉文等,2000).要得到地幔盖层甚至更深部的人工源信息,必须进行长观测距(400~800 km)人工源探测实验.这样的探测研究可以弥补天然源观测的不足和使结果相互印证,因此,国内外都十分重视人工源深部探测实验(Hirn et al., 1973,1975; Hirn,1977; Bamford et al., 1976; Kaminski et al., 1976; Fuchs,1979; Kind,1974; Ansorge et al., 1979; Ryaboy et al., 1977; Perchuc and Thvbo, 1996;Marek et al., 2006; Behm et al., 2007;李松林等,2011),20世纪80年代前苏联为得到地幔深部人工源探测信息利用核爆破进行了长观测距深地震测深实验(Priestley et al., 1994; Egorkin et al., 1987; Ryaboy,1977).同时,国内外学者在有关的正、反演理论和方法上也取得了许多进展,给人工源方法研究打下了坚实的基础(Zelt and Smith, 1992; Zelt et al., 1994; Zelt and White, 1995;Hole and Zelt, 1995;徐涛等,2004;Xu et al., 2006,2010,2014;李飞等,2013).
本文利用观测距长达600~700 km的文登—阿拉善左旗长观测距宽角反射/折射剖面资料,识别并分析了反映地壳和岩石圈盖层结构特征的震相,对华北克拉通东部地壳和地幔盖层结构进行了重建.该剖面从山东文登至新疆阿拉善左旗(桩号-100~-1700 km),本文研究区段为剖面东部宁津—忻州段(桩号-100~-1000 km),剖面西段的研究将另文发表.对人工源来说,地幔盖层构造信息十分难得,本文更侧重于对地幔盖层资料和结果的分析确认,但要获得正确的地幔盖层认识,必须与对地壳结构的解释同时进行.我们在计算中采用二维射线追踪反演技术和正演拟合交互进行的方法,以期给出地壳和地幔盖层准确可靠的地震学构造特征,为更深入的解释和研究提供可信的依据,在此基础上结合已有的研究结果,给出了对华北克拉通破坏机制和过程的认识. 2 数据采集和震相分析
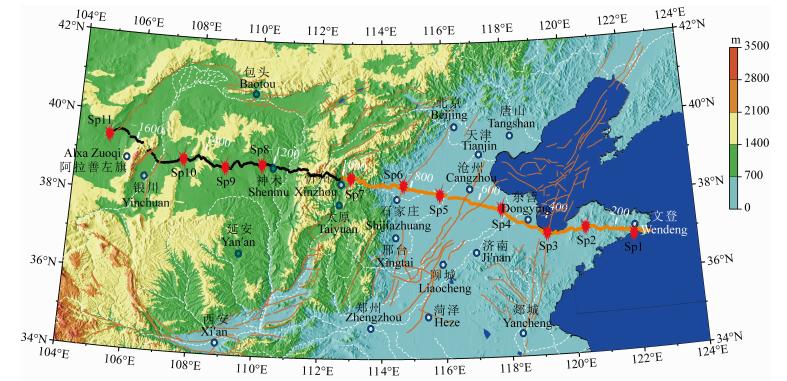
全测线东起黄海边缘的宁津镇附近(起点桩号-100 km,坐标为:122°30′00″,36°57′28″),向西经山东省的文登、垦利、沾化、庆云,河北省的南皮、献县、饶阳、新乐,山西省的忻州、岢岚、陕西的神木县,进入内蒙古自治区的阿拉善左旗北部区域(终点桩号-1600 km,坐标为:105°04′20″,39°14′29″).测线基本近东西方向展布,全长1500 km,沿测线实施11次爆破,单炮药量1.2~11.0 t,采用井下爆破激发方式,多井组合,单井井深达到50~80 m.共投入DAS型和PDS型三分量数字地震测深仪器500台,观测点距2~5 km,在重点探测区段和构造横向 变化剧烈的地段,点距适当加密至2.0~2.5 km,图 1为测线位置图. 本文研究区段为上述测线的-100~-1000 km桩号(宁津—忻州)段,采用SP1-SP7共7炮观测数据,炮点参数见表 1.
 | 图 1 测线及炮点和观测点位置图.橘色线段为本文研究区段 Fig.1 The location map of shot points and receivers. orange line is for study segment in this paper |
|
|
表 1 炮点参数表 Table 1 The list of shot parameters |
记录截面采用1~10 Hz的带通滤波,对地壳震相拾取时一般采用6 km·s-1的折合速度,由于本文重点讨论地幔盖层震相和构造特征故文中记录截面采用8.0 km·s-1的折合速度.下面以Moho面为界分别对地壳和地幔盖层两部分震相进行讨论. 2.1 地壳震相
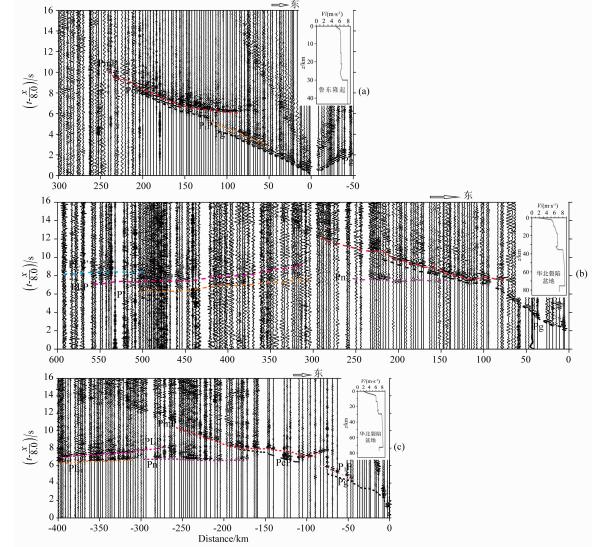
(1)上地壳折射震相Pg.该波组一般来自于结晶基底以上的折射,在记录截面中为初至波.当地壳浅部界面或接近界面的强梯度带特征明显时,该波组可为沿界面滑行波或强梯度带内的折射波.研究区内位于鲁东隆起的SP1和SP2炮的Pg波组追踪距离长达100 km以上,走时曲线接近直线,视速度单一,可视为有较多的滑行波成分.SP7炮位于盆地西侧部分进入太行隆起区域,其Pg波也出现类似特征.而位于华北盆地内各炮的Pg波(图 2b,2c),图 3d)视速度从近炮点20 km内约3.5 km·s-1的较低视速度增加到20 km后的6.5 km·s-1,追踪距离较短,Pg主要以回折波形式出现,说明地表覆盖有较厚的沉积层.
 | 图 2 三炮记录截面和一维速度-深度模型 (a)SP1炮(148 km);(b)SP3(W)炮西支(385km);(c)SP4(E)炮东支(520 km). Fig. 2 Record sections and velocity-depth functions for the three shots (a)For shot SP1(148 km);(b)For the west branch of shot SP3(W)(385 km);(c)For the east branch of shot SP4(E)(520 km). |
 | 图 3 二炮记录截面和一维速度-深度模型 (d)SP5(E)炮东支(703 km);(e)SP5(W)炮西支(703 km);(f)SP6(E)炮东支(808 km). Fig. 3 Record sections and velocity-depth functions for the two shots (d)For the east branch of shot SP5(E)(703 km);(e)For the west branch of shot SP5(W)(703 km); (f)For the east branch of shot SP6(E)(808 km). |
(2)壳内反射震相P1P和PcP.在Pg震相之后 出现的是上地壳反射震相P1P,该波组震相较弱,紧 随Pg波之后出现为明显的反射震相.且在各炮中普遍存在,出现区间一般为炮检距50~100 km,反映了华北盆地上地壳一个普遍存在的速度界面.上 部地壳与下部地壳分界面反射震相PcP,该震相相对较强(图 2a,2c),甚至部分影响到PmP震相的追踪,出现区间一般为炮检距100~170 km(嘉世旭和张先康,2005).由于P1P和PcP震相的存在,地壳可分为上、中、下三层,这与已有的研究结果一致(许志琴和张国伟,2013).
(3)下地壳回折和Moho界面临界外反射震相PmP.一般在炮检距80 km以后可清晰追踪到,整个追踪段表现为强震相,视速度约为7.0 km·s-1.主要为Moho面临界外反射波或下地壳折射波,取决于下地壳底部的速度结构,记为PmP震相.其追踪距离和震相的清晰度在不同区段呈现明显差异.进入鲁东隆起的SP1(W),SP2(E)炮PmP震相较为清晰;华北盆地内的SP2(W),SP3(E,W),SP4(E,W),SP5(E),SP6(E)炮PmP震相波组振幅弱、追踪距离较短或延续时间长,表现较为复杂;而进入太行山西部的SP5(W),SP6(W),SP7(E,W)炮PmP震相清晰,追踪距离长.不同区域PmP波形的差异反映了Moho 面性质的不同(嘉世旭和张成科,2009).华北裂陷盆地区PmP震相追踪距离较短,波组往往为一个复杂的波列,因此,该区域Moho面不是一个简单的一级间断面,而是一个复杂的过渡带. 2.2 岩石圈震相(PL)
在记录截面上辩识出的Moho面以下属于地幔盖层的震相为Pn、PL1、PLP.区内共有7炮,除位于测线东端鲁东隆起内的SP1和SP2炮由于观测距较短未接收到地幔盖层震相外,其余5炮均识别出明显的来自上地幔顶部和地幔盖层的震相.其中,识别出Pn震相的包括:SP3炮东西两支、SP4炮东西两支、SP5炮东西两支、SP6炮东西两支,识别出PL1和PLP震相的包括:SP3炮西支、SP4炮东西两支、SP5炮东西两支、SP6炮(E)、SP7(E).由于识别出这些震相的各炮基本上处在华北裂陷盆地同一个构造单元内,各炮同一震相特征基本相似,故分别将各震相共同特征概括讨论如下:
(1)上地幔顶部折射震相Pn.该震相应为沿Moho界面下的滑行波,但由于难以区分,通常把上地幔顶部的回折波也算在其中.在本研究区由于观测系统设计合理、观测距离长、炮点激发效果好,因此Moho面以下波组追踪距离长、折射波穿透较深.这样,Moho面下的折射波组可以明显看到两个震相,根据视速度将其分为Pn和PL1震相.Pn代表滑行波或地幔顶部接近Moho面的折射波,视速度在 8.0~8.1 km·s-1,追踪距离在(炮检距)150~300 km. 与PmP震相类似的特点是射线进入太行山以西的波组其Pn震相较为清晰可靠,追踪距离较长,而在华北盆地内各炮Pn波组相对模糊甚至难以辨认,(SP1和SP2炮)或应归于下述PL1震相(SP5(E)).Pn震相的特点更进一步说明盆地内Moho面具有较复杂的结构,该段Moho面被改造的痕迹明显.
(2)地幔盖层折射震相PL1.该震相在记录截面上位于Pn震相后部,一般与其相连,略有间断,因此当波组穿透不深时,常被看做Pn震相.在研究区内PL1震相虽然紧随Pn远端,但走时曲线有一 明显转折,其视速度比Pn较高,应为8.1~8.5 km·s-1,在炮检距约300 km之后出现,符合折射波特征.因此,PL1应为地幔盖层内形成的回折波,它主要反映地幔盖层上部介质的速度特征.这一震相在研究区尤其华北裂陷盆地内较为清晰,也表明该区域岩石圈上部为正梯度分布.
(3)地幔盖层下界面反射震相PLP.在研究区7炮记录中有5炮可以辩识出这一震相,大多震相在记录截面图上清晰可见,且可以连续追踪较长距离,可靠性仍然较高(见图 2、图 3).尤其SP5(E)炮PLP震相非常清晰,信噪比与地壳震相无异.此外,SP3炮、SP4炮该震相也比较清晰,相比之下SP6和SP7炮震相相对较弱.总体来说,该波组代表的反射面基本上遍及整个研究区,并形成射线的追踪和相遇,且东部(SP3、SP4、SP5(E))信息更为可靠.各炮PLP震相,追踪距离一般在(炮检距)350~600 km,远于PL1震相,且与PL1有数十千米的交叠,走时在PL1之后约1 s左右,其特征可以认定为反射震相.这表明该区域上地幔有一个较清晰的反射界面存在.与PmP震相类似该震相除SP5(E)炮较简单外,其余PLP震相均不同程度存在复杂波列现象,意味着存在一个梯级带或过渡带的可能.此外,在SP5炮记录截面中PLP之后与之平行地出现一组同样清晰的震相,根据其特征判断可能为二次反射震相PLP′(如图 3d所示).与此类似的SP7炮记录中也出现这一震相,由于篇幅所限有关这一震相问题留待另文讨论.除PLP′之外,各炮PLP震相之后没有出现可能的反射或折射震相,PLP即代表了该区域内上地幔最为明显和突出的介质分层信息.此外,该层面以下没有折射震相出现,或将意味着该层 面以下介质速度有发生倒转的可能.由一维拟合结 果可知该区域内观测到的PLP震相对应的界面深度为70~80 km(图 2、图 3左(右)上角),按炮点位置区分,东部界面深度较浅,西部较深.根据该地区接收函数研究结果华北裂陷盆地下部岩石圈底界约为60~80 km(Chen et al., 2009; 朱日祥等,2011;Chen et al., 2006b),与上述一维结果相近.综合以上分析,有理由认为PLP应为该区域岩石圈底界面反射震相. 3 速度结构拟合与反演 3.1 一维走时拟合
图 4给出了一维走时拟合的结果.结果显示,东部鲁东隆起浅层速度较高,表明沉积盖层较薄,与华北裂陷盆地区域略有不同.而总体来看华北盆地地 壳结构大致相同,依据PmP震相和壳内反射震相 P1P、PcP,区域内地壳厚度约为32 km左右,上部地壳(P1P代表的界面以上)深约15 km,中部地壳(P1P与PcP代表的界面之间)深约25 km.向西进 入太行隆起区后地壳厚度明显增加.上地壳速度2.0~6.1 km·s-1; 中地壳速度约为6.2~6.5 km·s-1;下地壳速度约为6.6~6.9 km·s-1.
 | 图 4 一维拟合结果 (a)SP1炮东支(148 km);(b)SP3(W)炮西支(385km);(c)SP4(E)炮东支(520 km);(d)SP5(E)炮东支(703 km); (e)SP5(W)炮西支(703 km);(f)SP6(E)炮东支(808 km). Fig. 4 The results of 1-D travel time fitting (a)The east branch of shot SP1(148 km);(b)The west branch of shot SP3(W)(385 km);(c)The east branch of shot SP4(E)(520 km); (d)The east branch of shot SP5(E)(703 km);(e)The west branch of shot SP5(W)(703 km);(f)The east branch of shot SP6(E)(808 km). |
Moho面以下除反映上地幔顶部的Pn震相外,还可识别出反映地幔盖层结构的折射震相PL1和反射震相PLP,这三个震相使我们得以探讨上地幔顶部和地幔盖层结构特征.一维走时拟合显示,PL1作为折射震相其回折波穿透深度达Moho面下约20~30 km,明显表现为正梯度分布特征,速度约为8.1~8.5 km·s-1.PLP震相的走时曲线形态表明地幔盖层速度较低,可能有低速层或高低速互层等复杂结构,较低的平均速度和速度梯度是这一地区地幔盖层的结构特征.拟合得到华北盆地内地幔盖层底部反射界面深度约为70~83 km,进入太行隆起后界面深度显著增加.根据接收函数在该界面上下的相位倒转推断(Chen et al., 2006b,2006a; Chen,2009a),岩石圈底界面向下会出现介质速度倒转,故拟合中将界面以下假设为低速. 3.2 二维地壳速度结构
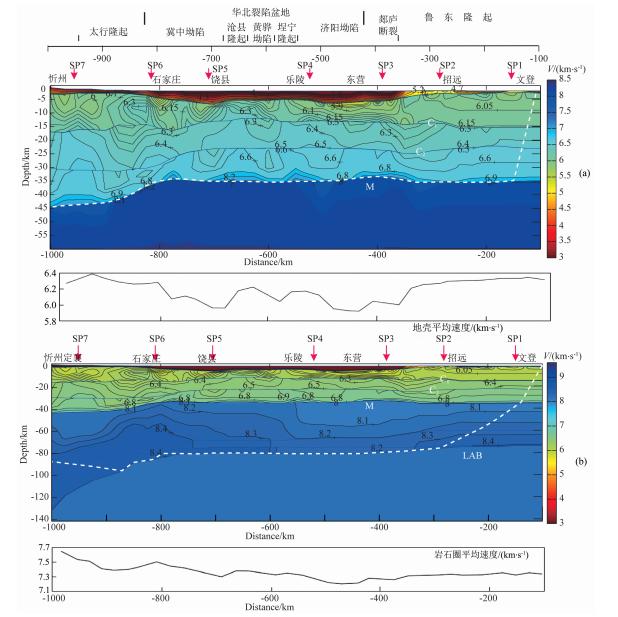
在震相分析和一维拟合的基础上,参考已有的临近区域的测深和地质等研究结果(张先康等,1996;王椿镛等,1994;张成科等,2002;王夫运等,2004;段永红等,2002;胥颐等,2006;赵金仁等,2006;李松林等,2001),构建一个接近水平分层、横向速度均匀的二维的初始模型,并利用二维射线追踪反演方法(Zelt and Smith, 1992; Zelt et al., 1994; Zelt and White, 1995; 刘志等, 2005,2009)对地壳结构进行速度界面的联合反演计算.由于该区域结构复杂、横向变化较大,加上较为简单的初始模型往往使反演无法收敛,我们采取的是正、反演结合的方法,即通过反演计算和人工修改模型正演拟合交替进行反复计算,直至最终得到满意结果.经如此计算我们使震相拟合误差(除个别点外)小于0.1 s,且均方根走时残差减至0.239,χ2=1.519,据此认为结果是基本收敛和可信的.图 5a为壳内震相(包括Pn)反演最终结果的射线追踪图.地壳速度结构反演结果显示(图 6a):鲁东隆起和西部太行隆起基底埋深较浅,约2.5~3.5 km;华北盆地由于巨厚的第四纪沉积使基底深度可达6 km以上,速度较低,且横向变化大.研究区地壳纵向三层呈现不同的速度特征:与震相P1P对应的C1界面埋深约15 km,地表至C1为上地壳,速度为6.0~6.1 km·s-1(除基底以外),且横向变化较大;与震相PcP对应的C2界面深约25 km,C1—C2为中地壳,速度相对均匀,约为6.2~6.4 km·s-1;C2—Moho面为下地壳,速度为6.5~7.0 km·s-1,速度梯度较大.研究区Moho面深度约35 km左右,盆地内有界面起伏,位于济阳坳陷下的Moho面最浅(约33 km),800 km以上进入太行隆起,Moho面逐渐加深达40 km以上.从构造单元来看,鲁东隆起和华北裂陷盆地内各界面深度变化不大,华北裂陷盆地内速度变化不论横向还是纵向都相对复杂.进入太行隆起区界面明显加深,下地壳速度横向变化加大.由震相分析得知研究区Moho面性质复杂,很可能有一定厚度的过渡层存在,不同炮或不同区域震相特征的差异表明了其横向Moho面厚度和速度梯度的差异,而这个厚度目前还无法得到量化的结果,只能通过速度梯度和震相性质差异推测华北裂陷盆地内Moho界面大部分不是单纯的一级间断面.
 | 图 5 研究区射线追踪和走时拟合图 彩色短线为观测值,黑色圆点为计算值;(a)地壳(b)地幔盖层. Fig. 5 Ray tracing and travel time fitting for study area Colorized short line is observed data,black circle is calculated data.(a)Crustal structure;(b)Lower lithospheric structure. |
 | 图 6 地壳和地幔盖层速度结构图及平均速度曲线 (a)地壳内结果;(b)岩石圈结果.白虚线内为射线覆盖范围;LAB界面以下无震相信息,故速度为假定值,不代表计算结果. Fig. 6 2-D velocity structure along the profile (a)Crust section;(b)Lithosphere section. The area covered with rays locates above the dashed line. There are no data below LAB,therefor the velocity is assumed. |
根据得到的岩石圈震相(Pn、PL1、PLP)以及前述震相分析,并在一维解释基础上,从浅到深反复进行二维拟合计算,得到最佳的拟合结果.追踪计算如图 5b所示,虽然识别出PLP震相的炮不多,射线不够密集,但仍基本覆盖了-250~-900 km桩号的岩石圈底界面,同时,还有Pn和PL1震相对地幔盖层顶部速度的控制,因此,拟合结果应是可信的.而这一射线覆盖区域东部进入了鲁东隆起、西部开始进入太行隆起,涵盖了整个华北裂陷盆地.图 6b为拟合得到的地幔盖层速度结构图.结果显示,研究区太行山以东岩石圈底界面(LAB)平均深度约80 km,东部最浅处75 km.SP5炮(西支)PLP震相在-870 km桩号反射点深度已超过90 km,表明向西进入太行隆起,界面呈现加深趋势.在深度60 km以上,横向速度变化基本上呈西高东低趋势,尤其东部郯庐断裂带附近速度最低.60 km以下,东端速度约8.3 km·s-1,盆地东部-300~-600 km桩号(包括郯庐断裂)速度相对较低,约8.2 km·s-1,西部较高,约8.4 km·s-1.纵向速度分布为地幔顶部速度8.0 km·s-1左右,60 km以上为约0.01 s-1正梯度变化,60 km以下由于震相信息不足速度梯度难以确认. 4 讨论与结论
对研究区地壳结构的解释,我们采用的是反演和正演拟合交替进行的方法,对横向变化复杂的构造,射线追踪反演往往失败,这时用正演拟合之后再反演,效果较好.尽管不是完全的反演计算,但与完全正演拟合方法不同,不仅提高了计算效率同时也增加了反演收敛判别指标.根据计算得到的地壳结构分为0~15 km的上地壳(刚性岩石圈板块)、15~25 km 的中地壳(含韧性或黏滞性夹层)及25~45 km下地壳.这与根据反射地震等综合结果得到的东亚地壳细化分层结论非常吻合(许志琴和张国伟,2013).地壳速度结构与已有的该区域正演拟合探测结果也基本相同(Jia et al., 2014; Tian et al., 2014).地壳厚度结果显示,太行山山前断裂以东的华北盆的地壳厚度平均为35 km,横向变化较小,进入太行隆起后地壳厚度增加至40 km以上,反映了以太行为界两侧构造的巨大差异.从地壳平均速度 曲线看(图 6),华北裂陷盆地内部不同次级块体,平均速度有明显不同.隆起区平均速度较高,如太行隆起(6.26~6.39 km·s-1)和鲁东隆起(6.33~ 6.21 km·s-1);坳陷区平均速度较低,如济阳坳陷(5.93~6.16 km·s-1)和冀中坳陷(5.97~6.08 km·s-1).小规模的沧县隆起、黄骅坳陷、埕宁隆起的平均速度也较好地与平均速度曲线上的起伏相对应.结合震相分析可以看出:隆起区Moho界面完整、反射清晰、横向相对均匀,坳陷区Moho界面不清、反射波列较长,为一复杂的构造过渡带.这些次级构造块体的差异反映了中、新生代以来华北古大陆在东部构造应力场作用下的差异构造运动(嘉世旭和张先康,2005).盆地内中强地震的孕育也可能与这些次级块体地壳结构不同和构造差异相关.
我们得到的华北克拉通东部华北裂陷盆地岩石圈厚度约为75~80 km,这个结果与利用接收函数 得到的结果(Chen et al., 2006b,2006a,2009; Chen,2009; 朱日祥等,2012)基本一致,与面波和体波成像结果(Zhao et al., 2012; Jiang et al., 2013)没有矛盾.在该地区由东向西岩石圈逐渐增厚,在位于太行 隆起带的870 km桩号处(图 1)岩石圈厚度为90 km 左右,与地壳厚度呈现相同的增厚特征.太行隆起西部地幔盖层介质速度较高,岩石圈平均速度曲线呈显著增加趋势.该地区上地幔顶部速度8.0 km·s-1,在地幔盖层顶部附近有一个较大的速度梯度(0.01 s-1). 震相分析显示Moho面和岩石圈底界不是一个尖锐的间断面而是有一定厚度的过渡带,这可能意味着岩浆的底侵或热侵蚀作用是该地区主导因素(朱光等,2008;李松林等,2011).郯庐断裂附近地幔盖层显示出低速特点,从岩石圈平均速度曲线也可以看出,在郯庐断裂和济阳坳陷附近平均速度最低.据前人研究结果,岩石圈结构变化是一个复杂而缓慢的过程,应伴有热物质上涌且影响到Moho面附近(朱日祥等, 2012,2011;陈凌等,2007;徐义刚等,2009;朱光等,2002),郯庐断裂带附近是岩石圈地幔内的薄弱带(朱日祥和郑填愉,2009),也是软流圈物质上涌的重要通道(徐义刚等,2009).本文得到的剖面速度分布、郯庐断裂带附近的平均低速、壳幔和岩石圈底界的复杂过渡带等结果支持上述研究结论.
致谢 衷心感谢中国地震局地球物理勘探中心一百多名同事在获取本项目野外观测资料中的辛勤工作和诸位同行在本项目研究中给予的启发和帮助.衷心感谢靳书勤先生和宁杰远教授的帮助.衷心感谢审稿专家的宝贵意见.| [1] | Ansorge J, Bonjer K P, Emter D. 1979. Structure of the uppermost mantle from long-range seismic observations in southern Germany and the Rhinegraben area. Tectonophysics, 56(1-2):31-48. |
| [2] | Bamford D, Faber S, Jacob B, et al. 1976. A lithospheric seismic profile in Britain-I preliminary results. Geophys. J. Int., 44(1):145-160. |
| [3] | Behm M, Brückl E, Mitterbauer U. 2007. A new seismic model of the eastern Alps and its relevance for geodesy and geodynamics. Vermessung & Geoinformation, 121-133. |
| [4] | Chen L, Zheng T Y, Xu W W. 2006a. Receiver function migration image of the deep structure in the Bohai Bay Basin, eastern China. Geophysical Research Letters, 33(20):L20307, doi:10.1029/2006GL027593. |
| [5] | Chen L, Zheng T Y, Xu W W. 2006b. A thinned lithospheric image of the Tanlu Fault Zone, eastern China:Constructed from wave equation based receiver function migration. J. Geophys. Res., 111(B9):B09312, doi:10.1029/2005JB003974. |
| [6] | Chen L, Zhu R X, Wang T. 2007. Progess in continental lithosphere studies. Earth Science Frontiers (in Chinese), 14(2):58-75. |
| [7] | Chen L, Wang T, Zhao L, et al. 2008. Distinct lateral variation of lithospheric thickness in the Northeastern North China Craton. Earth and Planetary Science Letters, 267(1-2):56-68. |
| [8] | Chen L. 2009. Lithospheric structure variations between the eastern and central North China Craton from S- and P-receiver function migration. Physics of the Earth and Planetary Interiors, 173(3-4):216-227. |
| [9] | Chen L, Cheng C, Wei Z G. 2009. Seismic evidence for significant lateral variations in lithospheric thickness beneath the central and western North China Craton. Earth and Planetary Science Letters, 286(1-2):171-183. |
| [10] | Chen L, Wei Z G, Cheng C. 2010. Significant structural variations in the Central and Western North China craton and its implications for the craton destruction. Earth Science Frontiers, 17(1):212-228. |
| [11] | Duan Y H, Zhang X K, Fang S M, et al. 2002. Three-dimensional finite-difference tomography of velocity structure of the upper crustal in north China. Chinese J. Geophys. (in Chinese), 45(3):362-369. |
| [12] | Egorkin A V, Zuganov S K, Pavlenkova N A, et al. 1987. Results of lithospheric studies from long-range profiles in Siberia. Tectonophysics, 140(1):29-47. |
| [13] | Fuchs K. 1979. Structure, physical properties and lateral heterogeneities of the subcrustal lithosphere from long-range deep seismic sounding observations on continents. Tectonophysics, 56(1-2):1-15. |
| [14] | Gao S, Zhang J F, Xu W L, et al. 2009. Delamination and destruction of the North China Craton. Chinese Science Bulletin, 54(19):3367-3378, doi:10.1007/s11434-009-0395-9. |
| [15] | Hirn A, Steinmetz L, Kind R, et al. 1973. Long-range profiles in western Europe:II. Fine structure of the lower lithosphere in France (southern Bretagne). Z. Geophys., 39:363-384. |
| [16] | Hirn A, Prodehl C, Steinmetz L. 1975. An experimental test of models of the lower lithosphere in Bretagne (France). Ann. Geophys., 31:517-530. |
| [17] | Hirn A. 1977. Anisotropy in the continental upper mantle:possible evidence from explosion seismology. Geophys. J. Int., 49(1):49-58. |
| [18] | Hole J A, Zelt B C. 1995. 3-D finite-difference reflection traveltimes. Geophys. J. Int., 121(2):427-434. |
| [19] | Jia S X, Zhang X K. 2005. Crustal structure and comparison of different tectonic blocks in North China. Chinese J. Geophys. (in Chinese)., 48(3):611-620, doi:10.3321/j.issn:0001-5733.2005.03.019. |
| [20] | Jia S X, Zhang C K, Zhao J R, et al. 2009. Crustal structure of the rift-depression basin and Yanshan uplift in the northeast part of North China. Chinese J. Geophys. (in Chinese), 52(1):99-110. |
| [21] | Jia S X, Wang F Y, Tian X F, et al. 2014. Crustal structure and tectonic study of North China Craton from a long deep seismic sounding profile. Tectonophysics, 627:48-56. |
| [22] | Jiang M M, Ai Y D, Chen L, et al. 2013. Local modification of the lithosphere beneath the central and western North China Craton:3-D constraints from Rayleigh wave tomography. Gondwana Research, 24(3-4), doi:10.1016/j.gr.2012.06.018. |
| [23] | Kaminski W, Bamford D, Faber S, et al. 1976. A lithospheric seismic profile in Britain-II preliminary report on the recording of a local earthquake. J. Geophys., 42:103-110. |
| [24] | Kind R. 1974. Long range propagation of seismic energy in the lower lithosphere. J. Geophys., 40:189-202. |
| [25] | Li S L, Zhang X K, Song Z L, et al. 2001. Three-dimensional crustal structure of the capital area obtained by a joint inversion of DSS data from multiple profiles. Chinese J. Geophys. (in Chinese), 44(3):360-368, doi:10.3321/j.issn:0001-5733.2001.03.008. |
| [26] | Li F, Xu T, Wu Z B, et al. 2013. Segmentally iterative ray tracing in 3-D heterogeneous geological models. Chinese J. Geophys. (in Chinese), 56(10):3514-3522, doi:10.6038/cjg20131026. |
| [27] | Li S L, Lai X L, Liu B F, et al. 2011. Differences in lithospheric structures between two sides of Taihang Mountain obtained from the Zhucheng-Yichuan deep seismic sounding profile. Sci. China Earth Sci., 54(6):871-880, doi:10.1007/s11430-011-4191-4. |
| [28] | Liu Z, Zhang X K, Wang F Y, et al. 2005. 2-D crustal Poisson's ratio from seismic travel time inversion in Changbaishan Tianchi volcanic region. Acta Seismologica Sinica (in Chinese), 18(3):345-353. |
| [29] | Liu Z, Zhang X K, Pan J S, et al. 2009. Poisson's ratio distribution in the upper crust around the A'nyemaqên suture zone and its adjacent areas. Progress in Geophys. (in Chinese), 24(5):1627-1635, doi:10.3969/j.issn.1004-2903.2009.05.011. |
| [30] | Marek G, Alekander G, Randy K G, et al. 2006. Lithospheric structure beneath trans-Carpathian transect from Precambrian platform to Pannonian basin:CELEBRATION 2000 seismic profile CEL05. Journal of Geophysical Research, 111(B3):B03301, doi:10.1029/2005JB003647. |
| [31] | Perchuc E, Thybo H. 1996. A new model of upper mantle P-wave velocity below the Baltic Shield:indication of partial melt in the 95 to 160 km depth range. Tectonophysics, 253(3-4):227-245. |
| [32] | Priestley K, Cipar J, Egorkin A, et al. 1994. Upper-mantle velocity structure beneath the Siberian platform. Geophys. J. Int., 118(2):369-378. |
| [33] | Ryaboy V Z. 1977. Study of the structure of the lower lithosphere by explosion seismology in the USSR. J. Geophys., 43:593-610. |
| [34] | Teng J W, Wang G J, Zhang Z J, et al. 2000. The south-extending of 3-D S-wave velocity structure and Tanlu fault zone in South China. Chinese Science Bulletin (in Chinese), 45(23):2492-2498. |
| [35] | Tian X F, Zelt C A, Wang F Y, et al. 2014. Crust structure of the North China Craton from a long-range seismic wide-angle-reflection/refraction data. Tectonophysics, 634:237-245, doi:10.1016/j.tecto.2014.07.008. |
| [36] | Wang C Y, Zhang X K, Wu Q J, et al. 1994. Seismic evidence of detachment in north China basin. Chinese J. Geophys. (in Chinese), 37(5):613-620. |
| [37] | Wang F Y, Zhang X K, Chen Y, et al. 2004. 2-D P-wave velocity structure in the mideast segment of Zhangjiakou-Bohai tectonic zone:Anxin-Xianghe-Kuancheng DSS profile. Acta Seismologica Sinica (in Chinese), 26(7):31-41. |
| [38] | Xu T, Xu G M, Gao E G, et al. 2004. Block modeling and shooting ray tracing in complex 3D media. Chinese J. Geophys. (in Chinese), 47(6):1118-1126. |
| [39] | Xu T, Xu G M, Gao E G, et al. 2006. Block modeling and segmentally iterative ray tracing in complex 3D media. Geophysics, 71(3):T41-T51. |
| [40] | Xu T, Zhang Z, Gao E, et al. 2010. Segmentally iterative ray tracing in complex 2D and 3D heterogeneous block models. Bulletin of the Seismological Society of America, 100(2):841-850. |
| [41] | Xu T, Li F, Wu Z B, et al. 2014. A successive three-point perturbation method for fast ray tracing in complex 2D and 3D geological models. Tectonophysics, 627:72-81. |
| [42] | Xu Y, Liu J H, Hao T Y, et al. 2006. P-wave velocity structure and tectonics analysis of lithospheric mantle in eastern China seas and adjacent regions. Chinese J. Geophys. (in Chinese), 49(4):1053-1061. |
| [43] | Xu Y G, Li H Y, Pang C J, et al. 2009. On the timing and duration of the destruction of the North China Craton. Chinese Science Bulletin, 54(19):3379-3396, doi:10.1007/s11434-009-0346-5. |
| [44] | Xu Z Q, Zhang G W. 2013. Progress in tectonics and dynamics of China (East Asia)——Forum on frontiers of science & technology:Tectonics and dynamics of China (East Asia) (in Chinese). Scientia Sinica Terrae, 43(10):1527-1538. |
| [45] | Zelt C A, Smith R B. 1992. Seismic traveltime inversion for 2-D crustal velocity structure. Geophys. J. Int., 108(1):16-34. |
| [46] | Zelt C A, Forsyth D A, Milkereit B, et al. 1994. Seismic structure of the Central Metasedimentary Belt, southern Grenville Province. Can. J. Earth. Sci., 31(2):243-254. |
| [47] | Zelt C A, White D J. 1995. Crustal structure and tectonics of the southeastern Canadian Cordillera. J. Geophys. Res., 100(B12):24255-24273. |
| [48] | Zhang C K, Zhang X K, Zhao J R, et al. 2002. Study and review on crust-mantle velocity structure in Bohai bay and its adjacent areas. Acta Seismologica Sinica (in Chinese), 24(4):428-435. |
| [49] | Zhang X K, Wang C Y, Liu G D, et al. 1996. Fine crustal structure in Yanqing-Huailai region by deep seismic reflection profiling. Chinese J. Geophys. (in Chinese), 39(3):356-364. |
| [50] | Zhao J R, Zhang X K, Zhang C K, et al. 2006. Features of deep crustal structure beneath the Wutai mountain area of Shanxi province. Chinese J. Geophys. (in Chinese), 49(1):123-129. |
| [51] | Zhao L, Allen R M, Zheng T, et al. 2012. High-resolution body wave tomography models of the upper mantle beneath eastern China and the adjacent areas. Geochem. Geophys. Geosyst., 13(6):Q06007, doi:10.1029/2012GC004119. |
| [52] | Zheng Y F, Wu F Y. 2009. Growth and reworking of cratonic lithosphere. Chinese Science Bulletin, 54(19):3347-3353, doi:10.1007/s11434-009-0458-y. |
| [53] | Zhou X H. 2006. Major transformation of subcontinental lithosphere beneath eastern China in the Cenozoic-Mesozoic:review and prospect. Earth Science Frontiers (in Chinese), 13(2):50-64. |
| [54] | Zhu G, Song C Z, Niu M L, et al. 2002. Lithospheric textures of the Tan-Lu fault zone and their genetic analysis. Geological Journal of China Universities, 8(3):248-256. |
| [55] | Zhu G, Hu Z Q, Chen Y, et al. 2008. Evolution of early cretaceous extensional basins in the eastern North China craton and its implication for the craton destruction. Geological Bulletin of China (in Chinese), 27(10):1594-1604. |
| [56] | Zhu R X, Zheng T Y. 2009. Destruction geodynamics of the North China Craton and its Paleoproterozoic plate tectonics. Chinese Science Bulletin, 54(19):3354-3366, doi:10.1007/s11434-009-0451-5. |
| [57] | Zhu R X, Chen L, Wu F Y, et al. 2011. Timing, scale and mechanism of the destruction of the North China Craton. Sci. China Earth Sci., 54(6):789-797, doi:10.1007/s11430-011-4203-4. |
| [58] | Zhu R X, Xu Y G, Zhu G, et al. 2012. Destruction of the North China Craton. Sci. China Earth Sci., 55(10):1565-1587, doi:10.1007/s11430-012-4516-y. |
| [59] | 陈凌, 朱日祥, 王涛. 2007. 大陆岩石圈研究进展. 地学前缘, 14(2): 58-75. |
| [60] | 陈凌, 危自根, 程骋. 2010. 从华北克拉通中、西部结构的区域差异性探讨克拉通破坏. 地学前缘, 17(1): 212-228. |
| [61] | 段永红, 张先康, 方盛明等. 2002. 华北地区上部地壳结构的三维有限差分层析成像. 地球物理学报, 45(3): 362-369. |
| [62] | 高山, 章军锋, 许文良等. 2009. 拆沉作用与华北克拉通破坏. 科学通报, 54(14): 1962-1973. |
| [63] | 嘉世旭, 张先康. 2005. 华北不同构造块体地壳结构及其对比研究. 地球物理学报, 48(3): 611-620, doi: 10.3321/j.issn:0001-5733.2005.03.019. |
| [64] | 嘉世旭, 张成科, 赵金仁等. 2009. 华北东北部裂陷盆地与燕山隆起地壳结构. 地球物理学报, 52(1): 99-110. |
| [65] | 李松林, 张先康, 宋占隆等. 2001. 多条人工地震测深剖面资料联合反演首都圈三维地壳结构. 地球物理学报, 44(3): 360-368, doi: 10.3321/j.issn:0001-5733.2001.03.008. |
| [66] | 李飞, 徐涛, 武振波等. 2013. 三维非均匀地质模型中的逐段迭代射线追踪. 地球物理学报, 56(10): 3514-3522, doi: 10.6038/cjg20131026. |
| [67] | 李松林, 赖晓玲, 刘宝峰等. 2011. 由诸城—宜川人工地震剖面反演结果看太行山两侧岩石圈结构的差异. 中国科学: 地球科学, 41(5): 668-677. |
| [68] | 刘志, 张先康, 王夫运等. 2005. 用地震走时反演计算长白山天池火山区二维地壳泊松比. 地震学报, 27(3): 324-331. |
| [69] | 刘志, 张先康, 潘纪顺等. 2009. 阿尼玛卿缝合带及两侧上地壳泊松比分布. 地球物理学进展, 24(5): 1627-1635, doi: 10.3969/j.issn.1004-2903.2009.05.011. |
| [70] | 滕吉文, 王光杰, 张中杰等. 2000. 华南大陆S波三维速度结构与郯庐断裂带的南延. 科学通报, 45(23): 2492-2498. |
| [71] | 王椿镛, 张先康, 吴庆举等. 1994. 华北盆地滑脱构造的地震学证据. 地球物理学报, 37(5): 613-620. |
| [72] | 王夫运, 张先康, 陈颙等. 2004. 张渤构造带中东段二维P波速度结构——安新—香河—宽城剖面. 地震学报, 26(7): 31-41. |
| [73] | 徐涛, 徐果明, 高尔根等. 2004. 三维复杂介质的块状建模和试射射线追踪. 地球物理学报, 47(6): 1118-1126. |
| [74] | 胥颐, 刘建华, 郝天珧等. 2006. 中国东部海域及邻区岩石层地幔的P波速度结构与构造分析. 地球物理学报, 49(4): 1053-1061. |
| [75] | 徐义刚, 李洪颜, 庞崇进等. 2009. 论华北克拉通破坏的时限. 科学通报, 54(14): 1974-1989. |
| [76] | 许志琴, 张国伟. 2013. 中国(东亚)大陆构造与动力学——科学与技术前沿论坛“中国(东亚)大陆构造与动力学”专题进展. 中国科学: 地球科学, 43(10): 1527-1538. |
| [77] | 张成科, 张先康, 赵金仁等. 2002. 渤海湾及其邻区壳幔速度结构研究与综述. 地震学报, 24(4): 428-435. |
| [78] | 张先康, 王椿镛, 刘国栋等. 1996. 延庆—怀来地区地壳细结构——利用深地震反射剖面. 地球物理学报, 39(3): 356-364. |
| [79] | 赵金仁, 张先康, 张成科等. 2006. 山西五台山地区地壳深部结构特征研究. 地球物理学报, 49(1): 123-129. |
| [80] | 郑永飞, 吴福元. 2009. 克拉通岩石圈的生长和再造. 科学通报, 54(14): 1945-1949. |
| [81] | 周新华. 2006. 中国东部中、新生代岩石圈转型与减薄研究若干问题. 地学前缘, 13(2): 50-64. |
| [82] | 朱光, 宋传中, 牛漫兰等. 2002. 郯庐断裂带的岩石圈结构及其成因分析. 高校地质学报, 8(3): 248-256. |
| [83] | 朱光, 胡召齐, 陈印等. 2008. 华北克拉通东部早白垩世伸展盆地的发育过程及其对克拉通破坏的指示. 地质通报, 27(10): 1594-1604. |
| [84] | 朱日祥, 郑天愉. 2009. 华北克拉通破坏机制与古元古代板块构造体系. 科学通报, 54(14): 1950-1961. |
| [85] | 朱日祥, 陈凌, 吴福元等. 2011. 华北克拉通破坏的时间、范围与机制. 中国科学: 地球科学, 41(5): 583-592. |
| [86] | 朱日祥, 徐义刚, 朱光等. 2012. 华北克拉通破坏. 中国科学: 地球科学, 42(8): 1135-1159. |
 2015, Vol. 58


