The detection probability can significantly decreased with increasing depth, the magnitude completeness MP are ML0.8, ML1.0 and ML1.4 at depths of 7.5 km, 15.0 km and 25 km respectively in the study area. From the snapshot of probabilistic magnitude of completeness at 2014-01-01, a total of 7 poorly running stations are identified, which could reduce the detection capability about 0.2 magnitude units compared to the whole seismic array, and even could reach 0.9 magnitude units around some stations. Comparing to the other two traditional methods, The completeness magnitude from PMC method is larger about 0.5/0.6 magnitude units than the other two traditional methods. The PMC method are expected to be an accurate and reliable assessments method to access the event detection capability of a small-aperture seismic array with high density for avoiding the prior assumptions and providing a detailed description of detection probabilities over space, time, and magnitude. The Xichang seismic array shows very high event detectability. By using the PMC method, we can distinguish the effect of human factors in data processing and identify the poorly running stations nearly real-time. Furthermore, we also find the MAXC and EMR method may overestimate the detection capability comparing to the PMC method under the same assessment conditions.
为实现特定科学目标而布设的高密度、专用地震台网成为近年来地震观测研究的热点,例如“日本-德国地下声发射研究”计划(JAGUARS)在南非Mponeng金矿地下3.5 km深处布设的高频地震信号记录台网(Nakatani et al., 2008),布设在美国圣安德烈斯断层带上的井下“高精度地震台网”(HRSN,Hickman et al., 2004),以及在加拿大不列颠哥伦比亚省东北部布设的用于观测“长周期长衰减”(LFLD)事件的微震监测台网(Eaton et al., 2013)等.对这些有特定监测要求的专用台网进行定量化、科学的地震检测能力评估就成为基础而又关键的研究内容.实际上,即使是对于常规区域地震台网和临时流动地震台网,在开展包括地震危险性分析、余震监测、速度结构基础探查等研究时,同样需要科学的地震检测能力评估(Gomberg et al., 2001; Stein,1999; Knopoff,2000; Main,2000; Wiemer and Wyss, 2002; Enescu and Ito, 2002).
现有的地震检测能力评估方法一般可分为两类,一类是假定震级-频度的分布满足G-R关系(Gutenberg and Richter, 1944)的统计地震学方法,并认为对G-R关系的线性拟合较好的震级档是完整的,例如“最大曲率”(MAXC)方法、拟合度分别为90%和95%的GFT方法(Wiemer and Wyss, 2000)、“完整性震级范围”(EMR)方法(Woessner and Wiemer, 2005)等;另一类则基于震级衰减关系和噪声水平给出理论监测能力(Sereno Jr and Bratt, 1989)、振幅阈值(Gomberg,1991),以及地震记录昼夜信噪比(Rydelek ans Sacks,1989)等方法.第一类方法多基于研究时段内全部地震给出的平均结果,无法开展实时评估;第二类基于理论评价的方法则与实际的地震检测能力差距较大,也无法同时满足实时、对特定深度和无地震发生与弱活动区域的地震检测能力评价.
近年来新发展的“基于概率的完整性震级”(Probability-based Magnitude of Completeness,PMC)方法(Schorlemmer and Woessner, 2008; Schorlemmer et al., 2010)为此类高密度、专用地震台网的地震检测能力评估提供了可能.由于PMC方法具有不需要假定震级的分布关系、可利用台阵/台网实际产出资料客观评估,以及考虑了未发生地震或弱地震活动地区的地震检测能力等优点,近年来得到了广泛关注.目前PMC方法已在美国南加州地震台网(Schorlemmer and Woessner, 2008)、瑞士(Nanjo et al., 2010)和意大利(Schorlemmer et al., 2010; Gentili et al., 2011)等地区,以及国内的内蒙古区域地震台网(刘芳等,2014)和首都圈地震台网(李智超等,2014)等开展了应用研究.PMC方法目前尚在进一步发展中,Nanjo等(2010)将PMC方法改进并用于台网优化布局,Plenkers等(2011)和Maghsoudi等(2013)改进了PMC方法以考虑地震检测能力的方向性差异的识别.
2012年,中国地震局地球物理研究所在安宁河断裂带的泸定—冕宁—西昌等地布设了高密度、宽频带流动地震台阵(以下简称“西昌流动地震台阵”),并开展面向断裂带深度地震活动行为监测研究.为实现对台阵的实时、不同深度的地震检测能力评估,本文尝试使用PMC方法,并以西昌流动地震台阵为例开展相关工作.除实现上述评估目标外,还将对方法应用中的问题进行讨论,以期对类似台阵/台网的地震检测能力的科学评估提供参考. 2 PMC方法原理简介
在Schorlemmer和Woessner(2008)发展的PMC方法中,使用了台阵/台网实际产出的地震目录中各地震事件的发震时刻、震中位置、震级,地震观测报告中每个台站的震中距、PG/SG到时、单台测定震级等震相,以及各台站坐标和测定震级的衰减关系等信息.计算上主要有两个步骤:
第一步为“单台分析”,即利用实际观测资料的震级M和震源距L给出单台检测概率PD(M,L).首先需将相对于考察点(M,L)的“距离”为ΔM和ΔL的单位统一至震级-震级坐标系中.对于同一台站上测定的振幅相同的两个地震事件,根据震级测定的经验衰减关系有


当符合条件的事件数Nt≥10时,可根据被台站检测到的事件数目N+和未被检测到的数目N-计算台站的检测概率:

由上式可见,PD被表示为在(M,L)空间中的概率分布,且概率值由N+占全部事件的比例得出,由此,二维空间中的PD可展示出更为客观、信息量更大的各台站地震检测概率实际情况.
第二步为“理论计算”,将各单台检测概率PE(M,L)综合,并外推至空间上的某一震级水平相对应的联合检测概率PE(M,x,t),以及基于概率的最小完整性震级MP(x,t)的空间分布.在要求至少4个台站可记录到同一地震的情况下,对给定的震级M、在位置x处、t时刻的检测概率PE(M,x,t)为考虑排除掉仅被0、1、2和3个台站记录的联合概率:


 种组合下,s个台站检测概率(其中i个记录到x处地震的台站检测概率为PD,而其余未记录到地震的概率为1-PD)的乘积、求和.由此,对于所有需要考虑的震级档,在位置x处、t时刻的最小完整性震级MP可由下式获得:
西昌流动地震台阵布设在安宁河断裂带附近地区(101.5°E—102.8°E,27.5°N—29.8°N),包括泸定、石棉、冕宁、西昌和德昌等地在内,整体布局呈南北向分布.研究区所在的安宁河断裂带作为川滇活动块体巨型左旋走滑东边界的一部分,晚更新世以来平均左旋走滑速率为3~7 mm·a-1,东西向由于逆冲断层运动造成的挤压缩短速率约为1.7~4.0 mm·a-1(何宏林等,2007),断裂带上地震活动强烈,有历史记录以来曾先后发生1480年石棉—冕宁71/2级地震(闻学泽等,2000)、1489年西昌、越西一带63/4级地震、1536年西昌北71/2级地震、1732年西昌东南63/4级地震、1850年西昌—普格71/2级地 震,以及1952年冕宁、石龙一带63/4级地震等强烈地震.
西昌流动地震台阵由30个宽频带地震台站组成,平均台间距约16 km,受仪器故障影响,实际用于安宁河断裂带微震监测的台站数量为28个.各台站的位置和截至2014-05-14记录的地震事件的空间分布如图 1所示.由图可见,石棉和昭觉地区有大量的、震源深度相对较深的地震事件,其中石棉地区 的地震事件多集中分布在20~30 km深度,水平方向上则沿NNW-SSE向的大凉山断裂带分布,其构造和地球动力学含义还有待深入研究.台阵在空间上沿南北向展布约220 km,东西向近100 km,仪器采用Guralp CMG-3T型地震计和Reftek 130S型数据采集器,地震计多架设在基岩上.台阵于2012年底建成、2013年1月13日正式运行产出数据,地震编目工作由四川省地震局西昌中心台协助开展,延迟7天准实时提供地震目录和地震观测报告.上述台站中,位于西昌市黄水乡的XC31台在2013年11月进行了位置调整,调整后的台站重新命名为XC33.图 2给出了西昌流动地震台阵截至2014-01-20的台站运行率,由图中红色标出的台站断记时段可见,在28个台站中,仅XC29台站出现超过1个月的较长的断记,运行率为89.59%,其他台站的运行率均在97%以上.图中,XC06、XC13、XC21和XC24台站受通讯条件变化等影响,部分时段不能正常获取实时数据.需要指出的是,数据的实时传输对微震活动监测有重要的现实意义,研究中将此类情况也作为数据断记处理,但由于流动地震台阵同时采用人工巡台获取数据的方式,数据的实时传输问题对开展其他基础研究影响不大.
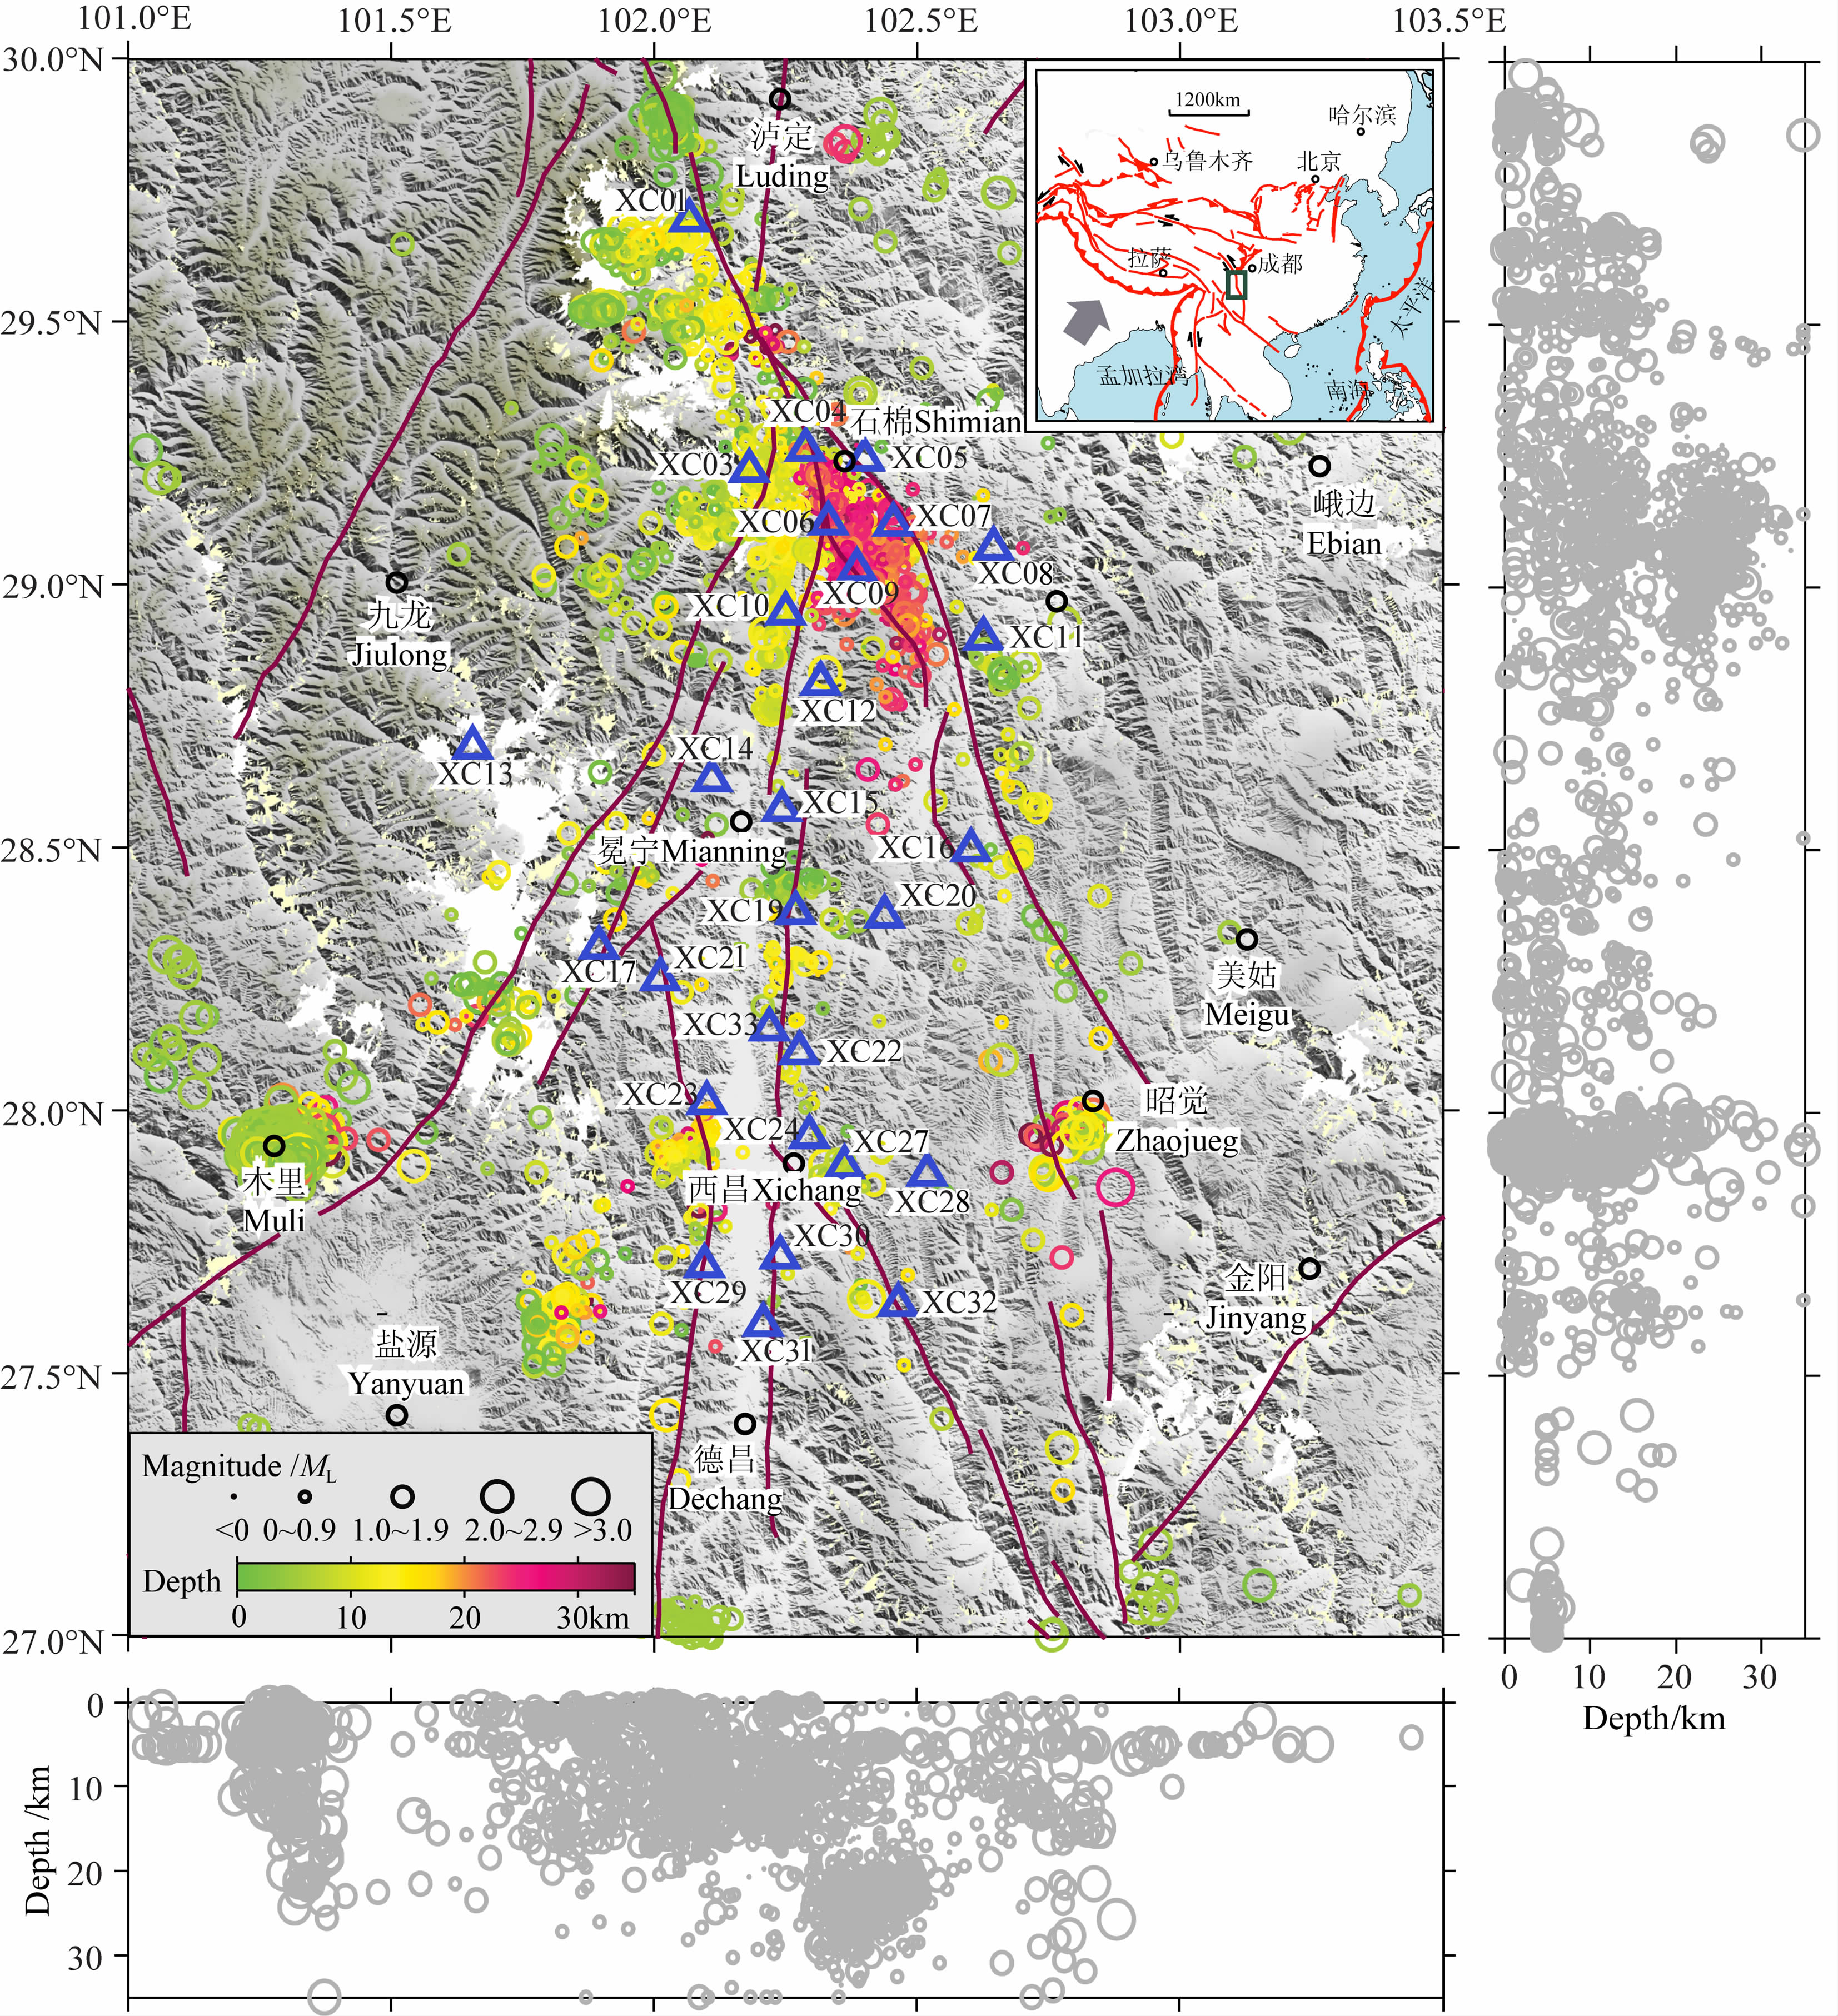 |
图 1 西昌流动地震台阵分布图 图中圆圈和圆点为台阵自2013-01-13至2014-05-14记录的地震事件,右上角子图中绿色矩形框为研究区范围示意图,底图红色曲线为活动断裂带,资料来自邓起东等(2003).右侧和底部子图为台阵记录的地震分别在纬度-深度和经度-深度的投影.Fig. 1 Seismic stations of the Xichang seismic array The circles and dots show the recorded events from 2013-01-13 to 2014-05-14,the red solid lines represent active faults(Deng et al., 2003). The green box in the inset(upper-right)indicates the target region. The right and bottom subplots show the focal depth along the latitude and longitude direction respectively |
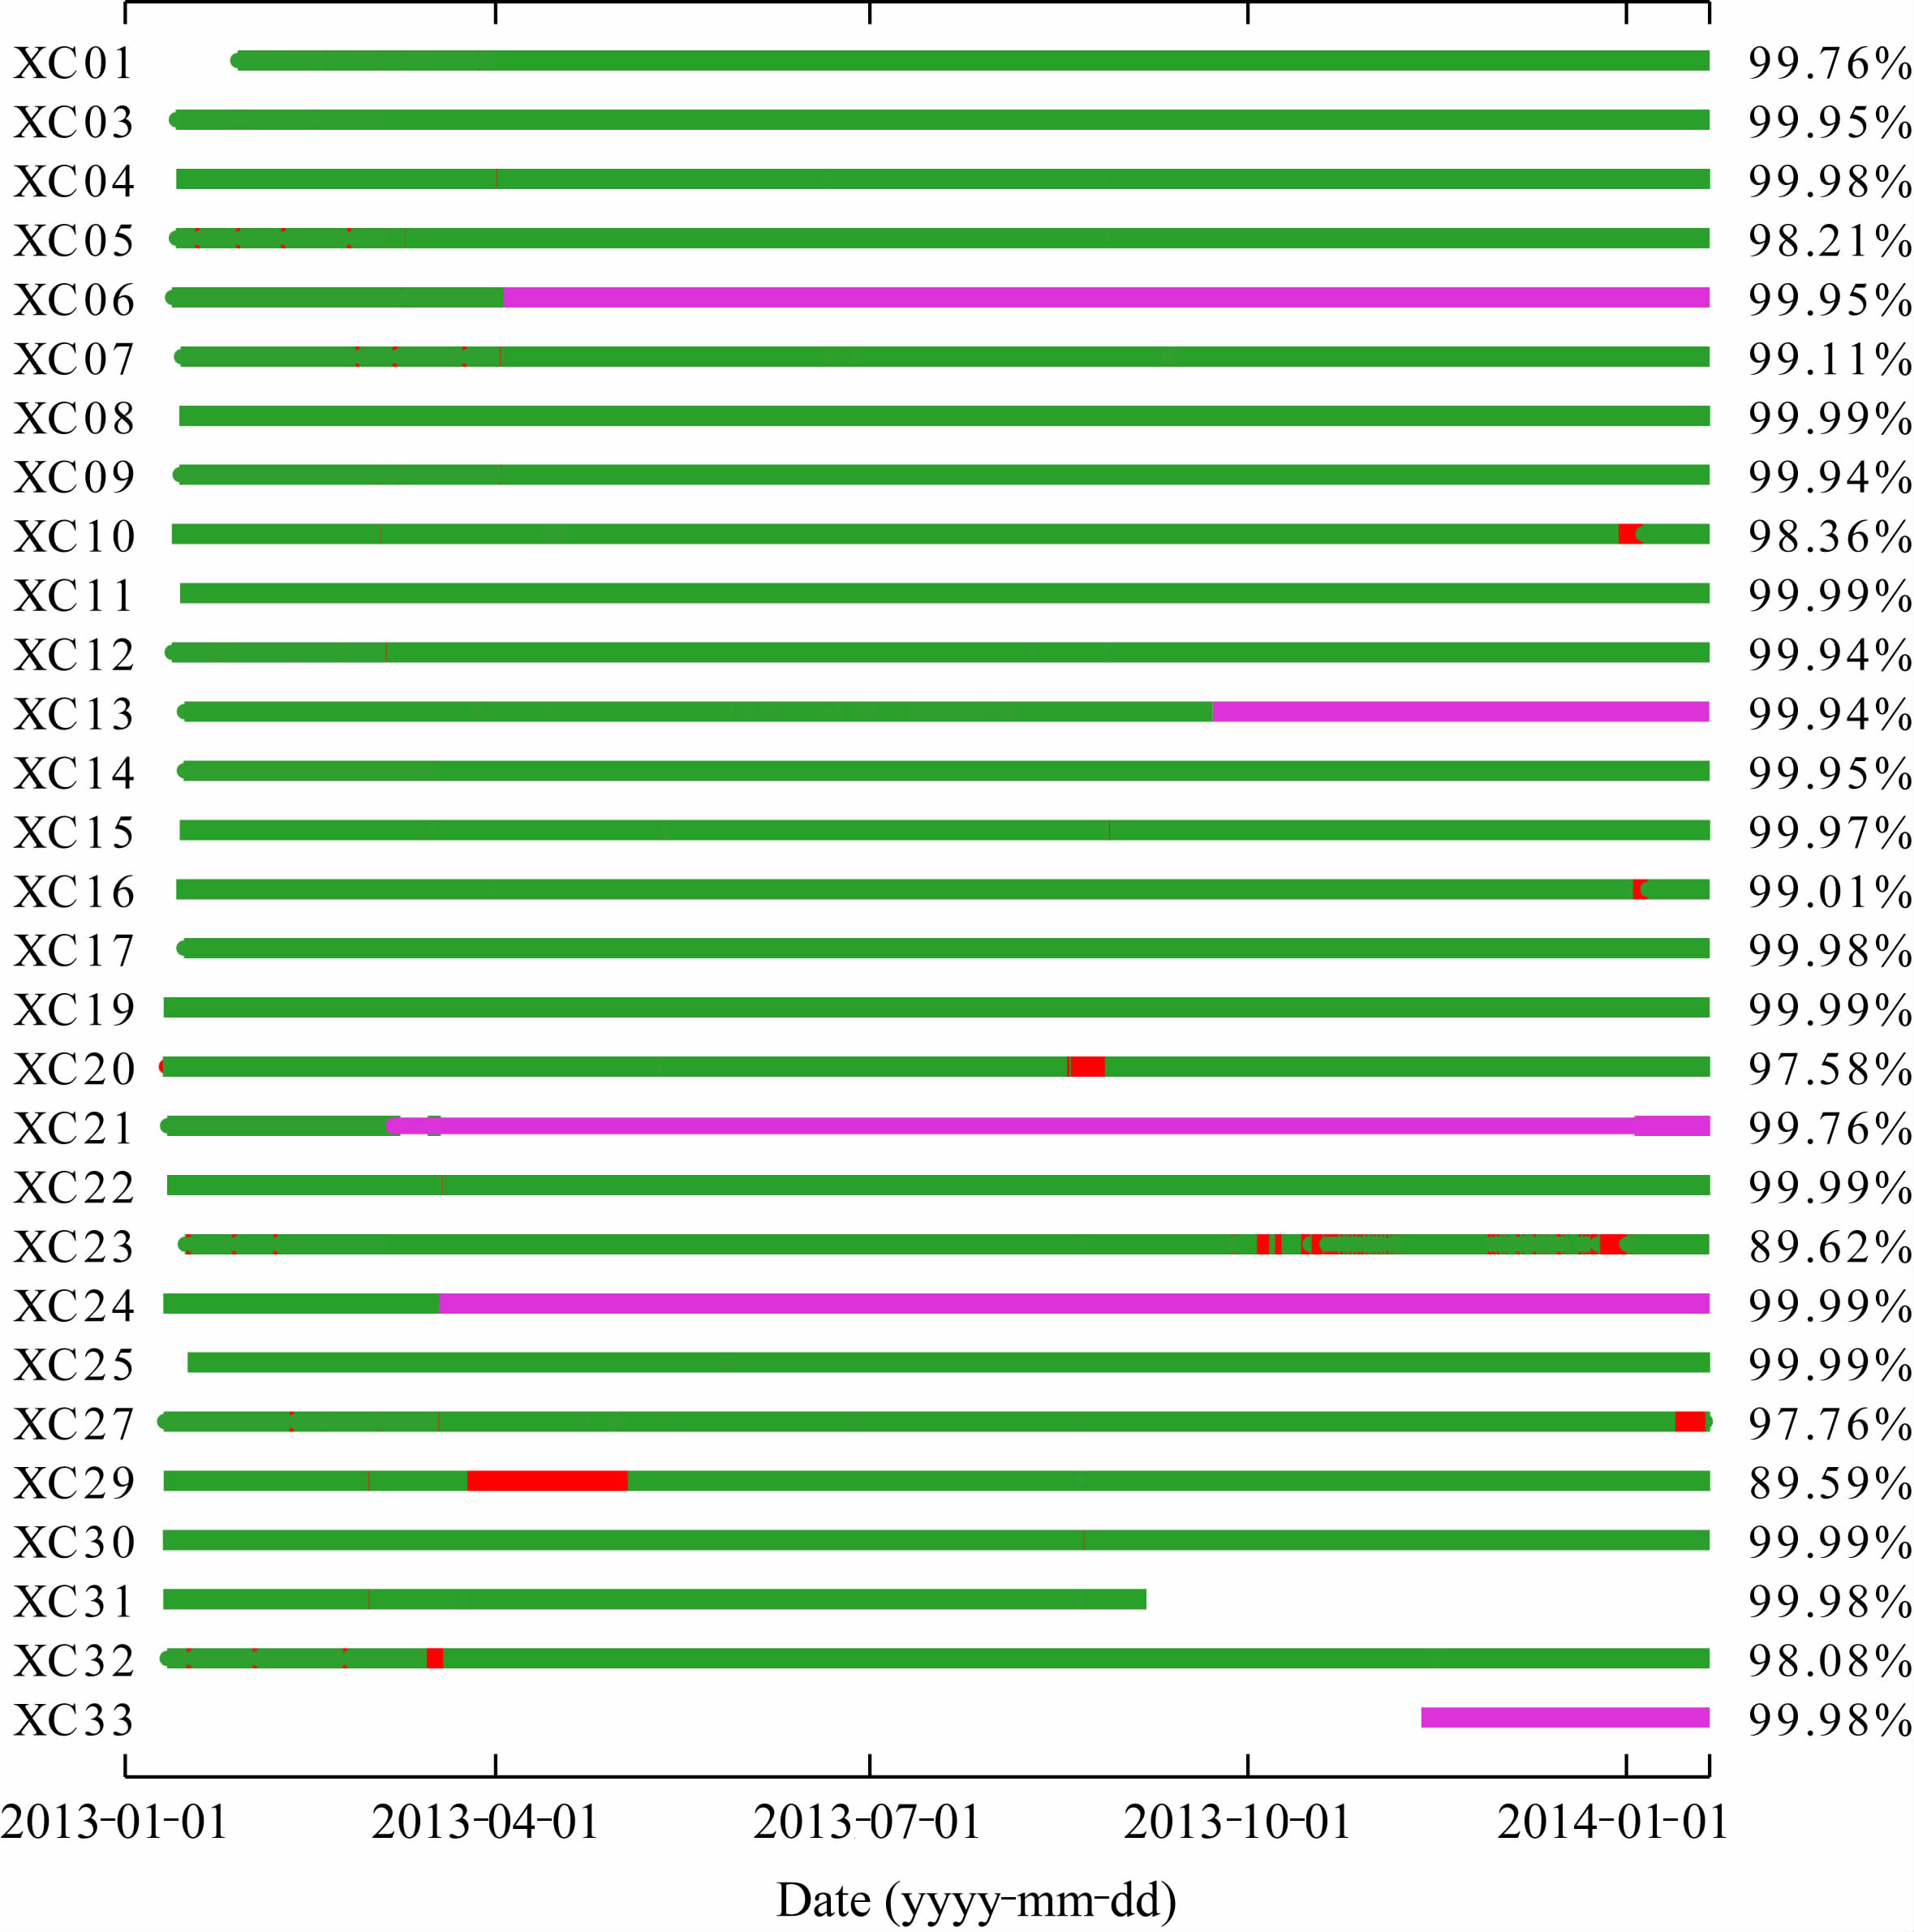 |
图 2 西昌流动地震台阵各台站自2013-01-01至2014-01-20的运行率图 图中红色段落为台站断记等非正常运行状态,紫色线段为台站正常运行但未实时传输的时段.图中右侧数字标出了各台站运行率的百分比.Fig. 2 On-off times of the Xichang seismic array from 2013-01-01 to 2014-01-31 The red segments show the periods when out of work,the purple segments indicate the stages with normal operation but data transmission broken. The operation rates of each station marked by the percentage in the right side. |
在PMC方法计算分析中,使用了2013-01-13—2014-05-14期间西昌流动地震台阵记录的全部地震 事件,共计2434个,其中最小地震事件震级为ML0.5. 使用的地震观测报告共含震相31320条,均为PG或SG震相.关于震级测定的衰减关系,台阵定位中使用了我国区域地震台网的地方震震级(ML)的测定标准(中国地震局监测预报司,2001):

单台检测概率PD(M,L)是PMC方法计算的基础,作为示例,图 3给出了西昌流动地震台阵中的XC04、XC11和XC29台站的结果.由图可见,XC04台站在低震级和小震中距范围内有较高的检测概率(PD>0.8),XC29台站其次,XC11台站相对较差. 对于XC04台站,当震级M在ML0.0~2.0、震源距 L在0~150 km时,PD高值范围随着M和L的增加而增加,符合一般认识上的台阵对地震检测能力的变化.当震级M>2.0时,PD高值范围不再随着L的增加而变化,可能是由于在地震定位和编目时,人工操作限制了L>150 km的观测资料的使用,由此造成PD快速下降.对于XC29台站,PD随着M和L的变化受人工操作的影响则更为明显,其中在ML0.2~2.0范围内,地震事件的识别限定在L=0~40 km的资料的使用,而对ML2.0以上地震,则使用了150 km的资料.对于检测能力相对较低的XC11台站,仅对L<60 km范围的ML0.2~4.0地震进行了识别.由以上3个台站检测概率的分析可见,PD一方面可考察因台站布局引起的检测能力的差异,另一方面也可反应在地震识别中人工操作对检测能力的影响.受篇幅所限,本文未展示其他台站的PD结果,但这些结果在后续的分析中作为基础数据得到了应用.PMC方法可用两种形式表示地震检测能力,即某一震级档相对应的在空间上的检测概率PE,以及基于概率的完整性震级MP的空间分布.由于在检测能力估算中,震源深度H参与了震源距的计算,因此可对不同震源深度的检测能力进行分析.
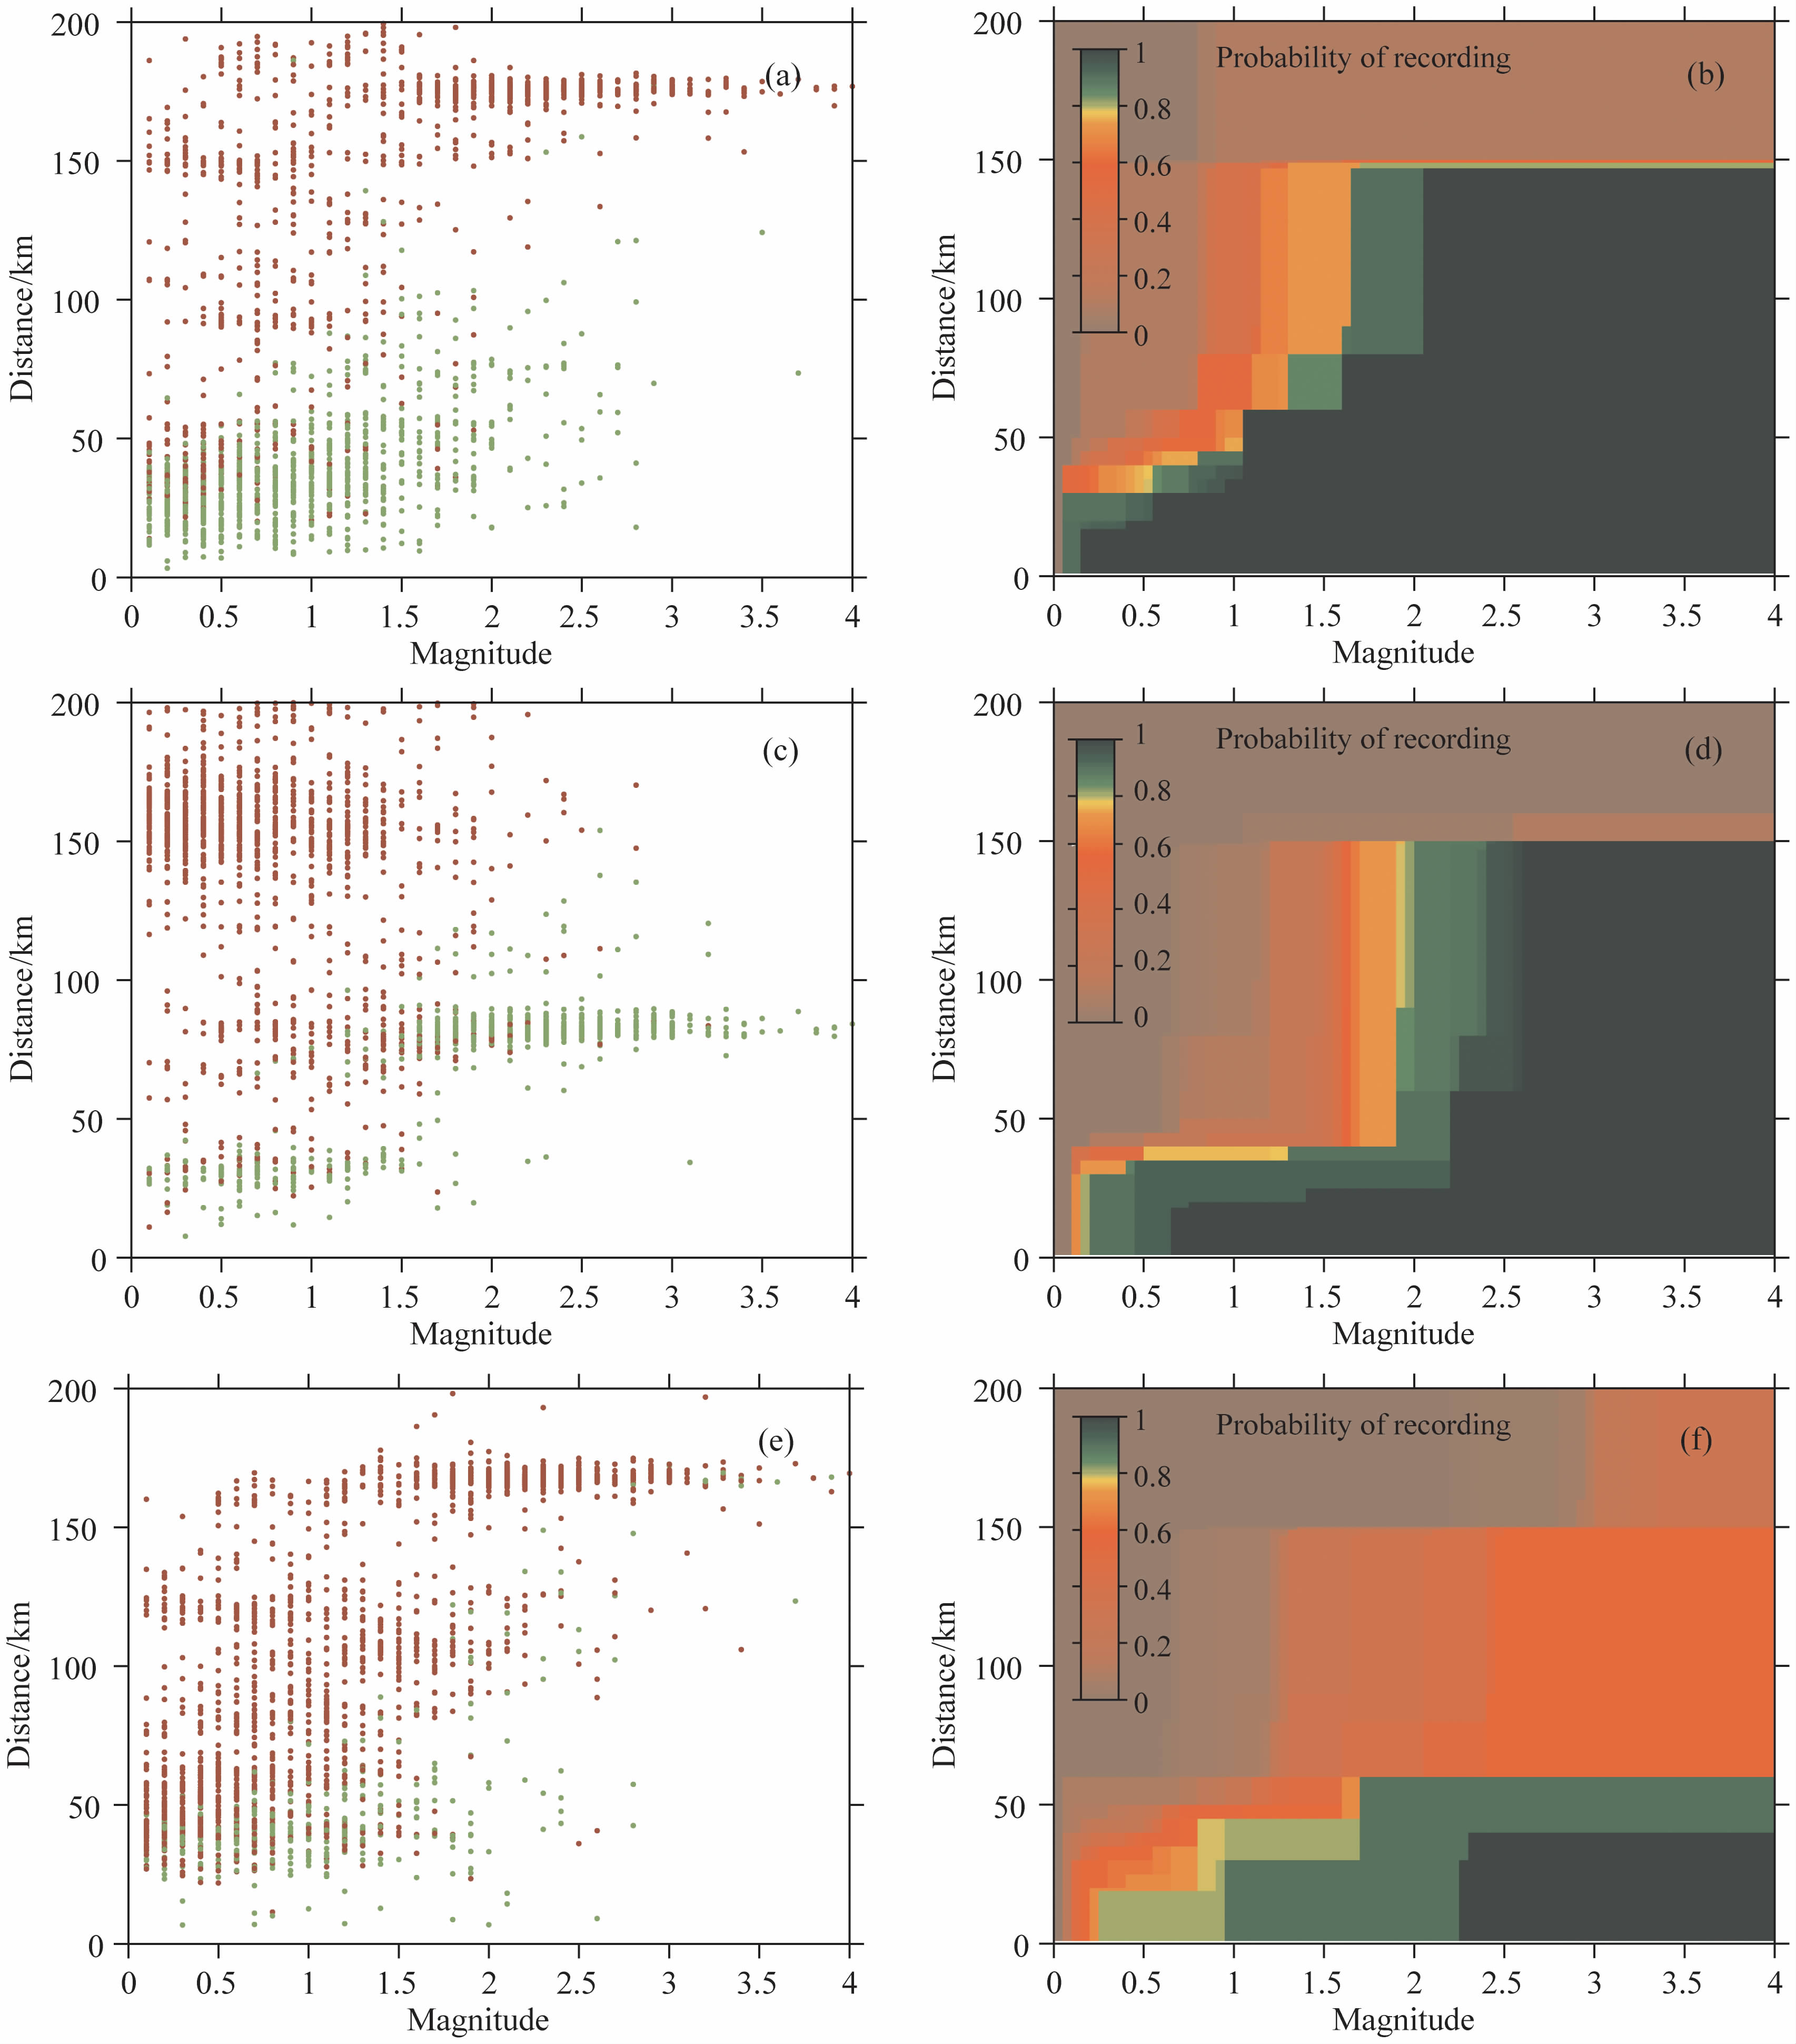 |
图 3 西昌流动地震台阵单台检测概率 (a)、(c)和(e)为震级-距离图的原始点阵,图中红色圆点为台站周围发生的未被台站记录的地震,绿色圆点为实际记录到的地震;(b)、(d)、(f)为PMC方法给出的单台检测概率,图中颜色值表示相应震级和震源距离下的检测概率值.(a)和(b)为XC04台结果, (c)和(d)为XC29台结果,(e)和(f)为XC11台结果. Fig. 3 Detection probabilities for station in the Xichang array (a),(c) and (e)show the picked(green) and not picked(red)events in the magnitude-distance space.(b),(d) and (f)show the detection probabilities by PMC method,the colors indicated the detection probability in the special magnitude and hypocentral distance.(a) and (b)according to the results of the station CX04,(c) and (d)show the results of the station XC29, and (e) and (f)show the results of the station XC11. |
图 4—图 6分别给出了H=7.5 km、15.0 km和25.0 km情况下的PE与MP的空间分布,其中PE分别展示了M=ML0.6、ML0.8和ML1.0的情况.由H=7.5 km的结果可见,图 4a对应的ML0.6震级水平下的检测概率高值PE |M=0.6(以下简写为P0.6,其他表述类似)高于0.99的范围主要分布在石棉—冕宁以及西昌附近地区,两区域的台站密度、运行率和数据实时传输的正常时段比例均较高.随着远离台阵的密集分布区域,P0.6的数值下降明显,至图中研究区边缘,P0.6≈0,表明对ML0.6震级的地震事件已无检测能力.图 4b和图 4c分别对应的 ML0.8和ML1.0震级水平下 的检测概率,其中P0.8>0.99和P1.0>0.99的空间分布范围相比P0.6>0.99明显扩大.图 4d给出了MP的空间分布,在图中石棉、冕宁以及西昌以南、以北两处台站覆盖较好地区的MP较小,约为ML0.5~0.7.对除台站XC01以外的“网内”地区,MP=ML0.8可描述相应的地震检测能力.由图 5给出的深度H=15.0 km的地震 检测能力分布可见,P1.0>0.99的空间分布范围与除台站XC01以外的“网内”地区接近,对应的MP=ML1.0;当H=25.0 km时,P1.0>0.99的空间分布范围已无法覆盖“网内”地区,此时MP约为ML1.4.相比图 4结果,图 5和图 6在“网内”地区的不均匀性显著增加,数据实时传输非正常时段较长的XC21、XC24和XC33等台站也造成同等震级水平的PM分布范围缩小和MP的明显升高.
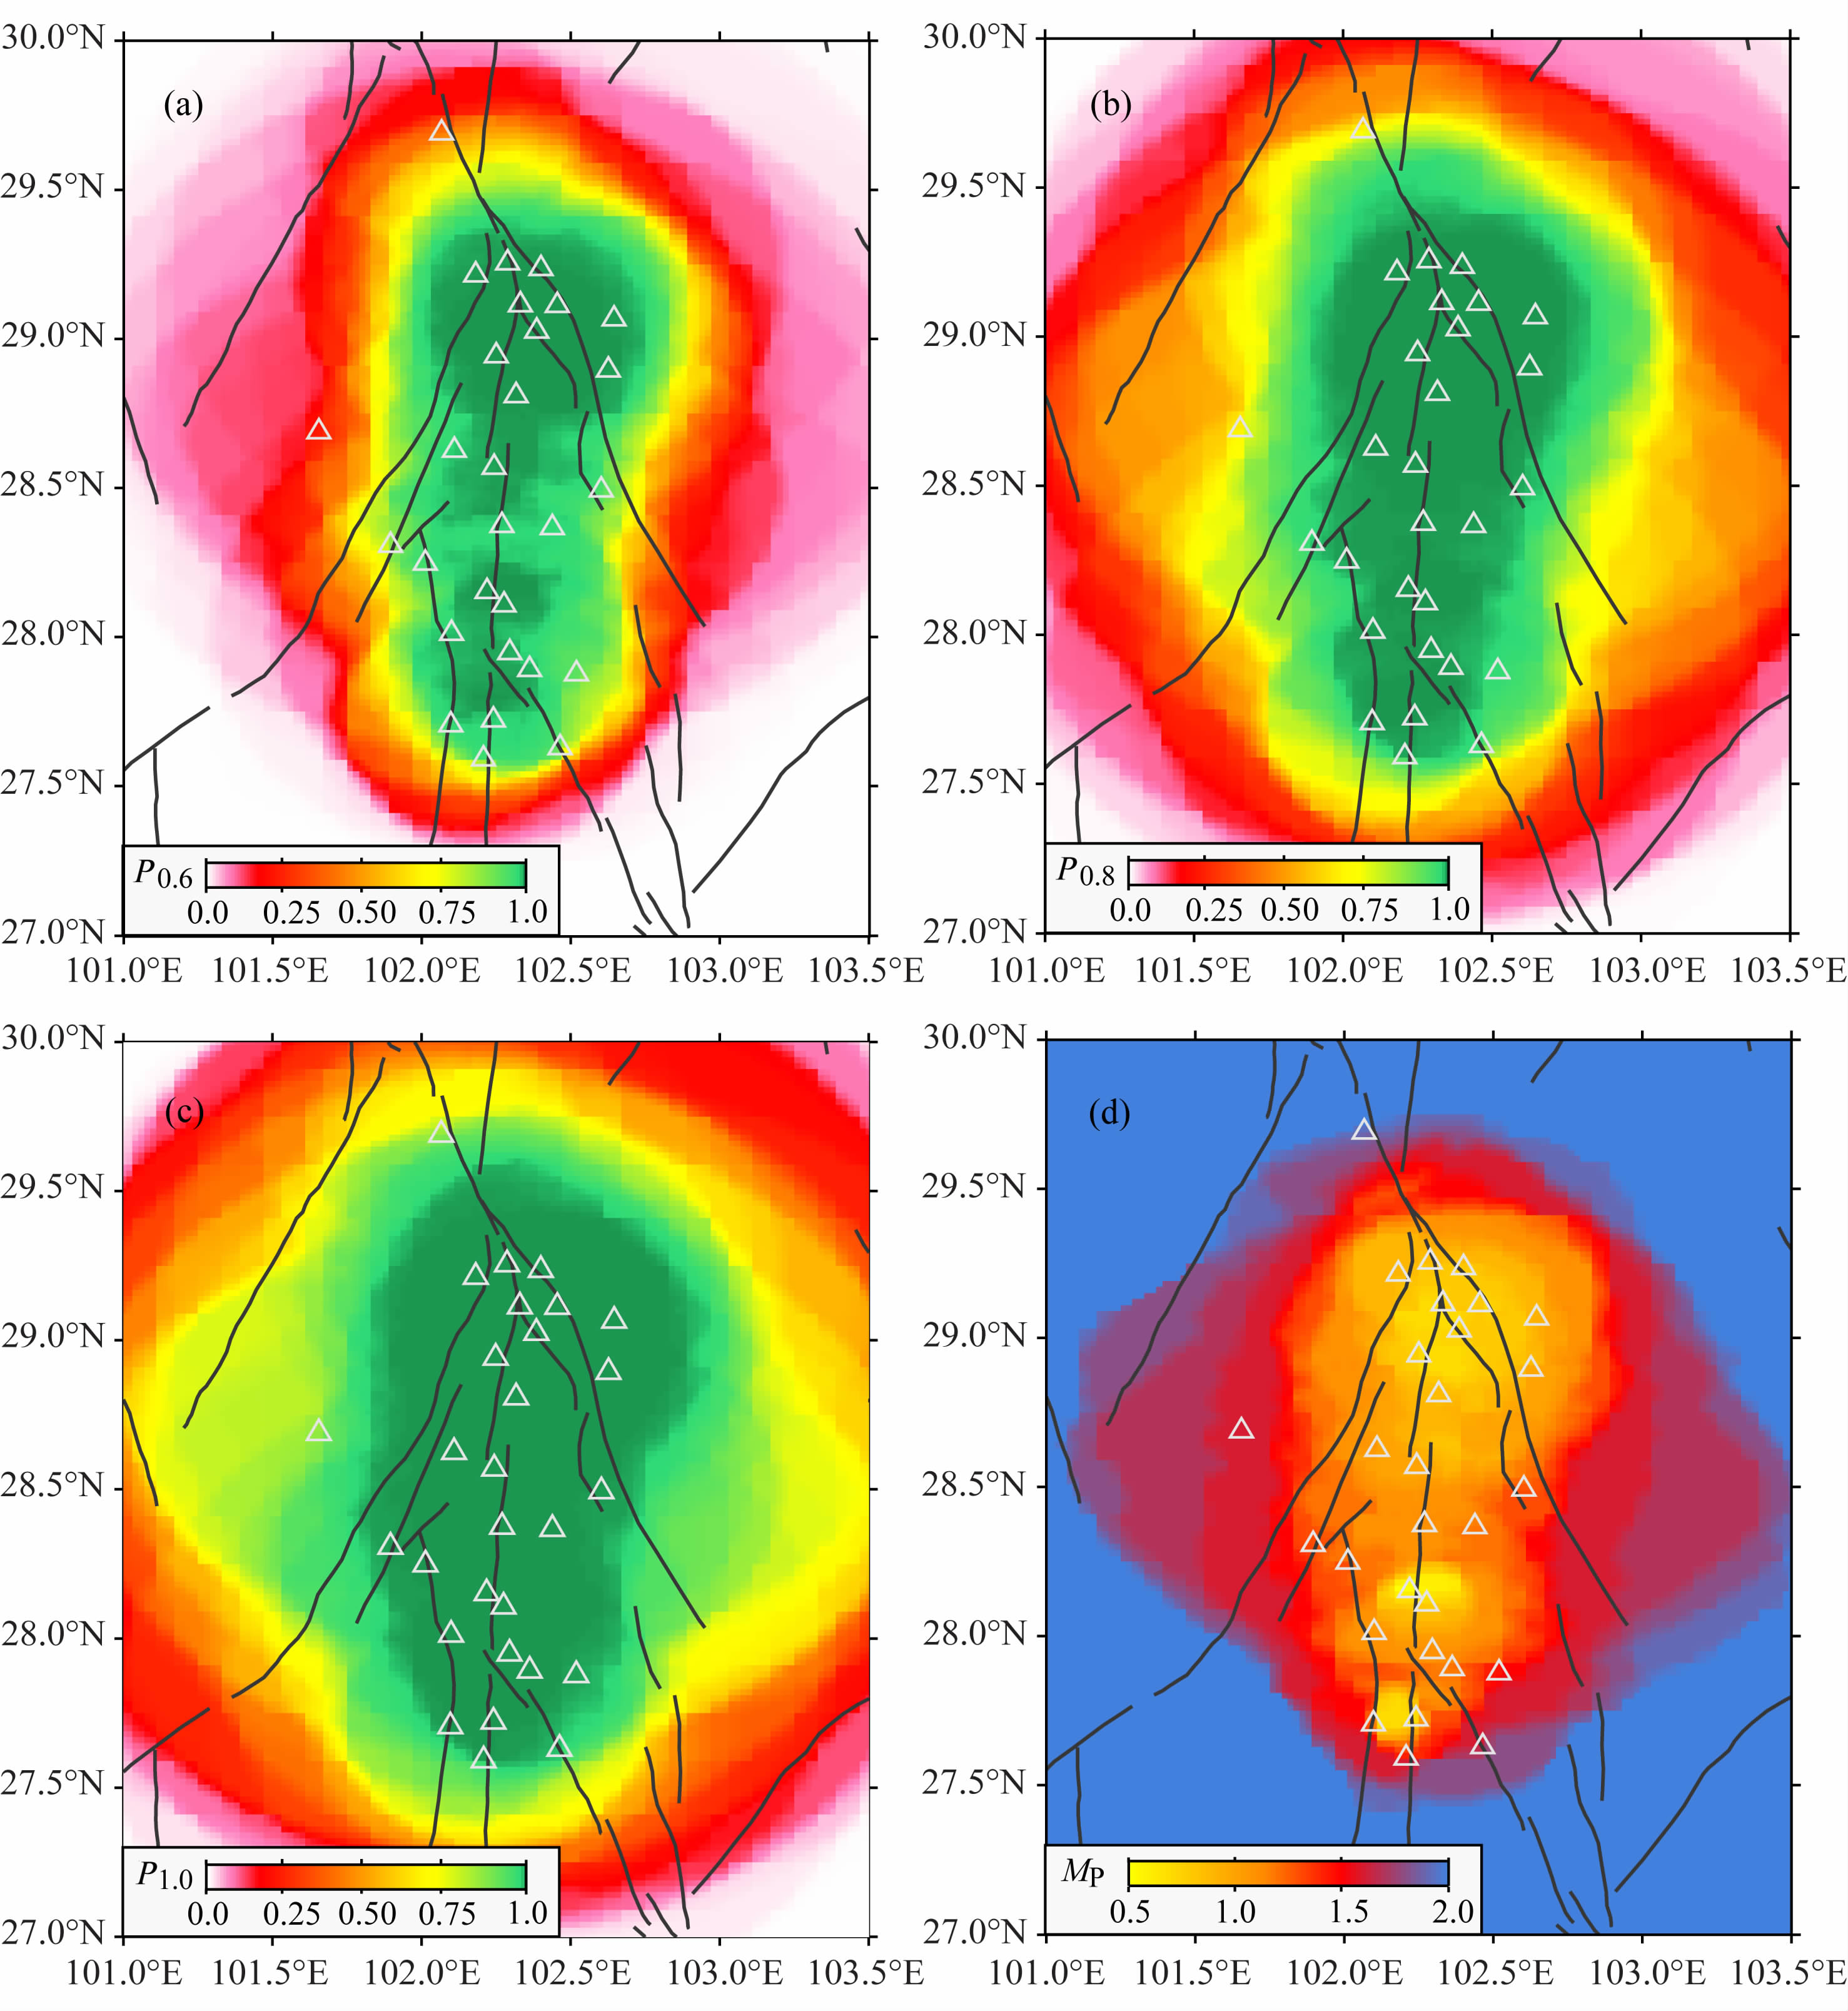 |
图 4 深度7.5 km对应的检测概率和最小完整性震级MP的空间分布 (a)M0.6地震的检测概率空间分布;(b)M0.8地震的检测概率空间分布;(c)M1.0地震检测概率空间分布;(d)最小完整性震级MP的空间分布.图中白色空心三角形为西昌流动地震台阵全部地震台站.Fig. 4 Maps of detection probabilities and minimum magnitude of completeness MP at a depth 7.5 km (a)Map of P0.6 with detected magnitude level ML0.6;(b)Map of P0.8 with detected magnitude level ML0.8; (c)Map of P1.0 with detected magnitude level ML1.0. The white triangles are seismic stations of the Xichang array. |
 |
图 5 深度15.0 km对应的检测概率和最小完整性震级MP的空间分布.图注与图 4相同Fig. 5 Maps of detection probabilities and minimum magnitude of completeness MP at a depth 15.0 km. See Fig. 1 for more details |
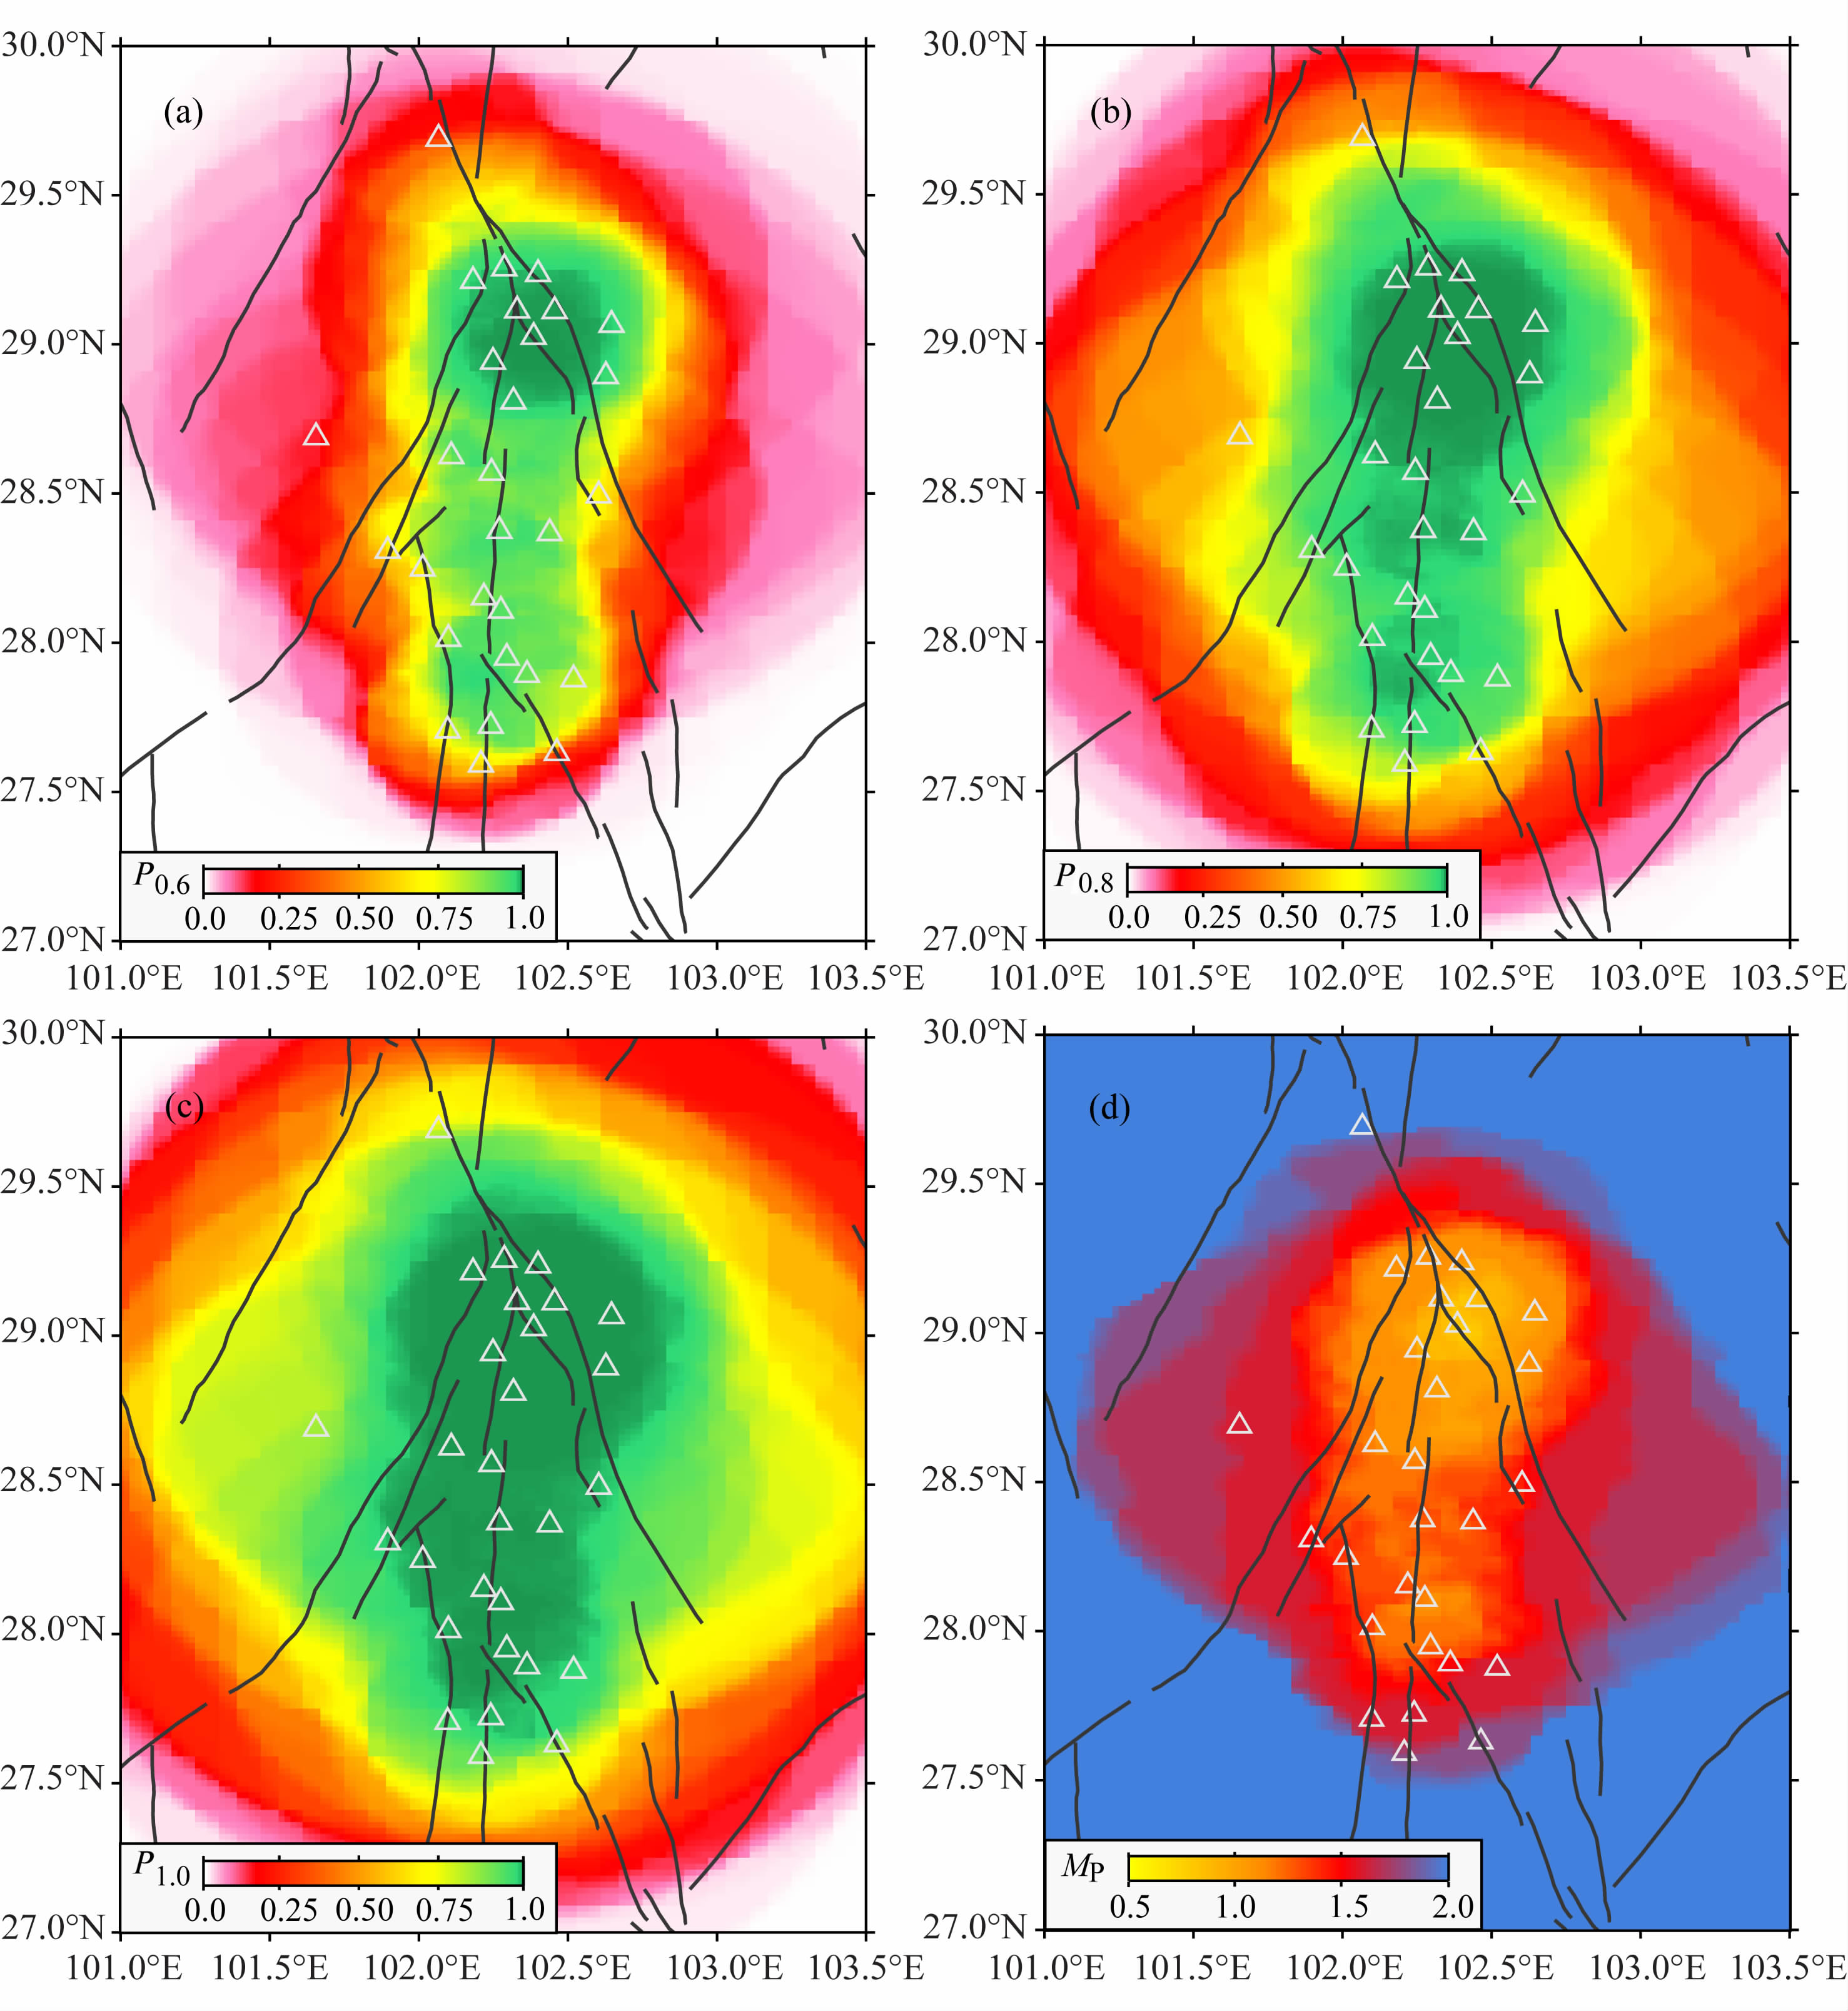 |
图 6 深度25.0 km对应的检测概率和最小完整性震级MP的空间分布.图注与图 4相同Fig. 6 Maps of detection probabilities and minimum magnitude of completeness MP at a depth 25.0 km. See Fig. 6 for more details |
除图 4—图 6给出的研究时段内平均的地震检测能力外,在对强震发生后的余震监测以及震情重点监视地区微震监测等情况下,实时或准实时地识别地震检测能力的动态变化尤为重要.由于部分台站的仪器运行和数据通讯故障等因素影响,可能出现地震检测能力的瞬时显著变化.利用截至考察时刻之前的单台检测概率PD,以及当前正常运行的台站信息,即可通过PMC方法获得实时的地震检测能力,从而实现对地震台网/台阵监测能力的实时监控.
作为示例,对西昌流动地震台阵设定2014-01-14作为实时地震检测能力的考察时刻.图 7a和图 7b分别给出了H=7.5 km情况下的MP以及与图 4d的研究时段平均结果差异ΔMP的空间分布.由图可见,由于此时刻处于非正常状态的台站较多,包括XC06、XC13、XC21、XC23、XC24、XC31和XC33共7个台站,一方面造成XC21、XC33、XC24和XC31台站周边地区地震检测能力的显著下降(ΔMP>0),另一方面造成研究区地震检测能力整体下降约0.2个震级单位.而对于XC06台站,由于周边台站分布密集,且均正常运行,由此造成的地震检测能力下降则不明显.
 |
图 7 西昌流动地震台阵2014-01-14的实时检测能力MP(a)和相对平均检测能力变化ΔMP的分布(b)
图中MP和用于比较的平均结果均对应7.5 km深度,平均结果为图 4d.图(a)中白色三角形为2014-01-14正常运行的台站,图(b)中黑色三角标出了非正常运行的台站.Fig. 7 Maps of the real-time detection probabilities in operation on 2014-01-14(a) and the ΔMP(b)relative to Fig. 4d at a depth 7.5 km The white triangles shows the normal operation stations on 2014-01-14, and the black triangles indicate the out of work ones. |
由上述分析可见,PMC方法可实现对台阵/台网地震检测能力的实时评估,西昌流动地震台阵部分台站的非正常运行或数据非正常实时获取,可对研究区微震监测造成较大影响,且相关影响具有一定复杂性. 6 讨论
为比较不同方法对地震检测能力评估的差异,这里使用了MAXC和EMR方法分别计算西昌流动地震台阵的最小完整性震级Mc,并与PMC方法在H=7.5 km时的整个研究时段平均结果的MP进行对比.图 7a和图 7b分别给出了MAXC方法和EMR方法在测定误差δMc=0.20情况下的Mc的分布.而作为比较,图 7c和图 7d给出了MAXC、EMR分别与PMC方法计算结果差值的累积分布.由图可见,MAXC和EMR方法一方面在空间上获得的Mc结果的网格点明显偏少,另一方面,在误差δMc=0.15、0.20和0.30情况下Mc均显著低于MP结果.由垂直虚线标出的差值累积分布75%的位置可见,差值的优势分布分别在-0.5和-0.6个震级单位.
已有研究表明,不同的地震检测能力评估方法的结果存在差异.Woessner和Wiemer(2005)对北加州等地区的多方法研究和对比分析后认为,对最小完整性震级Mc的评估结果,存在MAXC/GFT- 90%/GFT-95%>EMR的情况.Schorlemmer和Woessner(2008)对南加州地区PMC与EMR方法的比较后发现,在77%的网格点上PMC方法获得的MP小于EMR方法获得的Mc结果,而约有11%的网格点则结果相反.本研究的比较结果与 Schorlemmer和Woessner(2008)的结果有所不同,究其原因,可能包括如下方面:首先,MAXC和EMR等方法考虑了利用单台法或使用2个或3个台站记录定位得到的位置相对不可靠的微震事件的检测能力,而PMC方法是在确保地震定位能力为前提,即要求至少4个台站记录并在定位中使用;其次,MAXC和EMR等方法未考虑台阵/台网在观测资料处理中的人为因素,即未考虑是否使用了更远的震中距记录的台站资料,以及台阵/台网数据传输是否正常等,因此可能过高估计了对地震的检测能力.
 |
图 8 MAXC、EMR方法给出的最小完整性震级Mc与PMC方法计算结果的比较 (a)MAXC方法给出的误差δMc=0.20情况下的Mc的分布;(b)EMR方法给出的误差δMc=0.20情况下的Mc的分布;(c)MAXC方法与PMC方法计算结果差值的累积分布;(d)EMR方法与PMC方法计算结果差值的累积分布.图(c)和(d)中分别 给出了误差δMc=0.15、0.2.和0.30情况下的结果,垂直虚线为差值在非累积情况下的峰值.Fig. 8 Comparing the completeness Mc of MAXC and EMR method with the PMC method (a)Distribution of Mc with δMc=0.20 calculated by MAXC method;(b)Distribution of Mc with δMc=0.20 calculated by EMR method;(c)Cumulative distribution of completeness difference between MAXC and PMC method;(d)Cumulative distribution of completeness difference between EMR and PMC method. The vertical dashed lines in(c) and (d)show the peak values in the non- cumulative stage. |
针对面向断裂带深部微震活动行为实时监测的高密度流动地震台阵的地震检测能力评估问题,本研究使用了基于概率的地震监测能力评估PMC方法,以西昌流动地震台阵为例,使用2013-01-13—2014-05-14期间的观测资料,分别考察了不同震源深度、某一时刻的实时地震检测能力,并与常用的MAXC和EMR方法进行了比较.研究获得如下方面的认识:
(1)由单台检测概率PD来看,不同台站的PD差异较大,一方面与周边台站的空间分布、台基信噪比等客观因素有关,另一方面与地震观测资料处理中是否限制不同震中距资料的使用等人为因素有关,不同台站PD的差异是提高台网运行质量、优化台网布局的重要参考因素.
(2)台阵对微震的检测能力在不同震源深度下存在差异,随深度的增加而降低.对西昌流动地震台阵,H=7.5 km时,“网内”的地震检测能力可达MP=ML0.8,部分台站密集、运行质量较好的地区可达ML0.5.当H=15.0 km时,“网内”的地震检测能力可达MP=ML1.0;当H=25.0 km时,“网内”的地震检测能力可达MP=ML1.4.
(3)PMC方法可对任一时刻开展地震检测能力的实时评估,在作为示例的2014-01-14时刻,非正常运行的台站造成周边地震检测能力的变化可被清晰识别出,此外,这些台站还可影响台阵的整体检测能力.
(4)与MAXC和EMR等其他方法的对比分析表明,由于设定的评估条件“苛刻”程度不同,其他方法可能过高估计了台阵的检测能力.
由于PMC方法以台阵/台网的实际产出数据为输入资料,可客观、接近真实地反应对地震的检测能力,通过震级-距离的折算,可对无地震或地震弱活动地区的检测能力进行评估.此外,PMC方法还可实现针对不同震源深度、某一时刻的实时检测能力评估.由此,PMC方法在开展余震活动监测、面向震情监视定量阈值要求的台阵/台网布设以及对区域地震台网/台阵的优化布局设计中,有重要的应用前景. 致谢 本文地震观测数据由“中国地震科学台阵数据中心”提供.研究中使用了德国海姆霍兹地球科学中心(GFZ)Danijel Schorlemmer教授编制的PMC方法计算程序,MAXC、EMR方法的计算程序源自瑞士联邦理工学院(ETH)编制的ZMAP程序包.“CSEP中国检验中心”筹备组专家对本工作给予了指导,两位评审专家的诸多有益建议对稿件的提升帮助很大,在此一并表示感谢.
| [1] | Deng Q D, Zhang P Z, Ran Y K,et al. 2003. Active tectonics and earthquake activities in China. Earth Science Frontiers, 10(S1): 66-73. |
| [2] | Department of Monitoring and Prediction, China Earthquake Administration. 2003. Digital Seismic Observation Technique (in Chinese). Beijing: Seismological Press, 521-522. |
| [3] | Eaton D, van der Baan M, Tary J, et al. 2013. Broadband microseismic observations from a Montney hydraulic fracture treatment, northeastern B.C., Canada. CSEG Recorder, 38(3): 44-53. |
| [4] | Enescu B, Ito K. 2002. Spatial analysis of the frequency-magnitude distribution and decay rate of aftershock activity of the 2000 Western Tottori earthquake. Earth Planet Space, 54(8): 847-859. |
| [5] | Gentili S, Sugan M, Peruzza L, Schorlemmer D. 2011. Probabilistic completeness assessment of the past 30 years of seismic monitoring in northeastern Italy. Phys. ,Earth and Planet. Inter. 186: 81-96. |
| [6] | Gomberg J. 1991. Seismicity and detection/location threshold in the southern Great Basin seismic network. J. Geophys. Res., 96: 16401-16414. |
| [7] | Gomberg J, Reasenberg P, Bodin P, Harris R. 2001. Earthquake triggering by seismic waves following the Landers and Hector Mine earthquakes. Nature, 411(6836): 462-466. |
| [8] | Gutenberg R, Richter C F. 1944. Frequency of earthquakes in California. Bull. Seism. Soc. Amer., 34(4): 185-188. |
| [9] | He H L, Ikeda Y. 2007. Faulting on the Anninghe fault zone, southwest China late quaternary and its movement model. Acta Seismologica Sinica, 29(5): 537-550. |
| [10] | Hickman S, Zoback M D, Ellsworth W. 2004. Introduction to special section: Preparing for the San Andreas Fault Observatory at Depth. Geophys. Res. Lett., 31, L12S01, doi:10.1029/2004GL020688. |
| [11] | Knopoff L. 2000. The magnitude distribution of declustered earthquakes in Southern California. Proc. Nat. Acad. Sci., 97(22): 11880-11884. |
| [12] | Li Z C, Huang Q H. 2014. Assessment of earthquake detection capability of the Capital-circle Seismic Network by using the Probability-based Magnitude of Completeness (PMC) method. Chinese J. Geophys., 57(8): 2584-2593. |
| [13] | Liu F, Jiang C S, Zhang F, et al. 2014. The study of detection capability of the Inner Mongolia regional seismic network. Acta Seismologica Sinica, 36(5), doi: 10.3969/j.issn.0253-3782.2014.05.000. |
| [14] | Maghsoudi S, Cesca S, Hainzl S, et al. 2013. Improving the estimation of detection probability and magnitude of completeness in strongly heterogeneous media, an application to acoustic emission (AE). Geophys. J. Inter., 193: 1556-1569. |
| [15] | Main I. 2000. Apparent breaks in scaling in the earthquake cumulative frequency-magnitude distribution: fact or artifact? Bull. Seism. Soc. Amer., 90(1): 86-97. |
| [16] | Nakatani M, Yabe Y, Philipp J, et al. 2008. Acoustic emission measurements in a deep gold mine in South Africa: project overview and some typical waveforms. Seism. Res. Lett., 79: 311. |
| [17] | Nanjo K, Ishibe T, Tsuruoka H, et al. 2010. Analysis of the completeness magnitude and seismic network coverage of Japan. Bull. Seism. Soc. Amer., 100: 3261-3268. |
| [18] | Plenkers K, Schorlemmer D, Kwiatek G. 2011. On the probability of detecting picoseismicity. Bull. Seism. Soc. Amer., 101: 2579-2591. |
| [19] | Rydelek P A, Sacks I S. 1989. Testing the completeness of earthquake catalogues and the hypothesis of self-similarity. Nature, 337: 251-253. |
| [20] | Schorlemmer D, Mele F, Marzocchi W. 2010. A completeness analysis of the National Seismic Network of Italy. J. Geophys. Res., 115: B04308. |
| [21] | Schorlemmer D, Woessner J. 2008. Probability of detecting an earthquake. Bull. Seism. Soc. Amer., 98: 2103-2117. |
| [22] | Sereno Jr T J, Bratt S R. 1989. Seismic detection capability at NORESS and implications for the detection threshold of a hypothetical network in the Soviet Union. J. Geophys. Res., 94: 10397-10414. |
| [23] | Stein R S. 1999. The role of stress transfer in earthquake occurrence. Nature, 402(6762): 605-609. |
| [24] | Wen X Z. 2000. Character of rupture segmentation of the Xianshuihe-Anninghe-Zemuhe fault zone, western Sichuan. Seismology and Geology, 22(3): 239-249. |
| [25] | Wiemer S, Wyss M. 2000. Minimum magnitude of complete reporting in earthquake catalogs: examples from Alaska, the Western United States, and Japan. Bull. Seism. Soc. Amer., 90: 859-869 |
| [26] | Wiemer S, Wyss M. 2002. Mapping spatial variability of the frequency-magnitude distribution of earthquakes. Adv. Geophys., 45(I-V): 259-302. |
| [27] | Woessner J, Wiemer S. 2005. Assessing the quality of earthquake catalogs: Estimating the magnitude of completeness and its uncertainties. Bull. seism. Soc. Amer., 95(4): 684-698. |
| [28] | 邓起东, 张培震, 冉勇康等. 2003. 中国活动构造与地震活动. 地学前缘, 10(S1): 66-73 |
| [29] | 何宏林, 池田安隆. 2007. 安宁河断裂带晚第四纪运动特征及模式的讨论. 地震学报, 29(5): 537-550. |
| [30] | 李智超, 黄清华. 2014. 基于概率完备震级评估首都圈地震台网检测能力. 地球物理学报, 2014, 57(8):2584-2593. |
| [31] | 刘芳, 蒋长胜, 张帆等. 2014. 内蒙古地震台网监测能力研究. 地震学报, 36(5), doi: 10.3969/j.issn.0253-3782.2014.05.000. |
| [32] | 闻学泽. 2000. 四川西部鲜水河—安宁河—则木河断裂带的地震破裂分段特征. 地震地质, 22(3): 239-249. |
| [33] | 中国地震局监测预报司. 2003. 数字地震观测技术. 北京: 地震出版社, 521-522. |
 2015, Vol. 58

