 2015, Vol. 58


2. 山西省地震局, 太原 030000
2. Shanxi Earthquake Bureau, Taiyuan 030000, China
We bandpass filtered WGM2012 global Bouguer gravity anomaly data to remove the data with wavelength less than 50 km and greater than 200 km. We then projected the gravity data and surface wave data from ambient noise tomography to a Cartesian coordinate system with grid spacing 50 km×50 km. The joint inversion was performed in this coordinate system. The inversion volume is much larger than the target region. This parameterization strategy was chosen to minimize the likelihood edge effects from gravity modelling. We used Crust 2.0 global model as our initial model in the inversion. An approximate non-linear P velocity and density relationship is derived from combing Birch's law and Nafe-Drake's curve. For each iteration of inversion, the sensitivity kernel of surface wave and gravity data were recalculated and updated until the inversion converged. We did several experiments to obtain an optimized weighting parameter to balance the influences of both datasets. A surface-wave-only inversion was also performed to compare the results of joint inversion.
Both shear wave velocity models from joint inversion and surface-wave-only inversion can fit surface wave data well though only the joint inversion provides an acceptable fit to the gravity data. Gravity misfits decrease from >30 mGal to ~3.4 mGal after joint inversion. The velocity anomalies from both inversions all show a remarkable correlation with surface geology and upper crustal structures beneath Shanxi rift. The Lüliang mountain region and Datong volcanic region all show relatively high shear wave velocity in the upper crust. Meanwhile, the basins in the southern rift show slow velocities. The southern part of the Shanxi rift is slower than the northern part in the upper crust. The Cenozoic extension started from the northern rift and then passed on to the southern rift. However, in the mid-and-lower crust beneath the Datong volcanic region, the surface-wave-only inversion resolves much slower shear wave velocity compared to the joint inversion model. The most pronounced difference occurs in the mid-and-lower crust beneath the Lüliang mountain region. The joint inversion reveals a slow velocity anomaly with amplitude about 2%, while the surface-wave-only inversion model shows a fast velocity.
The Datong volcanic region, north part of the Shanxi rift, might have experienced mantle upwelling since the Cenozoic time. The hot and buoyant mantle heated the upper most mantle and the crust, which caused the large-scale mid and lower crust slow velocity and negative gravity anomaly in the Datong volcanic region. The slow velocity anomaly beneath the Lüliang mountain region is also related to the mantle upwelling beneath the Datong volcanic region. The Cenozoic mantle upwelling might control the formation and evolution of the Shanxi rift.
利用面波的频散特性反演体波波速的方法已经被广泛应用于不同尺度的地壳及上地幔三维结构的 研究中(Shapiro et al., 2005; Yang and Ritzwoller, 2008; Yang et al., 2008),如区域尺度(Yang and Forsyth, 2006; Yao et al., 2006; Lin et al., 2007; Lin et al., 2009),大陆尺度(Yang et al., 2007; Lin et al., 2008)及全球尺度(Trampert and Woodhouse, 1995; Zhou et al., 2006).但是由于面波反演的非惟一性使得对面波成像得到的速度模型的解释变得困难.利用不同的地球物理观测数据和方法实施联合反演,是减少反演非惟一性的有效手段.如利用接收函数与面波频散曲线进行联合反演(Guo et al., 2015; Julià et al., 2000; 刘启元等,2010; Shen et al., 2013),利用远震体波走时残差与面波走时联合反演(Obrebski et al., 2011).现有的利用面波联合反演的研究大部分都集中在不同的地震震相记录与面波的联合反演,Manica(Maceira and Ammon, 2009)发展了一种面波与重力异常联合反演的方法,并将这种方法成功应用于西藏北缘的地壳上地幔结构的研究中.Manica的研究显示利用联合反演获得的S波速度模型可以同时解释观测反映的面波频散异常与卫星布格重力异常.本文基于Manica的方法,自主开发联合反演的程序,应用这种新的联合反演方法获得山西断陷带及其周缘地区高精度三维地壳横波波速结构.
山西断陷带位于华北克拉通中部,介于东边太行山和西边吕梁山之间,断陷带西部为鄂尔多斯地块,东部为华北平原裂陷盆地.华北克拉通被认为是形成于太古代的古老克拉通(Liu et al., 1992),其东部华北平原裂陷盆地在中新生代以来经 历了大规模的地壳拉张,岩石圈破坏、减薄(Menzies et al., 1993; Griffin et al., 1998). 华北克拉通的西部鄂尔多斯则仍保留了完整的岩石圈(Chen et al., 1991; Chen et al., 2009). 中生代以来山西断陷带经历了一定程度的拉张,现今的地堑被认为主要形成于上新世. GPS数据显示山西断陷带如今仍有约4±2 mm·a-1的近东西向拉张量(Shen et al., 2000; Wang et al., 2001).
近年来,由于固定地震台站的日益增多及流动地震台站的大规模布设,在这一地区地震学家利用不同的技术手段进行了大量的研究并取得了许多重要的结果.如接收函数的研究(Zheng et al., 2006; Chen,2009; 唐有彩等,2010;郭震等,2013),面波层析成像的研究(Huang et al., 2009; Zheng et al., 2011; Tang et al., 2013),远震体波成像的研究(Zhao et al., 2009; Chen and Pei, 2010; Pei and Chen, 2010),地震各项异性的研究(Zhao et al., 2007).这些研究利用不同方法揭示了山西断陷带的地壳与上地幔结构,加深了我们对山西断陷带岩石圈结构与演化及与华北克拉通东部破坏的关系的认识.但是仍有许多问题值得我们去探讨,如山西断陷带重力异常的成因,地幔与地壳物质的相互作用,克拉通的破坏成因等. 2 数据与反演方法 2.1 重力异常数据
由于研究区域包含了太行山、吕梁山等地形较高的山区以及地形较低的华北平原裂陷盆地、山西断陷盆地,地形起伏变化较为剧烈,为了去除地形的影响,使用布格重力异常而不是自由空气重力异常.使用精度为2′×2′的WGM2012全球布格重力异常作为参与联合反演的重力观测数据.WGM2012重力异常是通过计算全球重力模型EGM2008和DTU10获得,并引入了高精度的全球高程模型 ETOP01模型来计算地表起伏的贡献,对于WGM2012 重力异常模型的详细描述可参考Balmino(Balmino et al., 2012).对原始的重力异常数据进行去平均化,即每一点减去区域内重力异常的平均值.由于受到研究区域尺度的限制,重力场中长波长与短波长的成分是反演所无法解析的,因此对重力异常进行带通滤波,将波长小于50 km大于200 km的重力场分量滤去.为了便于正演重力异常值,所有的计算将在笛卡尔坐标系中进行,因此将预处理后得到的 重力异常值投影到笛卡尔坐标系,原点选取为128°E,38°N,格点间隔为50 km×50 km,南北向为y轴方向,以北为正,东西向为x轴方向,以东向为正,将每个网格点周围x,y=25 km正方形内的异常数据值平均,即以网格点为中心50 km×50 km方框内的数据做平均,作为此网格点的最终重力异常数据,这相当于对数据进行了一次低通滤波.图 1a显示了华北克拉通地区原始重力异常的分布,图 1a方框勾勒出目标研究区域,图 1b显示了经过了预处理以及坐标变换后得到的重力异常分布.
 |
图 1 台站分布以及地质构造图 蓝色三角形为背景噪声成像时所用台站分布(唐有彩等,2011;Tang,2013),红色圆点为中国东部新生代火山分布,背景颜色代表了卫星布格重力异常(http://bgi.omp.obs-mip.fr/).黑色方框为本文研究区域.右图为经过滤波去均值化后的布 格重力异常,并以128°E、38°N为原点转到笛卡尔坐标系下.OD:鄂尔多斯;TNCO:华北克拉通中部构造带;DT:大同火山区; LL:吕梁山区;TH:太行山区;Shanxi Rift:山西断陷带.Fig. 1 Seismic statsions(blue triangles)with tectonic features The red points are Cenozoic volcans in North China. The backgroud color denotes the unfiltered Bouguer gravity anomalies. Bouguer gravity anomalies are downloaded from http://bgi.omp.obs-mip.fr/.The right panelis the filtered gravity data with the mean value is removed. The anomalies with sizelarger than 200 km and smaller than 25 km are filterd. We transformed the gravity data and surface wave data into cartesian systemwith the original point at 128°E—38°N. OD: Erdos; TNCO: Trans-North China Orogen; HB: Huabei Basin; DT: Datong volcanic region; LL: Lüliang mountain region; TH: Taihang mountain region. |
本研究采用的面波频散的数据来自于背景噪声成像得到的周期为6~40 s的面波相速度图(唐有彩等,2011; Tang et al., 2013).背景噪声成像所使用的地震数据包括于2006年8月至2008年3月布设于山西断陷带南部的两条宽屏带地震剖面,山西及河北的固定台站,中国地震局地球物理研究所的华北科学探测台的部分流动台站,总计有141个地震站的连续记录.二维相速度模型具有较好的射线分布并覆盖了山西断陷带及部分华北盆地.检测板实验显示相速度模型分辨率整体可以达到2°×2°,部分地区可以达到1°×1°.具体的台站分布,成像方法及模型分辨率可参见文献(唐有彩等,2011).为了与重力数据保持一直,将格点为0.5°×0.5°的面波相速度图线性插值到2.1节所述的50 km×50 km的笛卡尔坐标系中,同样选取128°E,38°N为坐标原点,以北向为y轴正向,东向为x轴正向.图 2(a—d)显示了笛卡尔坐标系下研究区8、14、25、40 s二维相速度图.
 |
图 2 不同周期背景噪声面波相速度异常图 对应周期的参考速度标于右下方.Fig. 2 Phase velocity anomalies maps at different periods from ambient noise tomography The reference velocities are labelled at the right corners. |
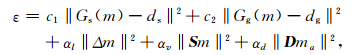
由于Rayleigh波对S波速度较为敏感,而对P波及密度敏感性较弱,因此在本研究中忽略径向各向异性的影响(Maceira and Ammon, 2009),只反演地下介质的三维横波波速VS.在反演中选取固定的纵横波波速比,在0~2 km选取VP/VS为2.0,在其余层选取VP/VS为1.732.待反演的模型在x、y方向都是50 km间距的格点,模型在水平方向远大于研究区域,其目的是压制边界效应.深度方向为从地 表到400 km的水平层状介质,层厚由浅到深从2 km变化到20 km,本文关心的范围为0~50 km,之所以将深度拓展到400 km是为了吸收由于不完全滤波留下的波长大于50 km的布格重力异常.反演的目标函数如下:
 和
和 ,其中p为权重参数,其值介于0~1之间,p为1则反演结果全部由面波得到,重力没有任何贡献,p为0则相反.N为数据的长度,其中面波使用了从6~40 s的数据,12 s以内以每2 s为间隔,12~20 s以4 s为间隔,20~40 s以5 s为间隔,共11个周期的数据.σ反映了不同数据的不确定性,在实际研究中这一个很难测定的值,由于面波数据是经过层析成像的反演得到的,无法估计反演中误差的传递,因此根据Mancia(Julià et al., 2000; Maceira and Ammon, 2009)的建议将面波的不确定性选为0.02 km·s-1,而重力的不确定性选为1 mGal. D 与αd为衰减矩阵与衰减系数,衰减矩阵的引入是为了使反演不至于过分偏离于初始模型.初始模型(ma)的地壳部分选取crust2.0在本区域的平均值,而地幔部分选取AK135模型,速度界面均作了一定的平滑.模型水平向最外三层与垂直向最下面三层选取了10倍于内部的al值以吸收边界效应.Δ与 S 分别为垂直向长度与水平向拉普拉斯平滑矩阵,αl与αv为相应的平滑系数.之后利用LSQR进行迭代反演,每一次迭代面波频散曲线的敏感核将会基于新的模型重新计算直至反演结果收敛到数据误差范围内结束.为了将速度与密度参数统一于联合反演中,需要建立两者之间的经验关系.采用Manica(Maceira and Ammon, 2009)提出的经验公式建立速度与密度的关系:
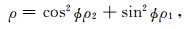
 为差值函数,
 决定了 该选择哪一个经验公式,在这里ac=6.2 km·s-1.
2.4 面波频散与重力异常的敏感核
决定了 该选择哪一个经验公式,在这里ac=6.2 km·s-1.
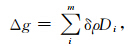
2.4 面波频散与重力异常的敏感核 面波频散曲线对于S波速度有较强的敏感性,而对P波速度的敏感度远小于对S波,面波对于密度的敏感性主要集中于地表附近,其敏感性也小于S波(图 3).在反演中为了减少反演的未知参数,仅反演S波速度而固定S波对于P波和密度的关系(Dahlen and Tromp, 1998).不同周期的面波对应S波速度的敏感深度不同,敏感核的最大值大致对应于1/3波长处,即6~8 s对8~10 km的上地壳最为敏感而10~15 s对中地壳具有较强的敏感性,从20 s开始到40 s,面波逐步反映下地壳与上地幔顶部的结构特性,地壳厚度对这一频段的面波影响较大,其中较厚的地壳可能造成较低的相速度而较薄的地壳造成较高的速度.在计算重力异常时,以每个模型网格点为中心形成水平向50 km×50 km,纵向等于层厚的方块体,并参考了Plouff(1976)给出的公式,对于每个模型中第i个立方体表达如下:
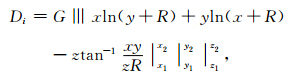
 为牛顿重力常数,最终地表每一点的理论布格重力异常值是所有块体贡献的总和:
 |
图 3 面波频散曲线对于初始模型S波速度(黑色)、P波速度(红色)和密度(绿色)的敏感核Fig. 3 Depth-sensitivity kernels of phase velocity for S velocity(black line),P velocity(red line) and density(green line) |
 |
图 4 位于原点的重力敏感核沿x轴(东西)方向分布图Fig. 4 Cross section of gravity sensitivity to density(Kernel)at orginal point calculated from Plouff(Plouff,1976) |
按照上文所述的方法进行反演得到山西断陷带地区的三维S波速度结构,为了探讨联合反演过程中重力异常数据的引入对最终三维S波速度结构的影响,对比了单独利用面波的反演和联合反演的结果,在不同的反演中采取固定的衰减系数、水平平滑系数和垂向平滑系数等正则化参数.为了得到权重因子p的值,进行了一系列实验,取不同的p值进行反演,并分别计算重力与面波的残差,绘出L形曲线,选取曲线拐点处的值为权重因子(图 5),图 6a展示了单独利用面波反演得到的S波速度结构,即公式(1)中权重因子p取为1,将此模型称为Mod1. 图 6a展示了单独利用面波反演得到的S波在7 km、 22 km和32 km深度的水平切面,并给出了理论布格重力异常图,即利用上文所述速度-密度经验公式和固定的横纵波波速比将Mod1的S波速度转化为密度得到的布格重力异常值.Mod1的理论布格重力异常与观测重力值有较大的差异,残差较大为 32.5 mGal.而Mod1正演得到的面波频散曲线与观测数据的残差为0.21 km·s-1.
 |
图 5 重力值残差与频散曲线残差的L形曲线 曲线上所标数字为权重因子p的取值.Fig. 5 L curve of gravity residuals versus dispersion residuals We chose weighting parameter p at the turning point of the L curve. |
 |
图 6(A)面波单独反演速度模型在7、22 km和32 km处的水平截面以及利用反演模型恢复得到的重力异常图;五角星给出了图 7频散曲线所在的位置;(B)相应的联合反演的结果Fig. 6(A)is S wave anomaly maps at different depth from surface wave inversion exculsively with output Bouguer gravity. Stars in the left figure are locations of dispersion curves given by Fig. 7.(B)is corresponding from joint inversion |
Mod1(图 6A)显示山西断陷带地区地表、上地壳速度异常与地表地质观测存在较大的相关性,断陷带西部吕梁山地区、北部大同火山区、以及东部太行山地区呈现出较高的S波速度,而断陷带中部的盆地呈现相对的低速.尽管华北平原裂陷盆地并不在本文研究范围之内,但是在东部的盆山交界处还是明显的观测到高速、低速的变化.山西断陷带中地壳最为突出的是北部大同火山区域呈现较大范围的低速,该低速异常一直延伸至下地壳.而西部的吕梁山地区在中地壳呈现相对的高速.Mod1模型得到的理论的布格重力异常显示在大同火山区存在较强的大于-80 mGal的布格重力负异常.观测重力值也显示了该地区存在负的布格重力异常,但范围约在-30到-50 mGal之间.而理论重力值显示吕梁山地区存在较强的大于+80 mGal正异常,但重力观测并没有显示该地区存在正的重力异常.
 |
图 7 对比某些点观测频散曲线与S波模型得到的理论频散曲线 (a)面波反演得到的模型计算出的频散曲线,红线所在位置为吕梁山地区(-100,50),黑线在太原盆地(50,300),蓝线在大同火山区(0,-100),虚线为观测相速度,星号为理论相速度;(b)联合反演. Fig. 7 Comparison between observed and synthetic phase velocities from joint inversion and from surface wave inversion only at some locations,labelled at Fig. 6. Red line is located at the Lüliang region,black line is at Taiyuan basin and blue line is located at Datong volcanic region. The dashed lines denote observed phase velocities and stars are synthetic phase velocities. (b)is joint inversion |
将联合反演得到的三维S波速度模型命名为Mod2(图 6b),本次实验中选取两种数据的权重因子p为0.4.同样,在图 6给出了7 km、22 km和32 km的速度模型以及联合反演得到的理论布格重力异常图.两个模型在上地壳(7 km)中的差别较小,Mod2同样显示了盆地区呈现低波速而山区呈现较高的S波速度.而在大同火山区中下地壳Mod2表现出大范围的约3%~4%的低速异常,Mod1中该 地区的低速异常大于5%.两组模型的最大区别在于吕梁山地区中下地壳(22~32 km).Mod1显示该区域在中地壳呈现相对的高速,而Mod2模型中则没有相应的高速体,反而在下地壳存在约2%的低速异常.图 8给出了吕梁山地区一点的S波速度剖面,位置对应于图 6a左图 中吕梁山区的五角星所在位置,联合反演(红色线条)的结果显示中下地壳的速度比面波单独反演的低.经过联合反演之后,重力异常观测的残差由>30 mGal 减少到3.4 mGal,即重力异常残差减少了一个数量 级,而面波频散曲线的残差略有增加为0.25 km·s-1. 图 7给出了研究区域中几个不同地点的频散曲线观测值(虚线)和分别从Mod1和Mod2得到的理论频散曲线(五角星),两个模型都可以较好的拟合观测的面波数据.为了进一步验证反演的可靠性,我们进行了检测板实验,输入模型为50 km×50 km的异常体,异常体的幅值为正负6%,均值为联合反演中的初始模型,按照实际的射线分布先进行面波成像然后反演S波速度结构.图 9为22 km深度处的模型恢复情况,图 9a为面波单独反演的结果,图 9b为联合反演后的结果.由于重力数据为反演提供了额外的数据,因此相比于面波单独反演,联合反演的检测板恢复情况更好.
 |
图 8 吕梁山区一格点的S波速度剖面 其位置为(-100,50)即图 7红线所在的位置.红色为面波单独反演的结果,黑色为联合反演后的结果. 相比于面波单独反 演,联合反演得到的中下地壳的S波速度较低. Fig. 8 VS velocity profile at a grid in the Lüliang region,corresponding to the red lines in Fig. 7. The red is the result from dispersion inversion and black line is the result from joint inversion |
 |
图 9 检测板实验 输入模型为正负6%高低速相间的异常体;(a)面波反演后的模型恢复情况;(b)联合反演后的模型恢复情况. Fig. 9 Checkerboard tests The input model is 50 km×50 km and ±5% checkerboard style velocity variations with a constant S velocity from our initial model.(a)is result from dispersion inversion only and (b)is from joint inversion. Joint inversion slightly improves the recovery ability compared to the dispersion inversion. |
本文引入了联合反演背景噪声面波频散曲线和布格重力异常的方法来获得山西断陷带地壳三维S波速度结构.联合反演的结果显示该区域上地壳的速度结构与地表地质构造具有较强的关联性,如断陷带中部新生代沉积盆地呈现低速而东西部吕梁山、太行山区呈现高速.最为明显的是吕梁山区较强的高速异常,可能与该地区分布有大量的元古代的变质岩及花岗岩有关(耿元生等,2006).太原盆地也表现出明显的低速异常,这可能与该盆地较厚的沉积有关,太原盆地断陷幅度一般大于2 km,最深处位于清徐一带达到3.8 km(Meng et al., 2003). 山西断陷带南部相对于断陷带北部表现为低速,这可能与断陷带拉张的过程从西南向东北逐渐发展有关,因此断陷带南部的盆地发育比北部要更为成熟(Zhang et al., 2003),这一点也可以从地震活动性中看出,沿断陷带的地震分布也明显表现出从南到北逐渐变浅(宋美琴等,2012).联合反演揭示在太原盆地的下地壳(>30 km处)存在高速异常;对应接收函数剖面研究,该盆地下方的Moho面呈现较为明显的隆起,Moho深度约为35 km(唐有彩等,2010).
山西断陷带北部的大同火山区在中下地壳存在大范围的低速异常,该地区布格重力也表现出较大范围的负异常.大同火山区在新生代以来经历了强烈的多次岩浆喷发,近几年的面波及体波层析成像结果均显示大同火山区的低速体可从地表追溯到上地幔.新生代以来的地幔热物质上涌引起的岩浆活动可能造成了该地区的地壳以及上地幔的低速及低密度异常体,使得该地区的布格重力呈现较强的负 异常(Tian et al., 2009; Zhao et al., 2009; Tian and Zhao, 2011; Tang et al., 2013; Tian and Zhao, 2013). 接收函数的结果显示山西地区的地壳厚度呈现北厚南薄的形态,Zheng等认为地幔岩浆对下地壳的底侵作用造成大同火山区具有较厚的下地壳(Zheng et al., 2006; Zheng et al., 2008).
联合反演获得的S波速度模型显示山西断陷带西部的吕梁山地区在中下地壳呈现出相对的低速,而利用面波单独反演却未观测到该低速异常.造成这种差异的原因可能有几种,第一,在较长周期噪声面波成像(20~30 s)中的确观测到了约2%的高速异常,由于面波相速度的敏感核宽度随着周期变长而变宽,因此较长周期图像中该地区的高速异常可能是由于浅部的大于5%的高速异常所引起,或者由于台站的分布以及在背景噪声成像中数据选取的缘故(Bensen et al., 2007; Lin et al., 2008),较长周期的面波成像在断陷带西部的分辨率较低(唐有彩等,2011),而重力数据作为独立的数据源在地表每一点都有分布,作为对面波数据的补充联合反演可以相应提高对于该地区的分辨率.第二,在联合反演时对不同地区采取了同样的速度-密度经验关系,而该经验公式可能并不适用于吕梁山地区,在该地区大规模分布的变质岩可能是造成该经验关系不成立或误差较大的原因.第三,虽然对原始重力数据进行了带通滤波,以减小地幔深部异常体的贡献,但是地幔的密度异常体仍有可能对观测的重力数据造成影响.可能的情况是吕梁山地区在地壳内部存在着具有相对高密度的高速体,但在深部地幔内存在较小范围的低密度体抵消了这种影响.虽然该地区体波成像模型在地幔中显示出低速异常,但是不同的模型给出的异常体位置、形态以及幅度均有所不同(Tian et al., 2009; Zhao et al., 2009; Tian and Zhao, 2011; Tian and Zhao, 2013),所以无法定量的分析这些低速异常体对重力观测值的影响.
通过对于两个模型的比较,联合反演速度模型Mod2中大同火山区低速体的异常约为-3%~-4%,小于面波单独反演得到的模型Mod1的低速异常(>5%).更重要的是,联合反演速度模型揭示的吕梁山地区在中下地壳存在低速异常,并且和北部的大同火山区低速异常相连接,并与前人研究结 果一致(Tian et al., 2009; Zhao et al., 2009; Tian and Zhao, 2011; Tian and Zhao, 2013),很可能说明导致新生代以来大同火山区岩浆活动的上地幔构造活动(上地幔局部上涌,地幔柱)可能对于山西断陷带的形成和构造活动起到了一定的控制作用,并且导致了吕梁山地区中下地壳的低速异常.
本文受益于美国UW-Madison大学Clifford Thurber 教授和MIT的Haijiang Zhang博士于2012年11月在北京大学举办的“Workshop on Joint Geophysics Inversion”讲座.山西地震局为本研究提供了固定地震台站数据,北京大学地震大地构造学研究小组提供了流动地震台站数据,在此一并致谢.
| [1] | Balmino G, Vales N, Bonvalot S, et al. 2012. Spherical harmonic modelling to ultra-high degree of Bouguer and isostatic anomalies. Journal of Geodesy, 86(7): 499-520. |
| [2] | Bensen G D, Ritzwoller M H, Barmin M P, et al. 2007. Processing seismic ambient noise data to obtain reliable broad-band surface wave dispersion measurements. Geophysical Journal International, 169(3): 1239-1260. |
| [3] | Chen G Y, Song Z H, An C Q, et al. 1991. Three dimensional crust and upper mantle structure of the North China region. Acta Geophys. Sin., 34(2): 172-181. |
| [4] | Chen L. 2009. Lithospheric structure variations between the eastern and central North China Craton from S-and P-receiver function migration. Physics of the Earth and Planetary Interiors, 173(3-7): 216-227. |
| [5] | Chen L, Cheng C, Wei Z G. 2009. Seismic evidence for significant lateral variations in lithospheric thickness beneath the central and western North China Craton. Earth and Planetary Science Letters, 286(1-2): 171-183. |
| [6] | Chen Y J, Pei S P. 2010. Tomographic structure of East Asia: II. Stagnant slab above 660 km discontinuity and its geodynamic implications. Earthquake Science, 23(6): 613-626. |
| [7] | Dahlen F A, Trom J. 1998. Theoretical Global Seismology. Princeton: Princeton University Press. |
| [8] | Geng Y S, Yang C H, Wan Y S. 2006. Paleoproterozoic granitic magmatism in the Lüliang area, North China Craton: constraint from isotopic geochronology. Acta Petrologica Sinica (in Chinese), 22(2): 305-314. |
| [9] | Griffin W F J, Chung S L, Lo C H, et al. 1998. Phanerozoic evolution of the lithosphere beneath the Sino-Korean Craton. Geodynamics Series, 27: 107-126. |
| [10] | Guo Z, Chen Y J, Ning J, et al. 2015. High resolution 3-D crustal structure beneath NE China from joint inversion of ambient noise and receiver functions using NECESSArray data. Earth and Planetary Science Letters, 416(0), 1-11. doi: http://dx.doi.org/10.1016/j.epsl.2015.01.044 |
| [11] | Guo Z, Tang Y C, Chen Y S, et al. 2012. A study on crustal and upper mantle structures in east part of North China Craton using receiver functions. Chinese J. Geophys. (in Chinese), 55(11) : 3591-3600. |
| [12] | Huang Z X, Li H Y, Zheng Y J, et al. 2009. The lithosphere of North China Craton from surface wave tomography. Earth and Planetary Science Letters, 288(1-2): 164-173. |
| [13] | Julià J, Ammon C J, Herrmann R B, et al. 2000. Joint inversion of receiver function and surface wave dispersion observations. Geophysical Journal International, 143(1): 99-112. |
| [14] | Lin F C, Ritzwoller M H, Townend J, et al. 2007. Ambient noise Rayleigh wave tomography of New Zealand. Geophysical Journal International, 170(2): 649-666. |
| [15] | Lin F C, Moschetti M P, Ritzwoller M H. 2008. Surface wave tomography of the western United States from ambient seismic noise: Rayleigh and Love wave phase velocity maps. Geophysical Journal International, 173(1): 281-298. |
| [16] | Lin F C, Ritzwoller M H, Snieder R. 2009. Eikonal tomography: surface wave tomography by phase front tracking across a regional broad-band seismic array. Geophysical Journal International, 177(3): 1091-1110. |
| [17] | Liu D Y, Nutman A P, Compston W, et al. 1992. Remnants of ≥3800 Ma crust in the Chinese part of the Sino-Korean craton. Geology, 20(4): 339-342. |
| [18] | Liu Q Y, Li Y, Chen J H, et al. 2010. Joint inversion of receiver function and ambient noise based on Bayesian theory. Chinese J. Geophys. (in Chinese), 53(11) : 2603-2612. |
| [19] | Maceira M, Ammon C J. 2009. Joint inversion of surface wave velocity and gravity observations and its application to central Asian basins shear velocity structure. Journal of Geophysical Research: Solid Earth (1978-2012), 114(B2), DOI: 10.1029/2007JB005157. |
| [20] | Meng Q R, Hu J M, Jin J Q, et al. 2003. Tectonics of the late Mesozoic wide extensional basin system in the China-Mongolia border region. Basin Research, 15(3): 397-415. |
| [21] | Menzies M A, Fan W, Zhang M. 1993. Palaeozoic and Cenozoic lithoprobes and the loss of >120 km of Archaean lithosphere, Sino-Korean craton, China. Geological Society, London, Special Publications, 76(1): 71-81. |
| [22] | Obrebski M, Allen R M, Pollitz F, et al. 2011. Lithosphere-asthenosphere interaction beneath the western United States from the joint inversion of body-wave traveltimes and surface-wave phase velocities. Geophysical Journal International, 185(2): 1003-1021. |
| [23] | Pei S P, Chen Y J. 2010. Tomographic structure of East Asia: I. No fast (slab) anomalies beneath 660 km discontinuity. Earthquake Science, 23(6): 597-611. |
| [24] | Plouff D. 1976. Gravity and magnetic fields of polygonal prisms and application to magnetic terrain corrections. Geophysics, 41(4): 727-741. |
| [25] | Shapiro N M, Campillo M, Stehly L, et al. 2005. High-resolution surface-wave tomography from ambient seismic noise. Science, 307(5715): 1615-1618. |
| [26] | Shen W S, Ritzwoller M H, Schulte-Pelkum V, et al. 2013. Joint inversion of surface wave dispersion and receiver functions: A Bayesian Monte-Carlo approach. Geophysical Journal International, 192(2): 807-836. |
| [27] | Shen Z K, Zhao C K, Yin A, et al. 2000. Contemporary crustal deformation in East Asia constrained by Global Positioning System measurements. Journal of Geophysical Research: Solid Earth 1978-2012, 105(B3): 5721-5734. |
| [28] | Song M Q, Zheng Y, Ge C, et al. 2012. Relocation of small to moderate earthquakes in Shanxi Province and its relation to the seismogenic structures. Chinese J. Geophys. (in Chinese), 55(2): 513-525. |
| [29] | Tang Y C, Feng Y G, Chen Y S, et al. 2010. Receiver function analysis at Shanxi Rift. Chinese J. Geophys. (in Chinese), 53(9): 2102-2109. |
| [30] | Tang Y C, Chen Y S, Yang Y J, et al. 2011. Ambient noise tomography in north China craton. Chinese J. Geophys. (in Chinese), 54(8): 2011-2022. |
| [31] | Tang Y C, Chen Y J, Zhou S Y, et al. 2013. Lithosphere structure and thickness beneath the North China Craton from joint inversion of ambient noise and surface wave tomography. J. Geophys. Res.: Solid Earth, 118(5), doi: 10.1002/jgrb.50191. |
| [32] | Tian Y, Zhao D P, Sun R M, et al. 2009. Seismic imaging of the crust and upper mantle beneath the North China Craton. Physics of the Earth and Planetary Interiors, 172(3-4): 169-182. |
| [33] | Tian Y, Zhao D P. 2011. Destruction mechanism of the North China Craton: insight from P and S wave mantle tomography. Journal of Asian Earth Sciences, 42(6): 1132-1145. |
| [34] | Tian Y, Zhao D P. 2013. Reactivation and mantle dynamics of North China Craton: insight from P-wave anisotropy tomography. Geophysical Journal International, 195(3): 1796-1810. |
| [35] | Wang Q, Zhang P Z, Freymueller J T, et al. 2001. Present-day crustal deformation in China constrained by global positioning system measurements. Science, 294(5542): 574-577. |
| [36] | Yang Y J, Forsyth D W. 2006. Rayleigh wave phase velocities, small-scale convection, and azimuthal anisotropy beneath southern California. Journal of Geophysical Research: Solid Earth 1978-2012, 111(B7), doi: 10.1029/2005JB004180. |
| [37] | Yang Y J, Ritzwoller M H, Levshin A L, et al. 2007. Ambient noise Rayleigh wave tomography across Europe. Geophysical Journal International, 168(1): 259-274. |
| [38] | Yang Y J, Ritzwoller M H. 2008. Teleseismic surface wave tomography in the western US using the Transportable Array component of USArray. Geophysical Research Letters, 35(4), doi: 10.1029/2007GL032278. |
| [39] | Yang Y J, Ritzwoller M H, Lin F C, et al. 2008. Structure of the crust and uppermost mantle beneath the western United States revealed by ambient noise and earthquake tomography. Journal of Geophysical Research: Solid Earth 1978-2012, 113(B12), doi: 10.1029/2008JB005833. |
| [40] | Yao H J, Van Der Hilst R D, De Hoop M V. 2006. Surface-wave array tomography in SE Tibet from ambient seismic noise and two-station analysis—I. Phase velocity maps. Geophysical Journal International, 166(2): 732-744. |
| [41] | Zhang P Z, Deng Q D, Zhang G M, et al. 2003. Active tectonic blocks and strong earthquakes in the continent of China. Science in China Series D: Earth Sciences, 46(2): 13-24. |
| [42] | Zhao L, Zheng T Y, Chen L, et al. 2007. Shear wave splitting ineastern and central China: Implications for upper mantle deformation beneath continental margin. Physics of the Earth and Planetary Interiors, 162(1-2): 73-84. |
| [43] | Zhao L, Allen R M, Zheng T Y, et al. 2009. Reactivation of an Archean craton: Constraints from P-and S-wave tomography in North China. Geophysical Research Letters, 36(17), doi: 10.1029/2009GL039781. |
| [44] | Zheng T Y, Chen L, Zhao L, et al. 2006. Crust-mantle structure difference across the gravity gradient zone in North China Craton: Seismic image of the thinned continental crust. Physics of the Earth and Planetary Interiors, 159(1-2): 43-58. |
| [45] | Zheng T Y, Zhao L, Zhu R X. 2008. Insight into the geodynamics of cratonic reactivation from seismic analysis of the crust-mantle boundary. Geophysical Research Letters, 35(8), doi: 10.1029/2008GL033439. |
| [46] | Zheng Y, Shen W S, Zhou L Q, et al. 2011. Crust and uppermost mantle beneath the North China Craton, northeastern China, and the Sea of Japan from ambient noise tomography. Journal of Geophysical Research: Solid Earth 1978-2012, 116(B12), doi: 10.1029/2011JB008637. |
| [47] | Zhou Y, Nolet G, Dahlen F A, et al. 2006. Global upper-mantle structure from finite-frequency surface-wave tomography. Journal of Geophysical Research: Solid Earth 1978-2012, 111(B4), doi: 10.1029/2005JB003677. |
| [48] | 耿元生, 杨崇辉, 万渝生. 2006. 吕梁地区古元古代花岗岩浆作用——来自同位素年代学的证据. 岩石学报, 22(2): 305-314. |
| [49] | 郭震, 唐有彩, 陈永顺等. 2013. 华北克拉通东部地壳和上地幔结构的接收函数研究. 地球物理学报, 55(11): 3591-3600. |
| [50] | 刘启元, 李昱, 陈九辉等. 2010. 基于贝叶斯理论的接收函数与环境噪声联合反演. 地球物理学报, 53(11): 2603-2612. |
| [51] | 宋美琴, 郑勇, 葛粲等. 2012. 山西地震带中小震精确位置及其显示的山西地震构造特征. 地球物理学报, 55(2): 513-525. |
| [52] | 唐有彩, 冯永革, 陈永顺等. 2010. 山西断陷带地壳结构的接收函数研究. 地球物理学报, 53(9): 2102-2109. |
| [53] | 唐有彩, 陈永顺, 杨英杰等. 2011. 华北克拉通中部地区背景噪声成像. 地球物理学报, 54(8): 2011-2022. |