 2015, Vol. 58


2. 德克萨斯理工大学地球科学系, 拉伯克, 德克萨斯, 美国;
3. 休斯顿大学地球与大气科学系, 休斯顿, 德克萨斯, 美国
2. Department of Geosciences, Texas Tech University, Lubbock, TX79409, USA;
3. Department of Earth & Atmospheric Sciences, University of Houston, Houston, TX 77004, USA
By comparing the TVR profile and the surface geologic units we interpret the upper crustal structure of the TG region. The interpreted Sichuan basin and Zigui basin correlate well with the surface geology and the tectonic background. We found that the sediments of Zigui basin thicken toward east, and reach to 2.6 km at the thickest point. However, the Sichuan basin becomes thinner toward east. The Sichuan basin is truncated by the Huangling anticlineand is exposed on surface to the west of Huangling anticline. The TVR profile also shows that there is a low-velocity zone at the bottom of the Sichuan basin, supporting the existence of a strong seismic velocity gradient zone. We suspect that the velocity gradient zone is a fracture zone caused by the eastward movement of Sichuan basin. Further geophysical evidences are required to support this interpretation. To test the TVR algorithm we use the elastic forward modeling. The results of forward modeling show that the TVR method can be applied to image the upper crustal structure of the TG region. It also shows that stacking images of multiple-offset teleseismic event can improve the signal-to-noise ratio and the continuation of reflectors. By analyzing the relation between seismic frequency and the quality of TVR images we found that there is an optimal frequency range for TVR. In seismic record the high frequency is usually dominated by the environmental noise, while the low frequency will hurt the resolvability of deconvolution for shallow crustal structure. By use of the teleseismic data and the TVR method we constructed the upper crustal seismic profile of the TG region. The imaged bottoms of the Zigui Basin and the eastern Sichuan basin show the interaction between the sedimentary basins and the crystalline basement. The imaging accuracy and stability can be evaluated by the forward modeling. It is suggested using the teleseismic signal within the frequency band of 1~2 Hz for TVR imaging to reduce the impact of low frequency on the imaging resolution and the influence of high-frequency noise. The TVR method can be applied to those regions that are unsuitable for active seismic surveys and/or lack low frequency data.
远震虚震源反射成像,或称虚震源成像(Teleseismic Virtual-source Reflection or TVR,imaging),最初由Yu和Schuster提出(Yu and Schuster,2001). 此方法后被用于研究Moho面结构(Li and Nábělek,1999; Tseng and Chen,2006; Tseng et al.,2009)和盆地结构(Yang et al.,2012),又被称为垂直接 收函数(Langston and Hammer,2001; Yang et al.,2012). 常规的接收函数方法通过对单个地震台长期积累的多分量地震数据进行处理和叠加产生.与常规接收函数方法不同,虚震源成像方法对地震台网中多个台站的垂直分量地震数据进行同时处理,也可以对单个地震事件资料进行处理和分析(Tseng and Chen,2006; Tseng et al.,2009; Yang et al.,2012),使得短周期临时台网单分量数据的应用变得更加灵活.目前,虚震源成像应用于上地壳的成功实例较少,其主要原因包括缺乏对频率响应和成像剖面叠加等关键操作步骤的深入研究与测试.本研究的主要目的之一就是测试TVR方法对长江三峡库首区上地壳结构进行远震成像的效果.
长江三峡地区位于中国湖北省西部与重庆市交界处,因三峡水利工程而闻名于世.根据区域地质构造划分,三峡位于扬子板块内,北部与秦岭—大别造山带相邻(Zhang et al.,2009).三峡地区内分布着侏罗纪秭归盆地和一个花岗岩侵入体——黄陵背斜.黄陵背斜周缘具有相对完整的地质露头,对研究其西部四川盆地以及其东部江汉盆地的沉积作用和层序结构、寻找有利的资源远景区具有重要意义(渠洪杰等,2009; Vernhet and Reijmer,2010).同时,黄陵背斜是研究扬子板块演化的窗口(熊成云等,2004),其内部出露的花岗岩体为研究扬子板块及周边地区的地壳及上地幔结构和区域地质演化提供了证据(Hu et al.,2006; 沈传波等,2009; Hu et al.,2012).因此,研究上地壳结构对于揭示三峡地区不同地质单元间的内在关系、重构地质演化历史具有重要的经济和科学意义.
三峡地区秭归盆地周边分布着高桥断裂、新华断裂和仙女山断裂等活动断层带.三峡水库蓄水后该区域微震发震频率和震级明显升高(夏金梧等,2008; 廖武林等,2009),可能与这些活动断裂的活动有关.例如中国地震信息网报道的2008年秭归4.1级地震和2013年巴东5.1级地震就分别发生在仙女山断裂和高桥断裂附近.研究三峡地区的上地壳结构有助于分析这些断裂的成因和深度,有益于评估该地地壳结构的稳定程度.
三峡地区的早期地球物理研究有航磁、重力和地震调查(申重阳等,1990; 王石任等,1992; 陈学波,1994).虽然航磁观测研究了结晶基底的深度,但总体研究集中于中下地壳和上地幔结构.最近使用早期人工地震剖面的走时反演得到了三峡地区沿长江的二维地震P波速度结构(Zhang et al.,2009).随着三峡地震台网的建立,更多的地震数据积累使得三峡地区的三维速度结构研究变得可能(廖武林等,2007; Li et al.,2009; Zhou et al.,2010; Mei et al.,2013).虽然地震走时拾取的低精度、地震层析成像规则化和具体实施步骤的不同导致这些层析成像结果存在一定的差异,但层析成像得到的共识是:三峡地区上地壳6~10 km的深度范围存在较大的地震波速度梯度变化,而中、下地壳地震波速度梯度较小.在这种速度结构中正演模拟时大多数直达地震波会沿较高速度梯度层的底界面传播,导致在震中距较小的三峡地区地震速度层析成像对深度的探测能力受到了限制.解决此问题的一个有效手段是利用反射地震波成像.
迄今为止三峡地区还没有一张可靠的反射地震叠加剖面.本研究于2011年6月在三峡地区布设一个高密度临时台网,用于监测当地的小震、微震.收集到的数据用于对三峡地区进行地震定位(Zou et al.,2014)和地壳、上地幔地震结构研究(Zou et al.,2011),初步揭示了三峡地区特殊的地震活动特征和复杂的地壳结构.本文试图以三峡地区为例介绍虚震源成像方法的原理和关键步骤,并以此揭示三峡地区上地壳地震反射结构,再用正演模拟测试虚震源成像中的多地震事件叠加和地震频率选取对成像效果的影响. 2 方法原理
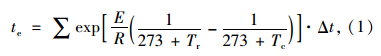
虚震源成像与垂直分量接收函数方法的原理一 致(Yu and Schuster,2001; Langston and Hammer,2001; Tseng and Chen,2006; Yang et al.,2012).图 1给出了Moho面和地壳内深度为d的反射界面虚震源成像的射线路径.在远震波形到达地表自由界面后产生全反射,反射点被视作新的震源,称之为“虚震源”(virtual source).在反射点接收到的远震初至波被称为震源子波,远震初至波到达地面前受到的扰动(例如地幔速度沿射线路径的变化)均被包含在震源子波中.图 1中实线表示地震波从虚震源向地下传播并被台站下的界面反射,其反射波被地表检波器接收.最终到达检波器的信号(SPPdP)可以看做是反射前的地震信号(震源子波,S)与地壳反射结构(即接收函数,RF)的卷积,如公式(1)所示:
 | 图 1 虚震源成像射线路径示意图.带箭头的虚线和实线分别代表直达波和反射波射线路径.PPmp和PPdp分别代表Moho面反射波和地壳内深度为d的 反射界面的反射波.沿地表三角代表台站Fig. 1 Raypaths of teleseismic crustal reflection waves. The dashed and solid lines represent the raypaths of direct and reflection waves,respectively. PPmp and PPdp denote the seismic waves reflected from the Moho and another interface at depth d,respectively. Triangles represent stations |
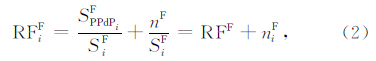
虚震源成像利用反褶积将震源子波从地震记录中剔除,然后重构台网下的地震反射结构.对于一个单独的台站,其接收到的第i个远震事件在频率域反褶积得到垂直接收函数的操作可以用公式(2)表示:

由于虚震源成像利用自由界面反射波成像,其成像中的负振幅极性表示界面下层地质体为高速体,而正极性表示界面下层地质体为低速体.归纳起来,虚震源成像有以下六个基本步骤:
(1)根据震中距和震源深度筛选地震事件.
(2)进行滤波、道筛选等预处理.
(3)用互相关排齐各道数据,平均各道数据获得震源子波.
(4)利用反褶积从各道中剔除震源子波影响,求取单道接收函数.
(5)对接收函数做低通滤波.
(6)叠加不同地震事件的虚震源成像剖面,压制噪音.
地震事件的选择对虚震源成像至关重要.震中距一般选择在在30°至80°的震中距范围内,以避免多次直达波和核幔边界反射波(PcP)的干扰(Tseng and Chen,2006; Yang et al.,2012).远震震源深度可以根据不同的需要进行筛选,主要取决于研究 的深度范围.原则上远震震源深度要比虚震源成像 研究的目标体深,如此可避免震源地区自由界面反射波的影响.为了研究Moho面,Tseng和Chen选择震源的深度大于100 km(Tseng and Chen,2006).然而,对于上地壳的反射界面,Yang等选择的最浅地震在43 km(Yang et al.,2012).由于本文目标界面浅于10 km,所选择的震源最浅为27 km.
重构震源信号是虚震源成像的关键一步.远震的直达波在台站附近较小的研究区域可以被视作平面波,具有较一致的震源信号.然而,在地震波传播至近地表时由于上地壳速度的横向不均匀和地表起伏造成了散射和到时延迟等问题,这些问题造成了远震直达波在各个台站具有不一致的波形和到时.排齐并平均各台站的初至波信号可以消减波形不一致性,利于重构震源信号(Li and Nábělek,1999; Langston and Hammer,2001; Tseng and Chen,2006; Yang et al.,2012).下文将通过正演模拟评估重构震源信号的效果. 3 三峡地区虚震源成像 3.1 临时台网布设与数据采集
三峡地区临时台网分布如图 2所示.图中不同背景颜色区域表示不同地质单元,其中秭归盆地和黄陵背斜是此次采集所针对的目标地质体.临时地震台网布设时间是2011年6月初至7月初.临时台网共有43个台站,主要布设在长江北岸,横跨巴东、秭归、兴山和宜昌夷陵区四个县市.地震仪选用的是TEXAN(RefTek 125A)和4.5 Hz检波器(GS11)组合.图 2中的青蓝色实线所包含的29个台站被抽 出构建二维剖面,台站平均间隔为3 km.测线覆盖 了黄陵背斜的西侧,并横跨秭归盆地,以使地震反射剖面能够反映秭归盆地与四川盆地在上地壳的接触关系.
 | 图 2 三峡临时台网分布.地质构造图修改自程裕淇(2002).图中黑色圆点表示43个临时台站的位置;绿色方框包括了用于虚震源成像的29个台站;黑色五角星表示测线计算距离的原点;红线表示断层;不同颜色区域标识不同地 质年代的单元;粉色圆点表示主要城市Fig. 2 Distribution of our 43 temporary seismic stations(black circles)in the TG region. This geological map is modified after Cheng(2002). The 29 stations within the green rectangle are selected to construct the TVR profile. The distances to the stations,as being referenced in later sections,are with respect to the origin which is denoted by the star. The red curves with names denote major faults. Ages of major geologic units are shown in color. Major cities are labeled with pink dots |
此次采集共记录到大约40个M5.5以上震级的地震(地震信息参考USGS地震事件列表).根据上文列出的地震事件筛选条件共有4个地震事件符合虚震源成像要求,所选取地震事件的信息见表 1.
| | 表 1 地震事件参数(根据USGS地震资料制表) Table 1 Parameters of selected earthquakes(according to USGS earthquake catalog) |
经过去除仪器响应和0.3~2 Hz带通滤波后,表 1中的地震事件2的地震记录如图 3a所示.初步研究表明TEXAN与4.5 Hz检波器组合可以有效记录0.3 Hz的远震信息(Zou et al.,2010),因此实际数据被施加了最低频率为0.3 Hz的高通滤波.图 3a地震波形右侧显示了通过平均各道资料获得的地震子波波形(黑色实线)与各道波形(灰色实线)的对比,平均获得的子波波形明显简单于接收到的地震信号,表明近地表散射对地震子波有很明显的改造.图 3b是表 1中所有4个远震事件虚震源成像的叠加剖面.虚震源成像采用了时间域迭代反褶积(Ligorría and Ammon,1999).为加强水平向地震反射的连续性和提高解释的准确性,反褶积结果经过了1 Hz高斯滤波,并对成像剖面做了三道平均,即将临近的两道数据与当前道相加后除以3(Yang et al.,2012).三峡地区上地壳的平均速度接近 5.5 km·s-1(Zhang et al.,2009; Zhou et al.,2010),鉴于本文研究的深度范围小于10km,一维速度模 型对成像结果的影响较小,因此本文采用5.5 km·s-1 将时间转化为深度.鉴于三峡地区的速度横向有比较明显变化,进一步的研究需要对成像剖面进行偏移并使用二维地震速度模型,以获得高精度反射地震剖面.
 | 图 3 三峡地区虚震源成像
(a)上方是沿测线高程(单位:km),下方是事件2的地震数据,其右侧小图是数据的水平叠加;(b)四个地震虚震源成像结果的叠加;(c)对虚震源成像的解释;(d)航磁反演得到的结晶基底深度(陈学波,1994).GQF:高桥断裂.XNSF:仙女山断裂.红色五角星代表2013年12月巴东5.1级地震在剖面中的投影位置(数据来源:中国地震信息网http://www.csi.ac.cn/). Fig. 3 TVR profile beneath the TG region (a)The upper curve shows the topography along the profile. Waveform data of Event 2. The instrument response was removed from the raw data and then a 0.3~2 Hz b and -pass filter was applied. A horizontal stack of the seismic traces is shown on the right. The gray background curves are the overlapped traces of all channels.(b)The stacked virtual source reflection profile of all four teleseismic events.(c)The same profile as that in panel(b)with interpretation of interfaces and major faults.(d)Interpreted basement geometry from inversion of aerial magnetic data(Chen X B,1994). The names of the major city and the geological unit were labeled on top of(c). GQF and XNSF represent Gaoqiao Fault and Xiannüshan Fault,respectively. Red star represents the projected location of the magnitude 5.1 earthquake occurred in Badong in Dec.,2013(data according to http://www.csi.ac.cn/) |
三峡地区处于四川盆地边缘,GPS测量显示四川盆地有东移的趋势(Wang et al.,2001),上地壳的推覆构造显示此地区经历了强烈挤压(Liu et al.,2012),因此解释中参照了推覆体演化的实验室模拟结果(Malavieille,2010).根据与地质模型的对比,图 3c显示了对图 3b的解释.解释中使用的不同颜色的实线为不同地质单元的底界面,虚线表示推测的界面延伸或者地质体内部结构.
图 3c解释结果中,测线东南部的地震反射结构明显比西北部的结构简单.图 2中测线经过的地表地质结构显示,测线东南部是黄陵背斜,侵入体可能在上地壳比较连续,因此具有较简单的结构.而测线西北段位于四川盆地东缘,具有不同时期的沉积层,在经历四川盆地东移的挤压后其构造可能变得更加 复杂.对比测线与地表地质单元分布(图 2),图 3c 中的青色实线与秭归盆地的地表位置相对应,本文推测青色实线可能表示秭归盆地的底界面,这与层析成像反演得到的浅层低速沉积盆地的底界面较一致(Zhang et al.,2009; Zhou et al.,2010).四川盆地东缘在三峡地区表现为大面积的碳酸盐岩沉积.不同于四川盆地,秭归盆地内为侏罗纪的陆源碎屑沉积(渠洪杰等,2009),本文推测秭归盆地的底界面是陆源沉积与碳酸盐沉积的交界面.绿色实线处于四川盆地下方,有可能是四川盆地东缘内的一套沉积层的底面.绿色界面在测线西北部、巴东西侧存在强烈褶皱,这可能是四川盆地东移时上地壳受挤压形成的背斜构造.这个构造与其南部的古生界露头和地表线性褶皱带相对应(图 2),褶皱带的位置恰与其上部地表的高桥断裂带线性对应.本文推测此褶皱带有可能贯穿至地表,产生高桥断裂带.如果假设被验证,那么高桥断裂带很有可能达到5 km深的界面或者穿透此界面向更深处延伸.高桥断裂在三峡水库蓄水后小地震活动频率上升较明显,很可能与此褶皱带的活动有关.图 3c中红色五角星代表2013年12月16日发生的5.1级地震(坐标31.1°E,110.4°N,深度5 km,数据来源:中国地震信息网).在成像剖面上的投影位置表明此地震恰处于褶皱带中,因此推测此地震与褶皱带在背景应力场作用下的活动有关.由于未知此地震的震源机制,本文并不尝试解释此地震与高桥断裂的关系.结合进一步的地震震源机制研究和高精度地震定位将有可能建立高桥断裂带附近的地震与本文发现的高桥断裂下部褶皱之间的关系.
图 3c中的红色实线和虚线解释为四川盆地的下底面,正极性代表的低速带有可能是四川盆地受构造运动控制向东挤压、平移过程中在其下层及基岩(蓝色实线)中形成的滑脱破碎带.四川盆地的底界面在测线西北部的深度大约为6.5 km,这与四川盆地东部的地震反射剖面得到的6 km基本一致(Liu et al.,2012),也与本地区层析成像在6.5 km深度的高速度梯度对应(Li et al.,2009; Mei et al.,2013).在秭归盆地下部,图 3c中解释的红线亦与图 3d中航磁反演得到的结晶基底的深度相对应,但测线西北部的成像结果与航磁反演结果不一致.这种不一致可能是不同岩层岩性变化和褶皱作用的综合结果.图 3c中黄色虚线标出了两套正极性反射界面,由于正极性代表速度在反射界面出现反转,因此推测黄陵背斜下部可能存在两个低速层,但由于黄陵背斜位于测线的边缘,黄陵背斜并未被测线完全覆盖,其成像结果的解释还需要更多数据来印证和解释.
为验证虚震源成像的可靠性,我们将解释的反射界面投影到地震层析成像反演得到的速度剖面(Zhou et al.,2010),如图 4所示.对比表明,本文解释的秭归盆地与地震层析成像的结果较一致,但层析成像剖面并无法给出本文解释的5 km 深的反射界面.这可能是由于层析成像的台站数较少、地震-台站间偏移距较小和近地表高速度梯度有关.进一步提高速度结构精度将有助于对三峡地区的上地壳结构作进一步的解释.
 | 图 4 解释界面与层析成像剖面结果对比.黑色实线和虚线代表基于虚震源成像剖面解释的底层界面.剖面上部标出了主要地质单元、断层和城市Fig. 4 Comparison of some interpreted reflectors(solid and dashed lines in black color) and the tomographic velocity on the profile. Major geologic units,faults and cities are labeled above the profile |
本文根据实际数据的虚震源成像结果(图 3和图 4)建立了简化的速度模型(如图 5所示),以弹性波正演模拟测试虚震源成像对不同界面倾角、界面垂直间距和界面速度跳变的响应,用于测试虚震源 成像的效果和分辨率.模型中近地表 60~80 km距 离范围的深蓝色区域代表秭归盆地,速度为5 km·s-1. 近地表 20~70 km距离范围的浅蓝色区域表示低速的沉积层,速度为5.5 km·s-1.红色背景速度为6.2 km·s-1.图 3c中解释的由红色和黄色虚、实线代表的低速层在建立的模型中由嵌入的速度扰动为5%的两套低速层代表,厚度均选择为0.8 km.选择的速度和深度主要用于测试虚震源成像的分辨率和对低速界面的敏感度.地震数据通过虚谱法弹性波数值模拟(Kosloff et al.,1984)算得,并在进行虚震源成像前加入了10%的白噪.正演模拟的输入地震波是平面波,时间子波采用主频2 Hz的Ricker子波.按照背景速度6.2 km·s-1计算,2 Hz地震波波长为3.1 km,0.8 km接近于1/4波长,因此本文测试虚震源成像对厚度为1/4波长的低速层的分辨能力.平面波的传播方向由事件2和事件3的射线参数(根据IASP91模型算得)来控制.
 | 图 5 纵波速度模型.色标代表地震波速度值(单位:km·s-1)Fig. 5 P-wave velocity model. Colour bar shows the velocity scale(unit: km·s-1) |
图 6对比了2 Hz理论震源信号与重构的震源信号.由图 6可见,平均直达波求取的震源信号与理论震源信号吻合较好.
 | 图 6 重构地震子波
红色粗虚线为输入地震子波,背景的黑色粗实线为重构的地震子波;细实线代表台站记录到的地震初至波.平均得到的地震子波振幅被平移了0.5,以体现平均地震波的效果. Fig. 6 Constructed source wavelet by averaging all traces Black and red-dashed curves,respectively,represent the recovered and the true source wavelets; the relative amplitudes are shifted by 0.5 for clarity. The thin color lines centered at 0 are overlapping display of all the data traces. |
图 7是正演数据的远震虚震源成像结果.图 7a和7b分别模拟了表 1中事件2和事件3的虚震源成像结果.图 7c是两个事件虚震源成像的叠加平均.正演结果显示,由于噪音的干扰,使用单独地震 事件的虚震源成像剖面中反射界面不够连续.将不同事件的成像剖面叠加后,界面的成像效果明显改善.由图 7c可见,第一层界面在65~80 km距离范围处的成像不够清晰,这与实际数据成像的图 3d中的红色虚线所在区域相对应,表明虚震源成像对此范围内接近地表的倾斜界面成像能力有限.为进一步完善成像效果,需要更多不同震中距的远震事件的叠加.在图 7c中,低速层的上、下界面也得到了较好成像,这表明2 Hz的远震波形可以被用作分辨0.8 km厚的低速层.因此图 3c中实际数据成像的黄陵背斜内部的反射结构很有可能是真实的反射结构.如果辅以黄陵背斜东部数据,这些反射结构的地质含义可能会更加明显.
 | 图 7 虚震源成像的正演测试.(a)和(b)分别是表 1中事件2和事件3的成像结果.(c)为(a)和(b)的叠加 Fig. 7 Synthetic TVR images for teleseismic events No.2(a) and No.3(b).(c)shows the stack of panels(b) and (c) |
虚震源成像的效果与选取的地震子波的长度直接相关(Yang et al.,2012).控制地震子波长度的因素很多,通常震级越高震源子波的长度越长,地震波频率越低(Clinton and Heaton,2002).因此本文利用正演模拟测试了地震子波频率对虚震源成像效果的影响.图 8显示了利用不同主频地震子波正演后获得的虚震源成像剖面,震源平面波选用表 1中地震事件2的射线参数.为单独测试震源主频对虚震源成像的影响,输入数据没有加噪音.
 | 图 8 地震频率对虚震源成像效果的影响
震源子波频率分别为(a)2 Hz;(b)0.8 Hz;(c)0.2 Hz.Fig. 8 Influence of central frequency of source wavelet on the TVR imaging Central frequency of the source wavelets are(a)2 Hz;(b)0.8 Hz;(c)0.2 Hz. |
图 8中从上至下分别采用了2 Hz,0.8 Hz,和0.2 Hz的震源子波.虚震源成像的结果表明,2 Hz子波的成像分辨率最高,成像的位置和振幅极性都与真实模型基本符合.成像位置的差异主要是由于采用了速度5.5 km·s-1将时间转换为深度,而其深部的速度均大于5.5 km·s-1所致.随着地震子波频率的降低,成像界面的位置开始发生位移,并且反褶积也产生了更多噪音.图 8c显示,使用0.2 Hz频率震源子波时虚震源成像无法获得上地壳浅于10 km的反射结构.造成成像效果随频率降低而变差的一个原因可能是由于低频没有足够的分辨率对浅部界面成像.为显示不同频率的分辨率,本文使用2 Hz、0.8 Hz和0.2 Hz 地震子波测试了不同频率情况下时间域迭代反褶积对具有4 km和8 km深的两个界面的一维模型的成像效果,如图 9所示.结果显示,2 Hz和8 Hz可以较好地成像反射界面,然而0.2 Hz却无法对两个界面成像,并会在两个界面之间产生虚假成像.
 | 图 9 不同频率地震子波对反褶积成像分辨率的影响
(a)—(c)显示了一维速度模型的合成地震数据(蓝线)和地震子波(红线);(d)—(f)对比了真实模型及相应的反褶积成像结果,其中蓝线为真实模型,红线为成像结果. Fig. 9 The influence of frequency content of source wavelet on resolution (a)—(c)show source wavelet(red) and the synthetic reflection data(blue)for the 1-D velocity model.(d)—(f)compare the deconvolution results(red lines)with the true model(blue lines). |
理论上高频地震子波具有短的子波周期,因此 具有较高的分辨率.但利用高频成像时必须考虑地震速度随深度平缓过度的速度界面和背景噪音.如果地震波速度在地质界面附件是平缓过渡,而非突然间断,那么在界面处高频地震波不会产生强的反射能量,而低频地震波则有可能产生一定的反射能量.另外,高频噪音对地震记录的影响也较为明显.图 10给出了秭归盆地中心的一个台站背景噪音与地震事件记录的频谱对比.频谱对比显示,背景噪音在3 Hz以上占据了地震记录的频谱,导致远震记录的信噪比较低.我们推测,这种信噪比关系一方面是由于人为活动和背景的水系活动产生的高频噪音比较严重,另一方面也与远震的高频信号损失严重有关.初步的研究表明,反褶积对信噪比要求比较高(与德克萨斯理工大学Harold Gurrola的个人交流),因此在三峡实际数据成像前需要将高于2 Hz的地震数据频率滤掉以提高信噪比.对于其他相似地区以上频率筛选标准分析也应当适用.
 | 图 10(a)三峡库区秭归盆地中一台站的地震记录.地震事件为表 1中的事件3.灰色虚线为选择的背景噪音与地震信号的分界.振幅为最大振幅归一化后的相对振幅.(b)振幅谱对比.Spectrum-1代表包含地震 事件的地震记录(图版a中400~800 s)的傅里叶振幅谱;Spectrum-2代表不包含地震事件的背景噪音(图版a中0~400 s)的傅里叶振幅谱.垂直虚线代表3 Hz的位置Fig. 10(a)Seismic record of a station in the middle of the Zigui Basin. The earthquake is Event 3 in Table 1. The gray dashed line indicates the time we divide the background noise and the seismic record of earthquakes. The amplitude has been normalized by dividing its maximum amplitude.(b)Spectral comparison of the data in panel(a). Spectrum-1 represents the Fourier spectrum of the seismic events(400~800 s)in panel(a). Spectrum-2 represents the Fourier amplitude spectrum of the background noise(0~400 s)in panel(a). The vertical dashed line shows the location of 3 Hz |
本文介绍了虚震源成像的基本原理和步骤,并将此方法应用到三峡地区,利用四个远震的反射地震波资料建立了一条近东西向的三峡地区上地壳反射地震剖面.通过与地表地质单元的对比,在深度剖面上解释了秭归盆地和四川盆地的底界面接触关 系.发现秭归盆地沉积层西薄东厚,最大厚度2.6 km; 剖面之下四川盆地基底从西侧巴东县的6.5 km深度向东逐渐变浅,直至在黄陵背斜西侧出露于地表.虚震源成像剖面还显示四川盆地基底面附近可能存在一个低速层;作者推测此低速层对应于层析成像 中的速度梯度突变带,是四川盆地受构造运动东移过程中在其下层及结晶基岩中形成的破碎带.该假设需要更多的地质和地球物理数据来验证.
正演模拟结果证实了利用远震在台网下方的界面反射波资料进行壳幔结构成像的可行性.结果显示,通过叠加不同远震的虚震源成像可以明显改善成像剖面的质量.对地震波频率与虚震源成像效果的分析表明,上地壳虚震源成像需要选择特定频率的地震子波,震源频率过低不利于上地壳成像.
致谢 感谢德克萨斯理工大学(Texas Tech University)的Harold Gurrola副教授在本文完成中的积极协助与讨论.感谢两位审稿人提出的宝贵意见.| [1] | Chen X B. 1994. The Research on Characteristics of the Deep Tectonics in Three Gorges and Nearby Area (in Chinese). Beijing: Seismological Press. |
| [2] | Cheng Y Q. 2002. Geologic Map of China (1:5000000) (in Chinese). Beijing: Geological Publishing House. |
| [3] | Clinton J F, Heaton T H. 2002. Potential advantages of a strong-motion velocity meter over a strong-motion accelerometer. Seismological Research Letters, 73(3): 332-342. |
| [4] | Hu J M, Chen H, Qu H L, et al. 2012. Mesozoic deformations of the Dabashan in the southern Qinling orogen, central China. J. Asian Earth Sci., 47: 171-184. |
| [5] | Hu S B, Raza A, Min K, et al. 2006. Late Mesozoic and Cenozoic thermotectonic evolution along a transect from the north China craton through the Qinling orogen into the Yangtze craton, central China. Tectonics, 25(6): TC6009, doi: 10.1029/2006TC001985. |
| [6] | Kosloff D, Reshef M, Loewenthal D. 1984. Elastic wave calculations by the Fourier method. Bull. Seism. Soc. Am., 74(3): 875-891. |
| [7] | Langston C A. 2001. The vertical component P-wave receiver function. Bull. Seismol. Soc. Am., 91(6): 1805-1819, doi: 10.1785/0120000225. |
| [8] | Li Q, Zhao X, Cai J A, et al. 2009. P wave velocity structure of supper and middle crust beneath the three gorges reservoir dam and adjacent regions. Sci. China Ser. D: Earth Sci., 52(4): 567-578. |
| [9] | Li X Q, Nábělek J L. 1999. Deconvolution of teleseismic body waves for enhancing structure beneath a seismometer array. Bull. Seismol. Soc. Am., 89(1): 190-201. |
| [10] | Liao W, Zhang L, Yao Y. 2009. Characteristics of seismicity in the Three Gorges reservoir area. Seismology and Geology (in Chinese), 31(4): 707-714. |
| [11] | Liao W, Yao Y, Ding Z, et al. 2007. Tomographic imagery of P-wave velocity structure in Three Gorges region. Journal of Geodesy and Geodynamics (in Chinese), 27(3): 80-84. |
| [12] | Ligorría J P, Ammon C J. 1999. Iterative deconvolution of teleseismic seismograms and receiver-function estimation. Bull. Seismol. Soc. Am., 89(5): 1395-1400. |
| [13] | Liu S G, Deng B, Li Z W, et al. 2012. Architecture of basin-mountain systems and their influences on gas distribution: A case study from the Sichuan basin, South China. J. Asian Earth Sci., 47: 204-215. |
| [14] | Malavieille J. 2010. Impact of erosion, sedimentation, and structural heritage on the structure and kinematics of orogenic wedges: Analog models and case studies. GSA Today, 20(1): 4-10, doi: . |
| [15] | Mei B, Xu Y, Zhang Y. 2013. P- and S-velocity structure beneath the Three Gorges region (central China) from local earthquake tomography. Geophys. J. Int., 193(2): 1035-1049. |
| [16] | Qu H, Hu J, Cui J, et al. 2009. Jurassic sedimentary filling process of Zigui Basin in the eastern section of Daba Mountain tectonic belt and its structural evolution. Acta Geologica Sinica (in Chinese), 83(9): 1255-1268. |
| [17] | Shen C, Li A, Gan J. 1990. Airborne magnetic anomaly and seismic activity in the Three-Gorge region, west of Hubei Province. South China J. Seismol. (in Chinese), 10(2): 62-67. |
| [18] | Shen C, Mei L, Liu Z, et al. 2009. Apatite and zircon fission track data, evidences for the Mesozoic-Cenozoic uplift of Huangling Dome, central China. J. Mineral. Petrol., 29(2): 54-60. |
| [19] | Tseng T L, Chen W P. 2006. Probing the Southern Indian Shield with P-wave receiver-function profiles. Bull. Seismol. Soc. Am., 96(1): 328-333, doi: 10.1785/0120050074. |
| [20] | Tseng T L, Chen W P, Nowack R L. 2009. Northward thinning of Tibetan crust revealed by virtual seismic profiles. Geophys. Res. Lett., 36(24): L24304, doi: 10.1029/2009GL040457. |
| [21] | Vernhet E, Reijmer J G. 2010. Sedimentary evolution of the Ediacaran Yangtze platform shelf (Hubei and Hunan provinces, Central China). Sedimentary Geology, 225(3-4): 99-115. |
| [22] | Wang Q, Zhang P Z, Freymueller J T, et al. 2001. Present-day crustal deformation in China constrained by global positioning system measurements. Science, 294(5542): 574-577. |
| [23] | Wang S, Zhu S, Li R. 1992. Three dimensional inversion of gravity anomalies in the region of Three Gorges, the Yangtze River. Acta Geophys. Sinica (in Chinese), 35(1): 69-76. |
| [24] | Xia J W, Li C G, Zeng X P, et al. 2008. Study on characteristics and seismic activity of Gaoqiao Fault in head area of Three Gorges Reservoir. Journal of Geodesy and Geodynamics (in Chinese), 28(2): 8-15. |
| [25] | Xiong C Y, Wei C S, Jin G F, et al. 2004. Pre-Sinian paleostructural framework and major geological events in the Huangling anticline, Western Hubei. J. Geomech. (in Chinese), 10(2): 97-112. |
| [26] | Yang Z H, Sheehan A F, Yeck W L, et al. 2012. Imaging basin structure with teleseismic virtual source reflection profiles. Geophys. Res. Lett., 39(2): L02303, doi: 10.1029/2011GL050035. |
| [27] | Yu J, Schuster G T. 2001. Crosscorrelogram migration of IVSPWD data. // paper presented at 71st Annual International Meeting. Soc. of Explor. Geophys., San Antonio, TX. |
| [28] | Zhang Z J, Bai Z M, Mooney W, et al. 2009. Crustal structure across the Three Gorges area of the Yangtze platform, central China, from seismic refraction/wide-angle reflection data. Tectonophysics, 475(3-4): 423-437, doi: 10.1016/j.tecto.2009.05.022. |
| [29] | Zhou H W, Zou Z H, Yao Y S, et al. 2010. Mapping seismic velocities beneath the Yangtze Three Gorges Reservoir. Western Pacific Geophysical Meeting. Taipei, Taiwan. |
| [30] | Zou Z H, Zhou H W, Jiang F, et al. 2010. Assessing the reliability of low frequencies in geophone records. // Paper presented at 80th Annual International Meeting, Soc. of Explor. Geophys., Denver, CO. |
| [31] | Zou Z H, Zhou H W, Liao W L. 2011. Crustal and upper-mantle seismic reflectors beneath the Three Gorges Reservoir region. Journal of Earth Science, 22(2): 205-213, doi: 10.1007/s12583-011-0173-x. |
| [32] | Zou Z H, Zhou H W, Gurrola H. 2014. Reverse-time imaging of a doublet of microearthquakes in the Three Gorges Reservoir region. Geophys. J. Int., 196(3): 1858-1868, doi: 10.1093/gji/ggt499. |
| [33] | 陈学波. 1994. 长江三峡工程坝区及外围深部构造特征研究. 北京: 地震出版社. |
| [34] | 程裕淇. 2002. 中国地质图(1∶5000000). 北京: 地质出版社. |
| [35] | 廖武林, 张丽芬, 姚运生. 2009. 三峡水库地震活动特征研究. 地震地质, 31(4): 707-714. |
| [36] | 廖武林, 姚运生, 丁志峰等. 2007. 三峡地区P波速度层析成像研究. 大地测量与地球动力学, 27(3): 80-84. |
| [37] | 渠洪杰, 胡健民, 崔建军等. 2009. 大巴山构造带东段秭归盆地侏罗纪沉积充填过程及其构造演化. 地质学报, 83(9): 1255-1268. |
| [38] | 沈传波, 梅廉夫, 刘昭茜等. 2009. 黄陵隆起中-新生代隆升作用的裂变径迹证据. 矿物岩石, 29(2): 54-60. |
| [39] | 申重阳, 李安然, 甘家思. 1990. 鄂西三峡地区航磁异常与地震活动. 华南地震, 10(2): 62-67. |
| [40] | 王石任, 朱思林, 李蓉. 1992. 长江三峡地区三维重力反演研究. 地球物理学报, 35(1): 69-76. |
| [41] | 夏金梧, 李长安, 曾新平等. 2008. 三峡工程库首区高桥断裂特征与地震活动性研究. 大地测量与地球动力学, 28(2): 8-15. |
| [42] | 熊成云, 韦昌山, 金光富等. 2004. 鄂西黄陵背斜地区前南华纪古构造格架及主要地质事件. 地质力学学报, 10(2): 97-112. |