2. 深圳大学, 深圳 518060;
3. 中国石油大学(华东), 青岛 266580
2. Shenzhen University, Shenzhen 518060, China;
3. China University of Petroleum (East China), Qingdao 266580, China
The method of joint inversion was used to analyze the spatial characteristic of the coseismic slip distribution and to infer the possible causative source fault of the 2015 Nepal earthquake. We collected the Sentinel-1A data immediately after the mainshock and processed them using the GAMMA software. Besides, the relevant ALOS-2 and GPS data were also collected. The quadtree sampling method was then used to resample the InSAR deformation results. In order to obtain a robust result and to reduce the uncertainties of the inversion, initial parameters for the fault were assigned according to focal mechanisms from Global CMT, USGS and GFZ.
(1) The coseismic deformation field derived from geodetic data shows that the Nepal MW7.9 event is mainly distributed within a 150 km long and 100 km wide range, with two peak deformation centers aligned close to each other in north-south direction reaching about 1.2 m and about 0.8 m, respectively, and both of which are located on the hanging wall side, demonstrating a low-angle thrust. The InSAR results confirm that the surface trace of the causative source fault coincides with the MBT. Two GPS stations, namely KKN4 and NAST, about 80 km away from the epicenter on the hanging wall side, have peak displacements over 1 m. However, GPS stations at the far field decay very rapidly, which only have about 1 cm of coseismic displacements in both horizontal and vertical directions.(2) Based on the sensitivity iterative fitting method, a satisfactory fit to the GPS offsets and the InSAR displacements were achieved. Residuals for the ALOS-2 are between -10 cm and 10 cm, while residuals for the Sentinel-1A data are within -15 cm and 15 cm. Discrepancies arise from different coherences for C and L bands. Offsets for the GPS sites near the epicenter region are fitted well.However, sites away from the epicenter region have relatively poorer fitting especially in the vertical direction, which may be associated with the poor accuracy in GPS vertical measurements.(3) The inverted slip dislocations on the fault are mainly distributed in 150 km along strike and 70 km along down-dip direction. The maximum slip inverted reaches 5.59 m and the average is 0.94 m. The inverted dip angle of the fault model is 7°at shallow depth and 12° at deeper depth of 20 km. Results also show that with depth increasing, the dips of the causative fault increase as well, indicating reverse-listric shape of the fault. Slip more than 4 m is mainly concentrated between depths of 8 km and 10 km. Aftershocks are mainly distributed around the main rupture zone. The MW7.2 aftershock on May 12, 2015 struck the slip deficit region left by the Nepal mainshock, which precisely filled the rupture gap.
The coseismic deformation field was derived for the Nepal earthquake and based on which the fault spatial slip distribution and the spatial characteristic of the coseismic slip distribution were inverted. The Nepal event ruptured a segment 50~60 km north of the MBT and at depth 8~9 km with an average dip angle of 9°, which, if projected onto the surface, is well aligned with the previously mapped fault MBT. And further north the Nepal rupture segment merges with MHT at depth of 18~20 km.We envision that the Nepal event has ruptured a segment of the MBT, which could be the causative fault.
2015年4月25日,尼泊尔发生MS8.1地震,据中国地震台网测定,此次地震震中(北纬28.2°,东经84.7°)位于加德满都西北80 km处,处于印度—欧亚大陆主碰撞带的前沿部位.地震发生后,Global CMT、USGS、GFZ、中国地震局等不同研究机构给出了该地震的震源机制解结果,结果显示节面特征较为接近.根据震源机制解,结合德国科学研究中心GFZ(http://geofon.gfz-potsdam.de)给出的余震分布所显示出的断层走向由西向东南迁移这一特征,初步判断此次地震发震断层走向为北西西,且为一次具有极缓倾角的逆冲型地震事件(图 1).Global CMT给出的发震断层参数为走向293°,倾角 7°,滑动角108°,矩震级为MW7.9,震源深度15 km.尼泊尔处于印度—欧亚板块的俯冲碰撞带上,印度板块以约40 mm·a-1的速度向北与欧亚板块会聚,造成喜马拉雅山脉的隆起(Bilham et al.,1997),形成了长达2500 km的喜马拉雅构造带,该带是能量集聚和释放比较活跃的地区.从历史地震看,在该地震活动带已经发生了若干次8级以上地震,早年有记录的大地震有1505年尼泊尔格尔纳利河8.2级地震,1897年不丹MW8.1地震,1905年印度8.0级地震,1934年尼泊尔比哈尔邦8.1级地震,以及1950年中国察隅8.6级地震.此次地震发生在1934年比哈尔邦8.1地震与1505年格尔纳利河8.2地震中间的空段上.实际上,许多科学家研究表明(Feldl and Bilham,2006;Ader et al.,2012),这次地震的发生是该段长期应力聚集的结果,发生地震实属必然.
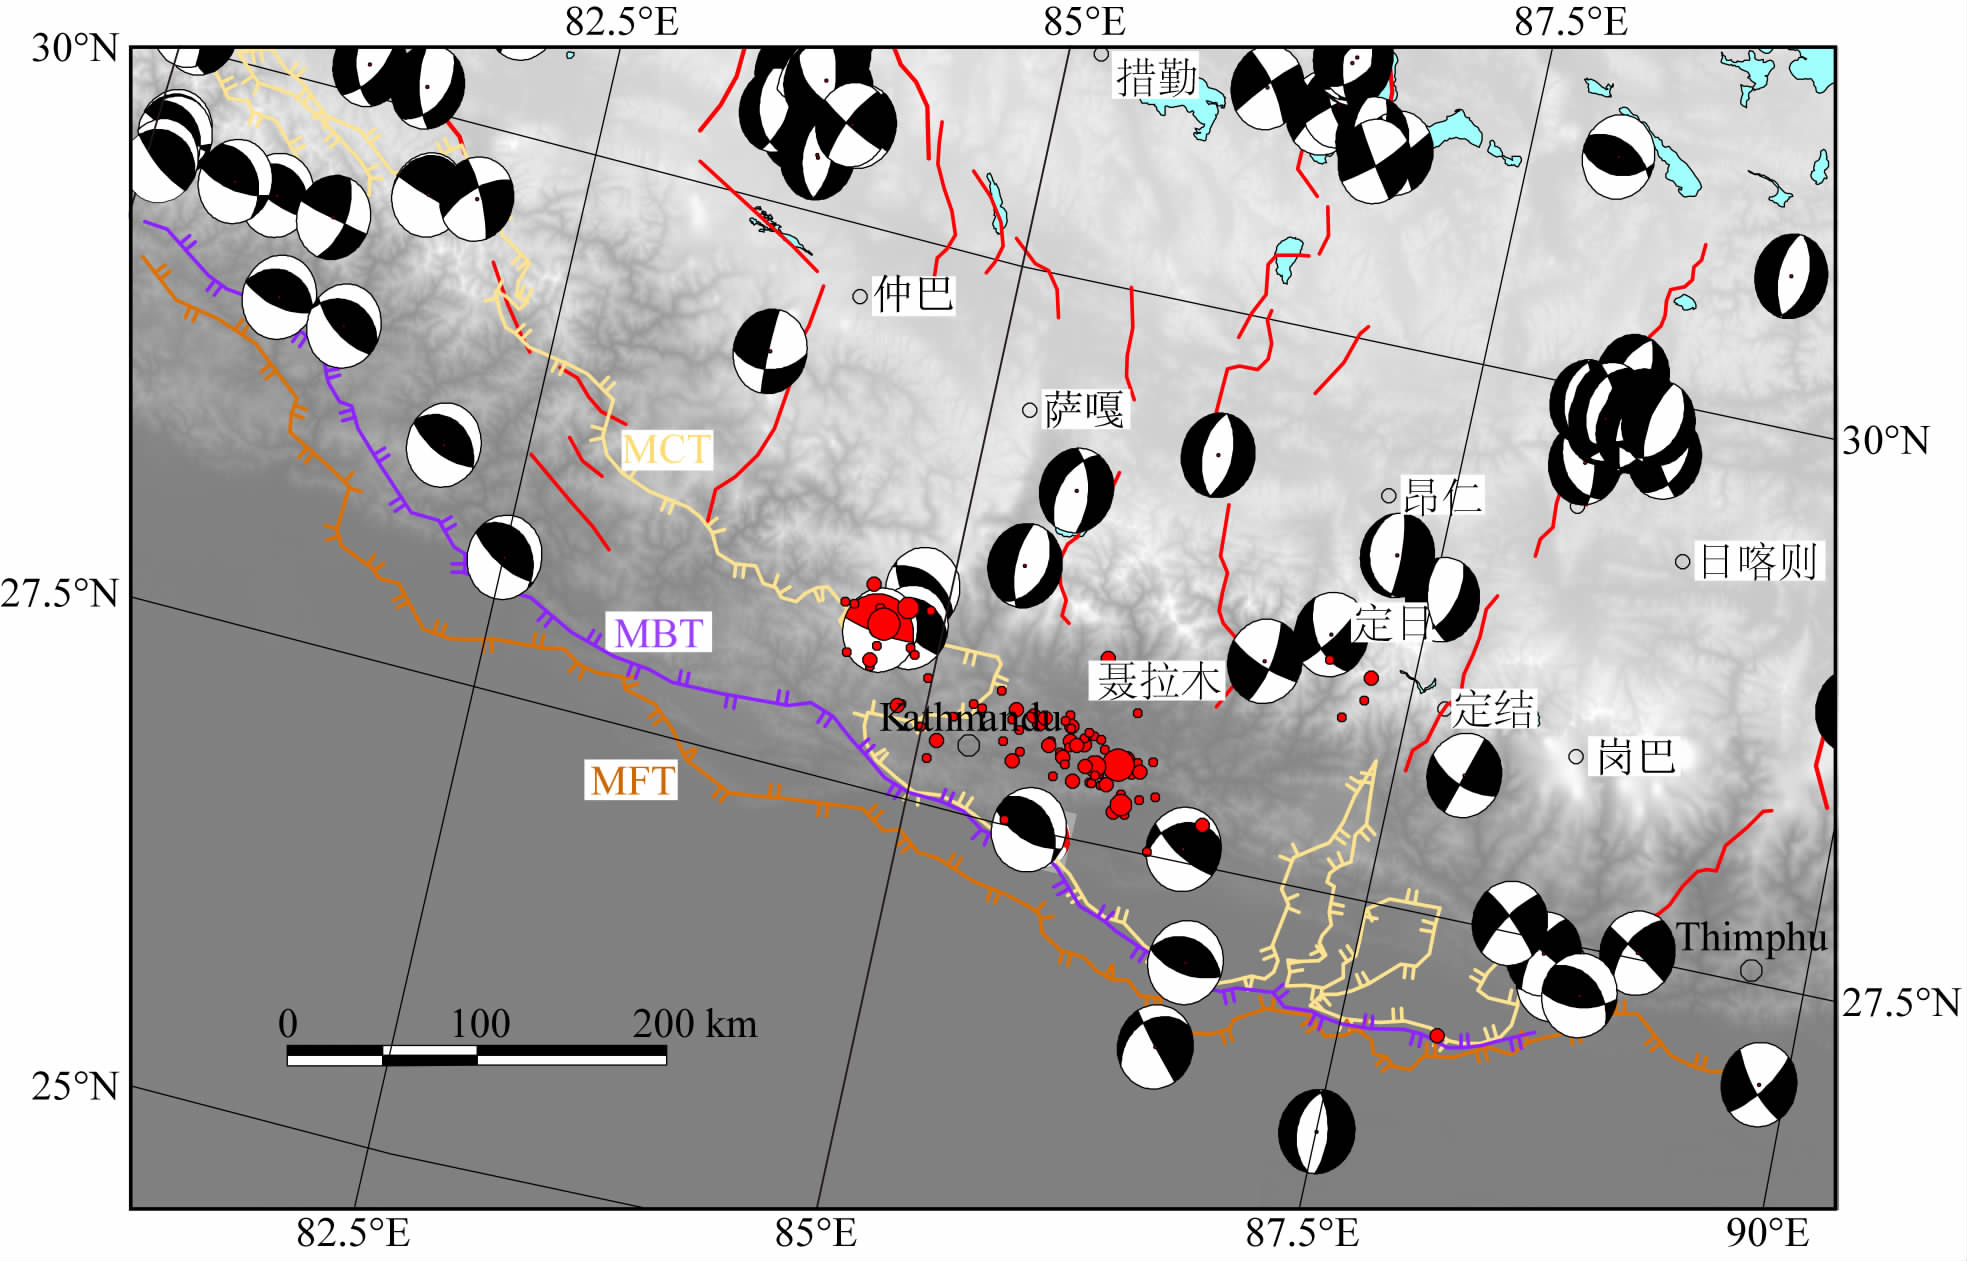 | 图 1 喜马拉雅构造带中段地震构造及地震分布 沙滩球为Global CMT 1975—2015年震源机制解,其中红色为尼泊尔8.1级地震震源机制解;红色实心圈为GFZ 4月25日—6月26日余震分布;棕色、蓝色和黄色粗线分别表示MFT、MBT和MCT位置;红色细线表示活动断裂. Fig. 1 Tectonic setting and historical earthquakes in the central Himalaya Beach balls are the GCMTmechanism solutions between 1975 and 2015.The red beach ball shows the focal mechanism of the 2015 Nepal MW7.9 shock.Red solid circles are aftershocks before June 26th, 2015 from GFZ.Bold brown, blue and yellow lines show location of MFT, MBT and MCT respectively. Thin red line shows some active faults in this region. |
在喜马拉雅山缝合带,1970年以来的震源机制大多数为逆冲型,也表明该地区为剧烈碰撞挤压区,由多条逆冲断层构成,由南向北分布有喜马拉雅主前缘逆冲断裂(MFT,Main Frontal Thrust fault)、主边界逆冲断裂(MBT,Main Boundary Thrust fault)、主中央逆冲断裂(MCT,Main Central Thrust fault)和西藏南部拆离断裂系(Guo et al.,2009).地表出露的主前缘逆断裂(MFT)、主边界逆断裂(MBT)和主中央逆断裂(MCT)在深部都汇入主喜马拉雅逆断层(MHT,Main Himalayan Thrust fault)上.几乎所有在喜马拉雅前缘断裂发生的大地震都与MHT的破裂有关(Ambraseys and Douglas,2004; Bilham,2004).实际资料也表明,地震活动多发生在浅于30 km的深度上,特别是群集在10~20 km上的主喜马拉雅逆冲断层附近.许多学者认为晚第四纪以来,MBT和MFT仍在活动,尤其是其南部最新的活动边界MFT活动性最强,尼泊尔地区低喜马拉雅的南北向地壳缩短在尼泊尔东部为17.8±0.5 mm·a-1,西部为20.5±1.0 mm·a-1(Lavé and Avouac,2000;Ader et al.,2012;邓起东等,2014).Hodge等(2004)则认为主中央逆断裂(MCT)存在活动断裂和较大变形.由于尼泊尔地震发震断层为极低倾角,发震断裂很难出露地表,给发震断层的空间展布位置和性质判断带来了一定的困难,发震断裂是MBT和MFT,还是MCT,是一个需要探索的问题.尼泊尔地震发生后,国内许多学者(刘志鹏和盖增喜,2015;张旭和许力生,2015;张勇等,2015)在利用远场地震波资料研究尼泊尔地震破裂过程时,认为破裂为单侧破裂,从破裂起始点开始,沿断层面向东南方向扩展达100 km量级,最大位错5 m以上.张贝等(2015)在研究尼泊尔地震同震变形和应力变化时,推测此次MS8.1地震在地表上显示发生在MBT断裂带附近,向深部延伸则很有可能发生在MHT上.由于大多数学者用的是远场数据,分辨率不高,要想进一步确定发震断层,还需要依据同震近场形变数据来研究滑动分布和几何特征.
D-InSAR(Differential Interferometric Synthetic Aperture Radar)观测技术,可获得空间连续覆盖的近场形变场,精确提取同震形变中心及地表形变展布情况,同时结合GPS同震观测数据,开展地震破裂特征反演,可以更好地理解尼泊尔MS8.1地震的滑动分布特征,揭示发震断层的几何学和运动学特征,帮助我们更好地认识喜马拉雅低角度逆断层型强震的活动构造变形特征和发震机制.
2 同震形变资料与形变特征分析地震发生后,InSAR和GPS获得了此次地震的同震形变数据.我们采用InSAR技术,处理了欧空局Sentinel-1A C波段SAR数据,获取了局部区域的同震形变场.同时,收集了日本ALOS-2卫星L 波段获得的同震形变场,以及美国加州理工大学及美国宇航局喷气动力性实验室(Caltech; http://aria.jpl.nasa.gov)提供的GPS同震形变场资料.Lindsey等(2015)利用日本ALOS-2卫星的2015年2月22日和2015年5月3的SAR数据对,获取了此次尼泊尔地震的同震形变场(图 2).从图 2a可以看出,形变场集中在南北相邻的两个形变中心区域,沿东偏南向伸展.北中心和南中心干涉色序相反,因此形变相反,北形变区域为下沉,南形变中心为抬升,从形变的干涉条纹数量上,可以判断出抬升量大于沉降量.值得注意的是,在虚线F1南侧的区域,同震干涉条纹已开始发散,开始呈反向包络的形态,因此,结合震源机制解,我们可以初步判定,F1为发震断层地表行迹,该行迹与MBT空间位置恰好一致.从图 2b的解缠图可以清楚的得知,南形变中心的视线向抬升量为1.1 m,北形变中心的视线向沉降量为0.8 m,抬升和沉降两个中心均位于断层上盘,显示出低倾角逆断层强震的变形特征.
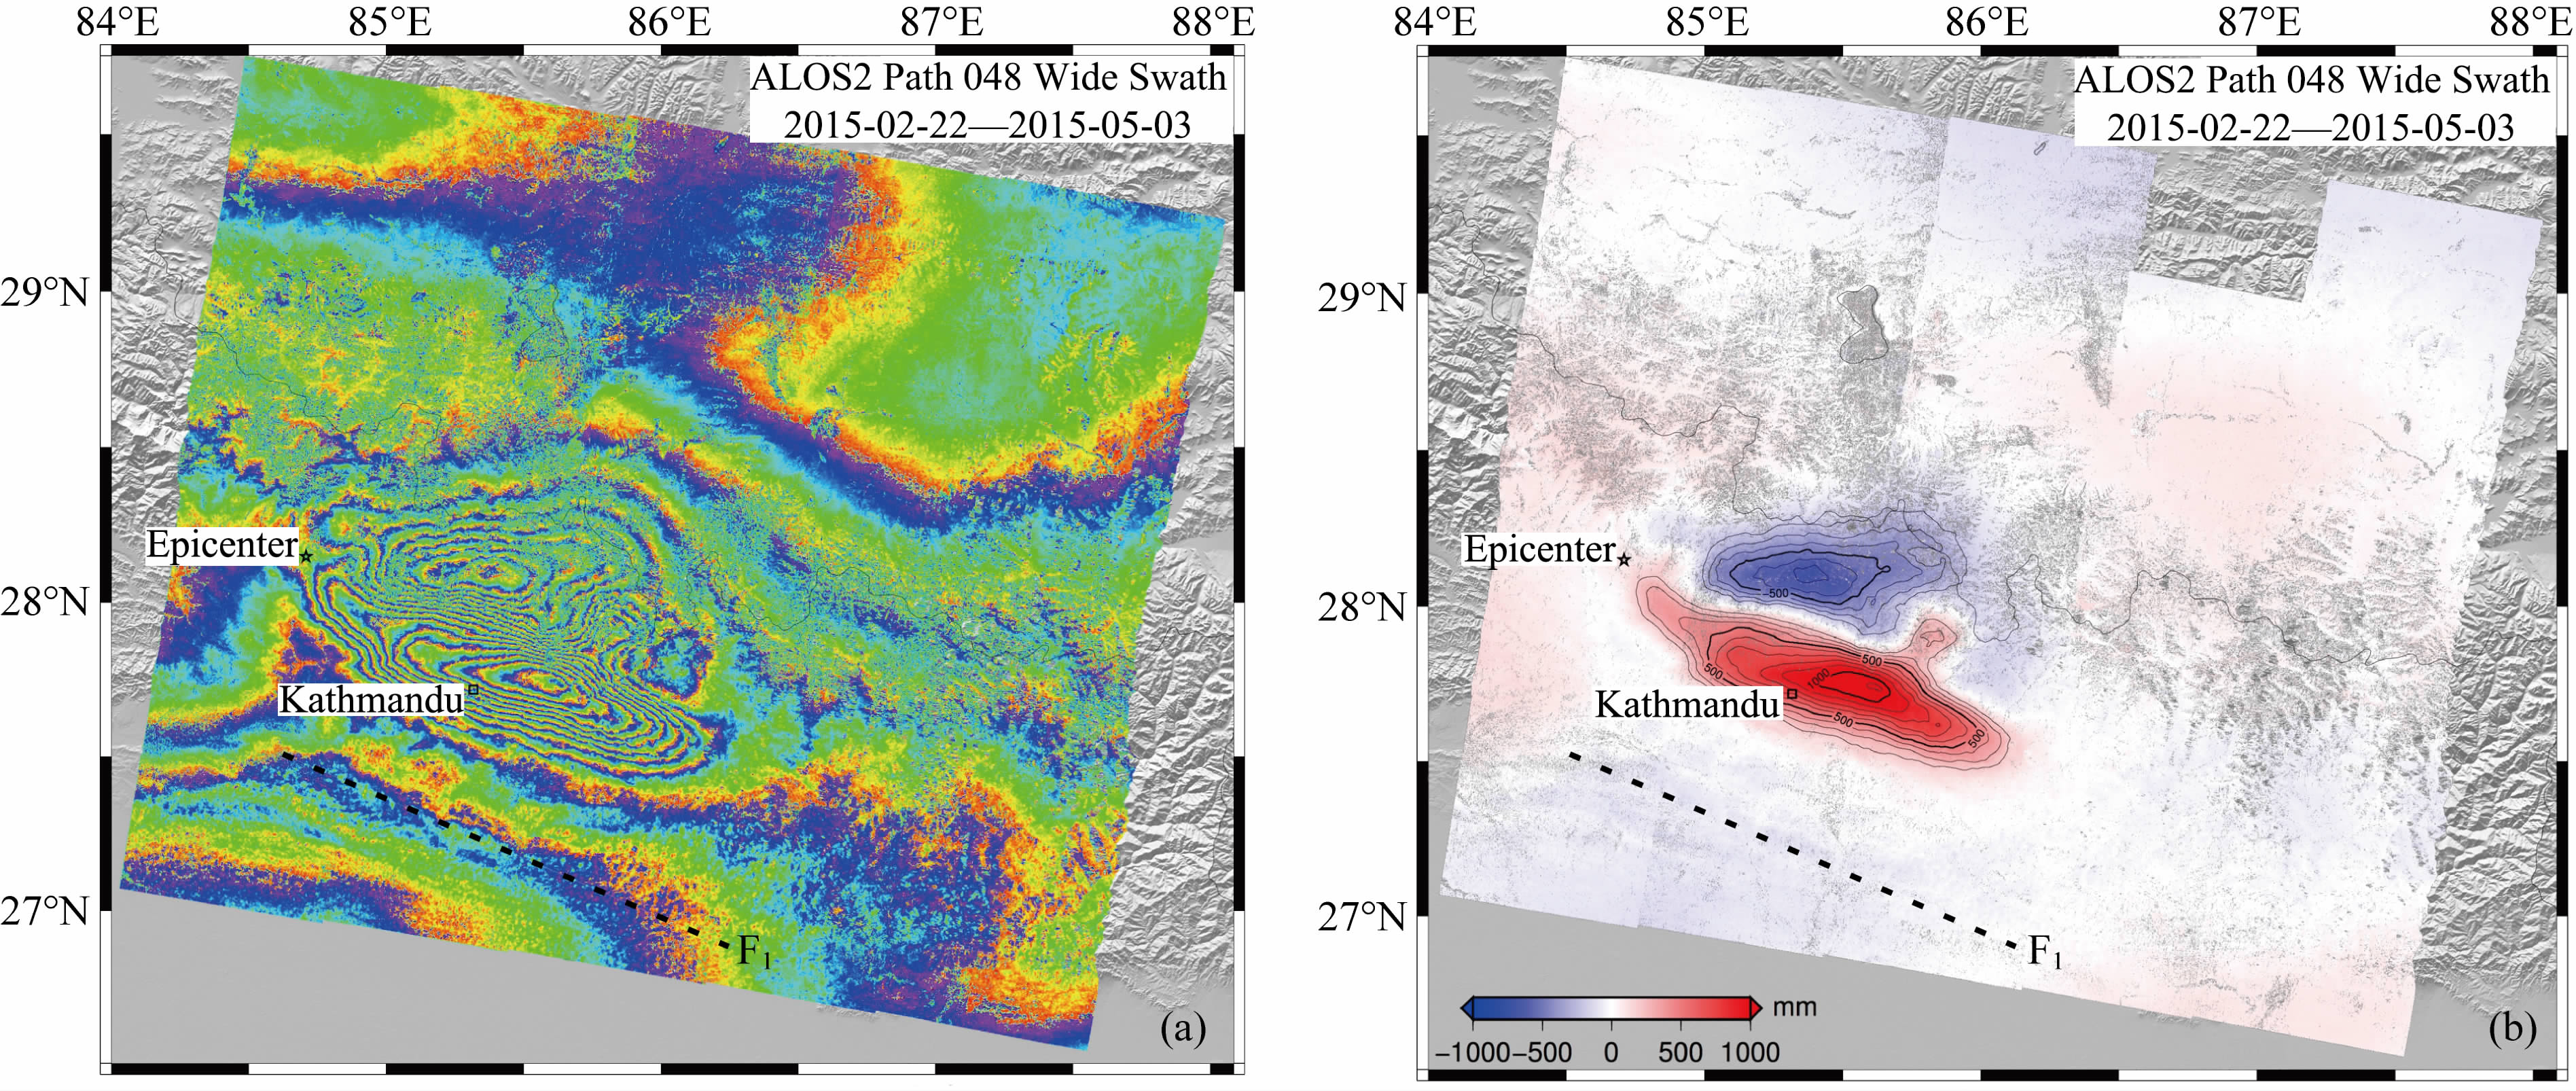 | 图 2 ALOS-2获取的尼泊尔地震同震形变场 (a)为干涉条纹图,其中每个条纹代表11.8 cm的视线向形变;(b)为解缠后的形变场;F1为推测发震断层地表位置. Fig. 2 Coseismic deformation field of 2015 Nepal mainshock derived from ALOS-2 Japanese SAR satellite data (a) Before unwrapping, each fringe represents 11.8 cm displacement in line of sight; (b) After unwrapping. F1 refers to surface location of the causative fault. |
我们收集了欧空局Sentinel-1A卫星地震前后2015年4月17日和2015年4月29日两个时相SAR数据对,采用InSAR技术处理并获得了尼泊尔地震同震干涉条纹图(图 3a).图 3b为解缠后的形变场,与图 2b相比,可以看出Sentinel-1A卫星只得到了部分隆升区域的形变场,且图像东北部区域由于失相关较大很难解缠出可用的形变场,但整个抬升区域的形变场分布特征与ALOS抬升区域形态类似,且最大抬升也达到了1.2 m.
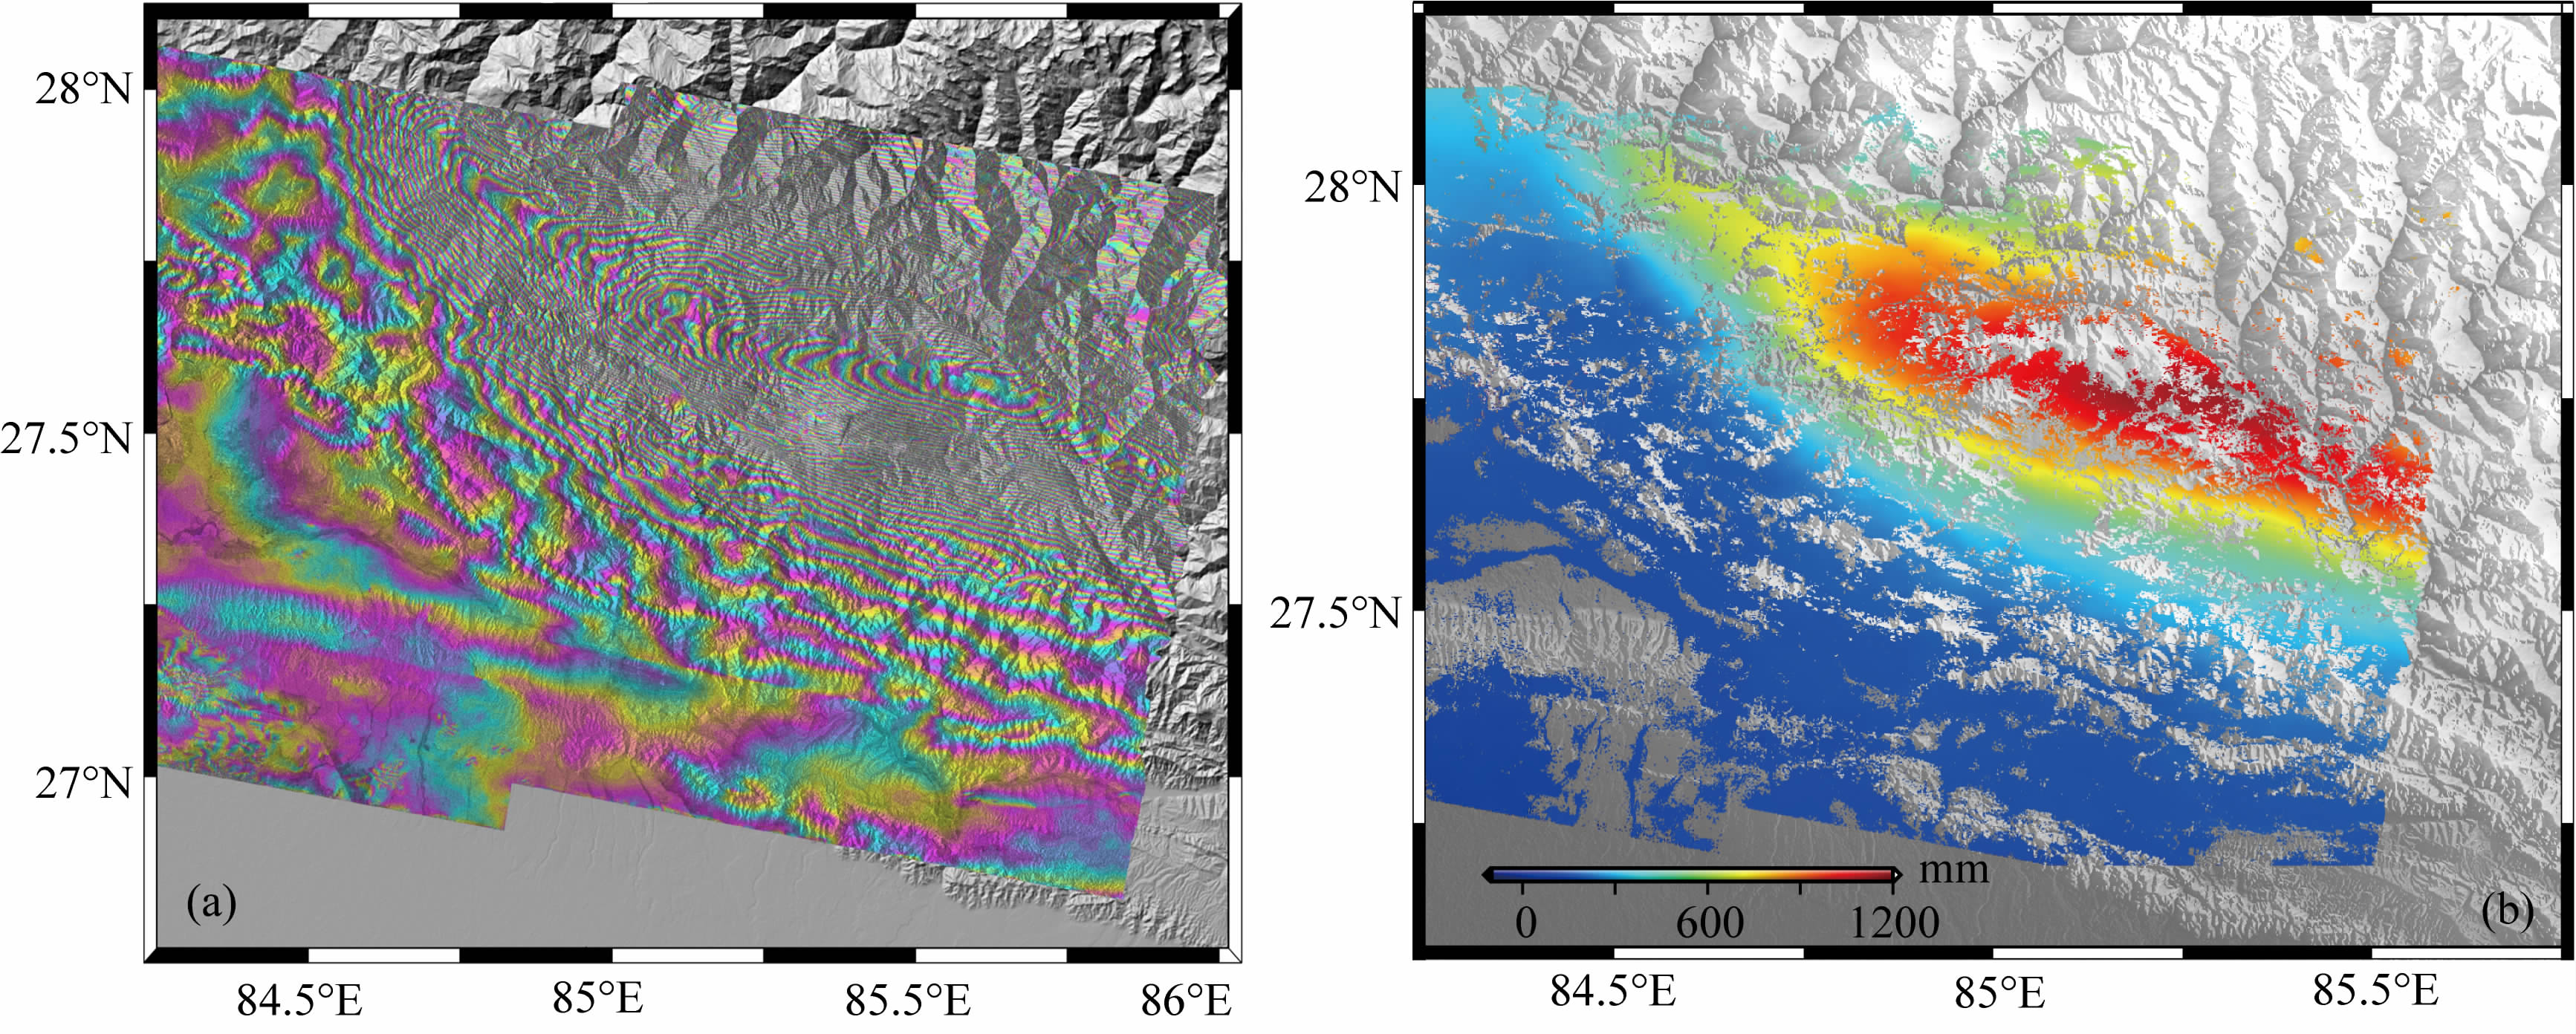 | 图 3 Sentinel卫星获取的尼泊尔地震同震形变场 (a) 为干涉条纹图,其中每个条纹代表2.8 cm的视线向形变; (b) 为解缠后的形变场. Fig. 3 Coseismic deformation field of the Nepal earthquake derived from Sentinel satellite data (a) Interferometric fringes, each stripe represents 2.8 cm displacement in line of sight; (b) After unwrapping. |
图 4为加州技术研究所和剑桥大学Jean-Philippe Avouac解算的GPS同震观测资料.由图 4可以看出,位于震中区附近的站点水平位移量比其他站点大得多,其中位于震中东侧约80 km的KKN4站,向南运动了近2 m,临近的NAST站向南运动了近1.5 m,两站在垂直方向上分别抬升了1.3 m和0.6 m.远离震区的台站水平和垂直量都小两个数量级,RMTE站向东运动了近1 cm,JMSM站向南偏东运动了0.7 cm.整个GPS同震形变场表现出震中区断层上盘物质受挤压向南偏东运动的趋势,DNSG站虽然水平位移偏小,但其下沉了近0.6 cm.
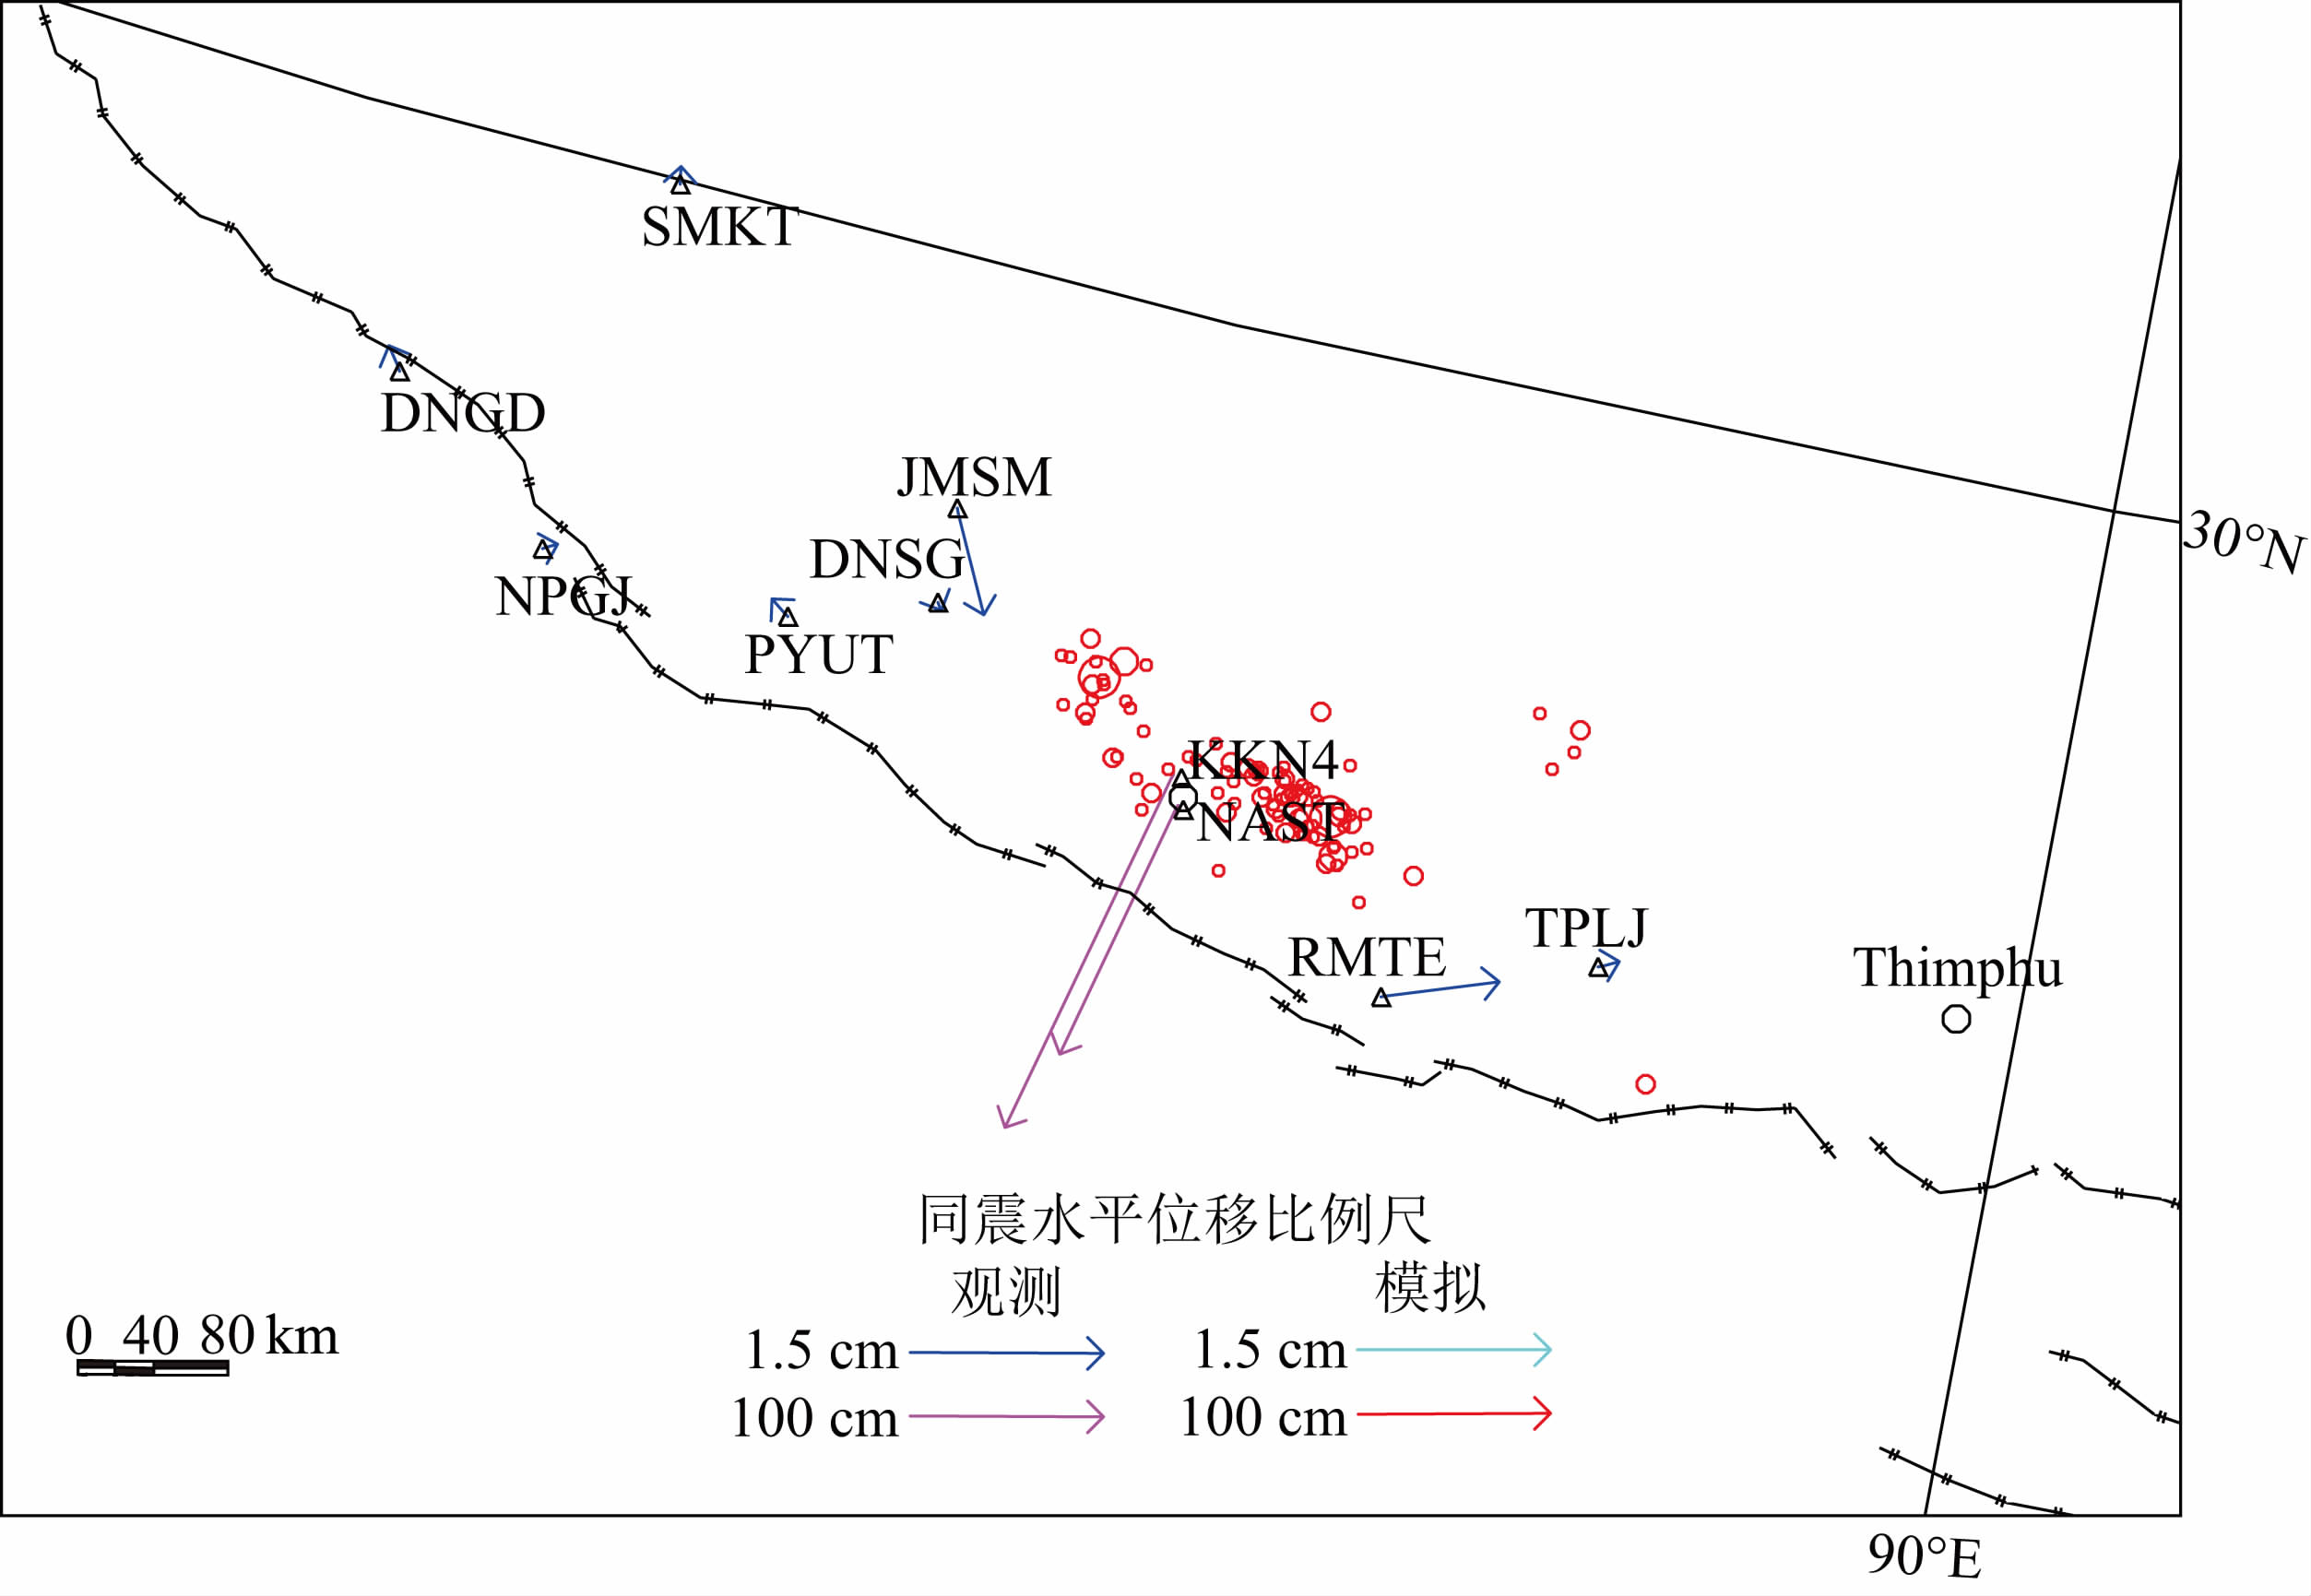 | 图 4 GPS同震水平观测分布 黑色三角为GPS台站,GPS同震水平观测数据由加州技术研究所和剑桥大学Jean-Philippe Avouac提供;红色空心圈为GFZ4月25日—6月26日余震分布;红色五角星为主震震中位置. Fig. 4 GPS-based coseismic displacements for the Nepal MW7.9 earthquake Black triangles are GPS sites, which are provided by the Advanced Rapid Imaging and Analysis (ARIA) Center for Natural Hazards supported by the NASA Jet Propulsion Laboratory (JPL) and California Institute of Technology (Caltech; http://aria.jpl.nasa.gov).Red circles are aftershocks before June 26th, 2015 from GFZ. Red star show the location of epicenter. |
过密的形变栅格点数据不仅不能提供更多的信息,而且增加了反演计算量.因而在反演前必须降低形变场图像的分辨率.这里我们采用的四叉树采样方法,形变场梯度大的区域采样密度高,反之就小,该方法既降低了形变场的空间分辨率,同时又保证了对形变场变化的精细刻画.在重采样过程中,设定采样的形变梯度阈值为0.05 m,即形变梯度大于0.05 m时进行四叉树划分,如果划分后其子区形变梯度仍然大于0.05 m,则再对子区进行四叉树划分,如此类推,直到形变梯度小于0.05 m.对于没有形变值的非相干区域,则不进行采样.图 5a和图 5a1给出了经过四叉树重新采样后的ALOS-2和Sentinel-1卫星的形变观测值.
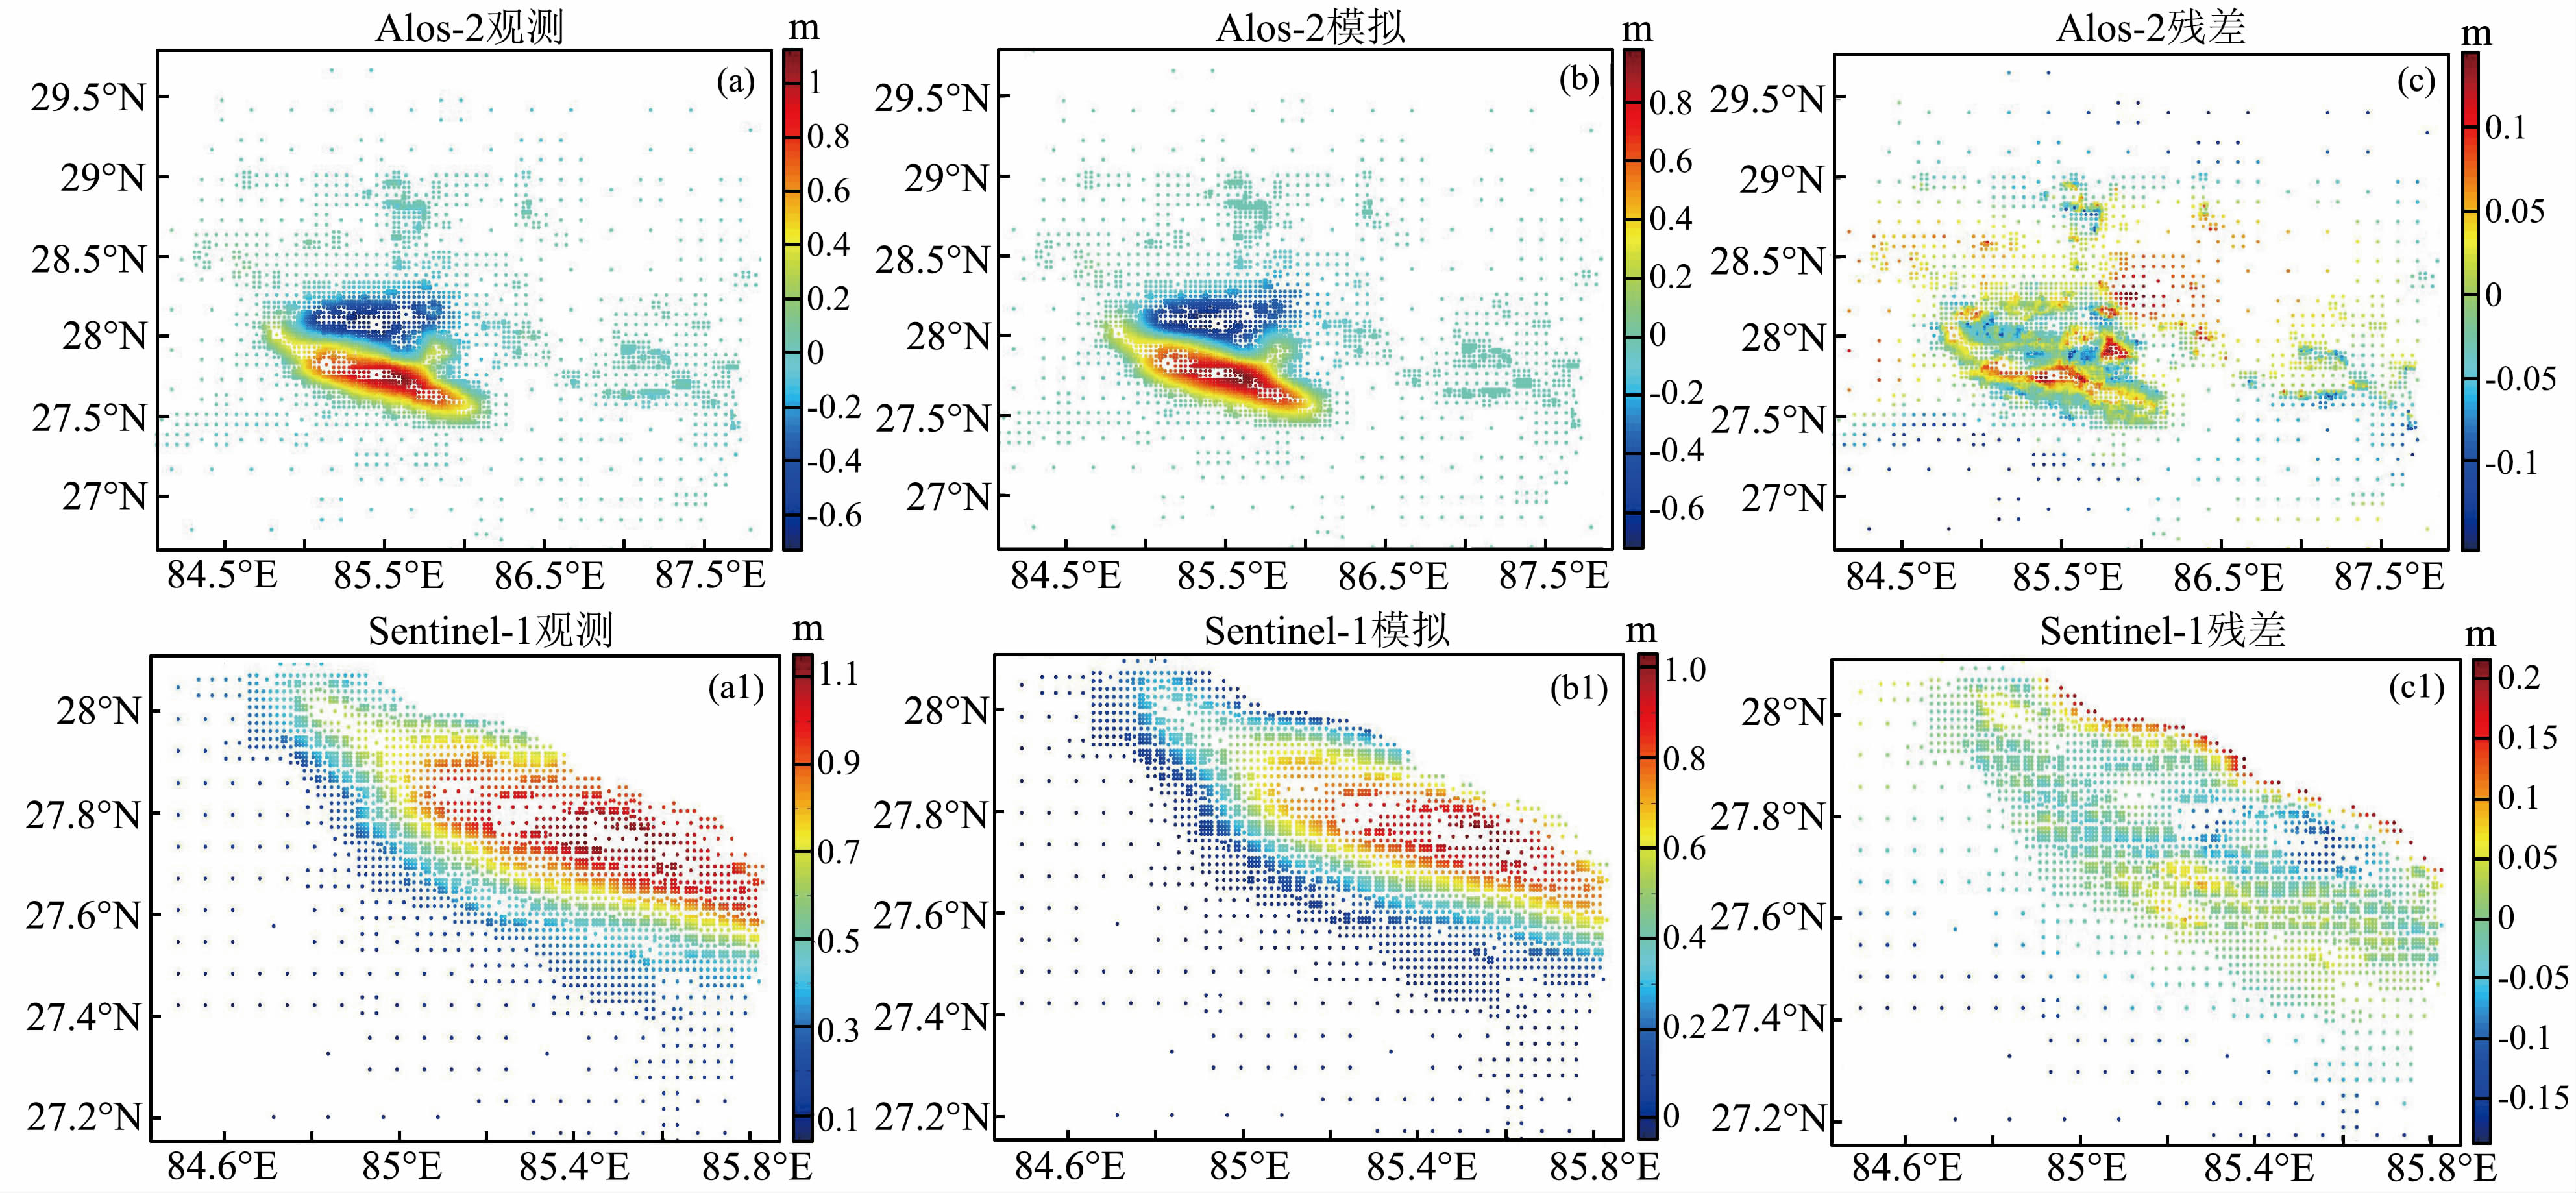 | 图 5 InSAR观测同震形变场与模拟同震形变场对比 (a)ALOS-2观测同震形变场; (b)ALOS-2模拟同震形变场; (c)残差分布; (a1) Sentinel-1观测同震形变场; (b1) Sentinel-1模拟同震形变场; (c1) 残差分布. Fig. 5 Comparison of observed and simulated coseismic deformation fields (a) Coseismic deformation field from ALOS-2; (b) Simulated coseismic deformation field; (c) Residuals;(a1) Coseismic deformation field from Sentinel-1; (b1) Simulated coseismic deformation field; (c1) Residuals. |
从表 1可以看出,Global CMT震源机制结果的节面1与USGS的节面1,以及GFZ的节面2的走向与发震断层基本一致,选定这3个节面参数为断层初始模型参考依据,结合InSAR形变场资料,建立了弹性半空间的发震断层初始模型,初试模型参数包括断层起始点经度和纬度,断层长度、深度、走向、倾角、滑动量、滑动角等8个参数.表 2给出了断层初始模型参数,由InSAR干涉形变场图像,发震断层起始点经纬度、长度和走向可以由图 2a的F1来确定,初始断层长度为200 km,走向由290°,倾角选为5°~12°.Global CMT给出的震源深度为15 km,但断层倾角仅7°,这里我们初步取断层沿倾向宽度为120 km.Global CMT给出的标量地震矩M0为7.76×10²⁰N·m.剪切模量μ取33 GPa.在统一计量单位后,由公式M0=μULW,可求出发震断层面上平均滑动量U约为1.0 m左右.
| 表 1 尼泊尔地震震源机制参数 Table 1 Focal mechanism solutionsof the 2015 Nepal event |
| 表 2 断层初始模型参数 Table 2 Parameters of initial fault model |
在反演模拟中,将断层沿走向与倾向分成多个5×5 km子块(fault patches),假定每个子块内部滑动均匀分布,就可以将非线性问题转化为线性问题来解决.我们通过构建均方差减小函数对地表模拟形变值同时与ALOS-2和Sentinel-1获得的InSAR观测数据、GPS观测数据的拟合效果进行联合评价,使模拟值与各类观测数据拟合均方差达到最小时,而最终获得了发震断层滑动分布,该方法即为基于敏感性迭代拟合方法(SBIF)(Wang等,2008).
图 5给出了经过四叉树重新采样后的观测值、模拟值和残差值分布图.从图 5a—c来看,模拟得到的ALOS-2的同震形变场与观测值非常一致,在同震变形集中区域残差在-10 cm至10 cm之间,说明模拟结果很好地反映出了实际观测值的分布特征.对于Sentinel-1卫星,模拟同震形变场(图 5b1)与实际观测形变场(图 5a1)类似.由于Sentinel-1是C波段,在植被覆盖区相干性比起ALOS-2的L波段较差(卢倩云等,2015),整个残差较ALOS-2卫星大,在-15 cm至15 cm之间,特别是在图 5c1东北角区域失相关较大,从而影响到抬升区域的东北外侧边形变值,造成残差偏大.
4.2 GPS数据拟合结果图 6给出了GPS同震水平和垂直位移观测与模拟对比图,表 3列出了各个台站的同震位移观测、模拟与残差值.可以看出,位于震中东侧约80 km的KKN4站和NAST站水平位移和垂直位移都非常大,达到了m级,均表现出向南和抬升运动,其中,KKN4台的水平和垂直位移分别为188 cm和127 cm.从观测和模拟结果看,震区及周边地区水平和垂直拟合的非常好,特别是震中区KKN4站和NAST站,拟合残差只占观测值的2%~3%.而远离震区的8个台站,水平和垂直同震位移都非常小,除了DNGD台的垂直同震位移为11.4 mm外,其他台的同震位移均只有几个毫米,拟合误差较大,特别是垂直位移,这可能与GPS垂直观测精度不高有关,例如,远离余震区200~400 km范围的DNGD、NPGJ、TPLJ台站的观测值与模拟值出现了反向.但由于远离震区的8个台站观测值都非常小,对断层模拟结果不会有太多的影响.
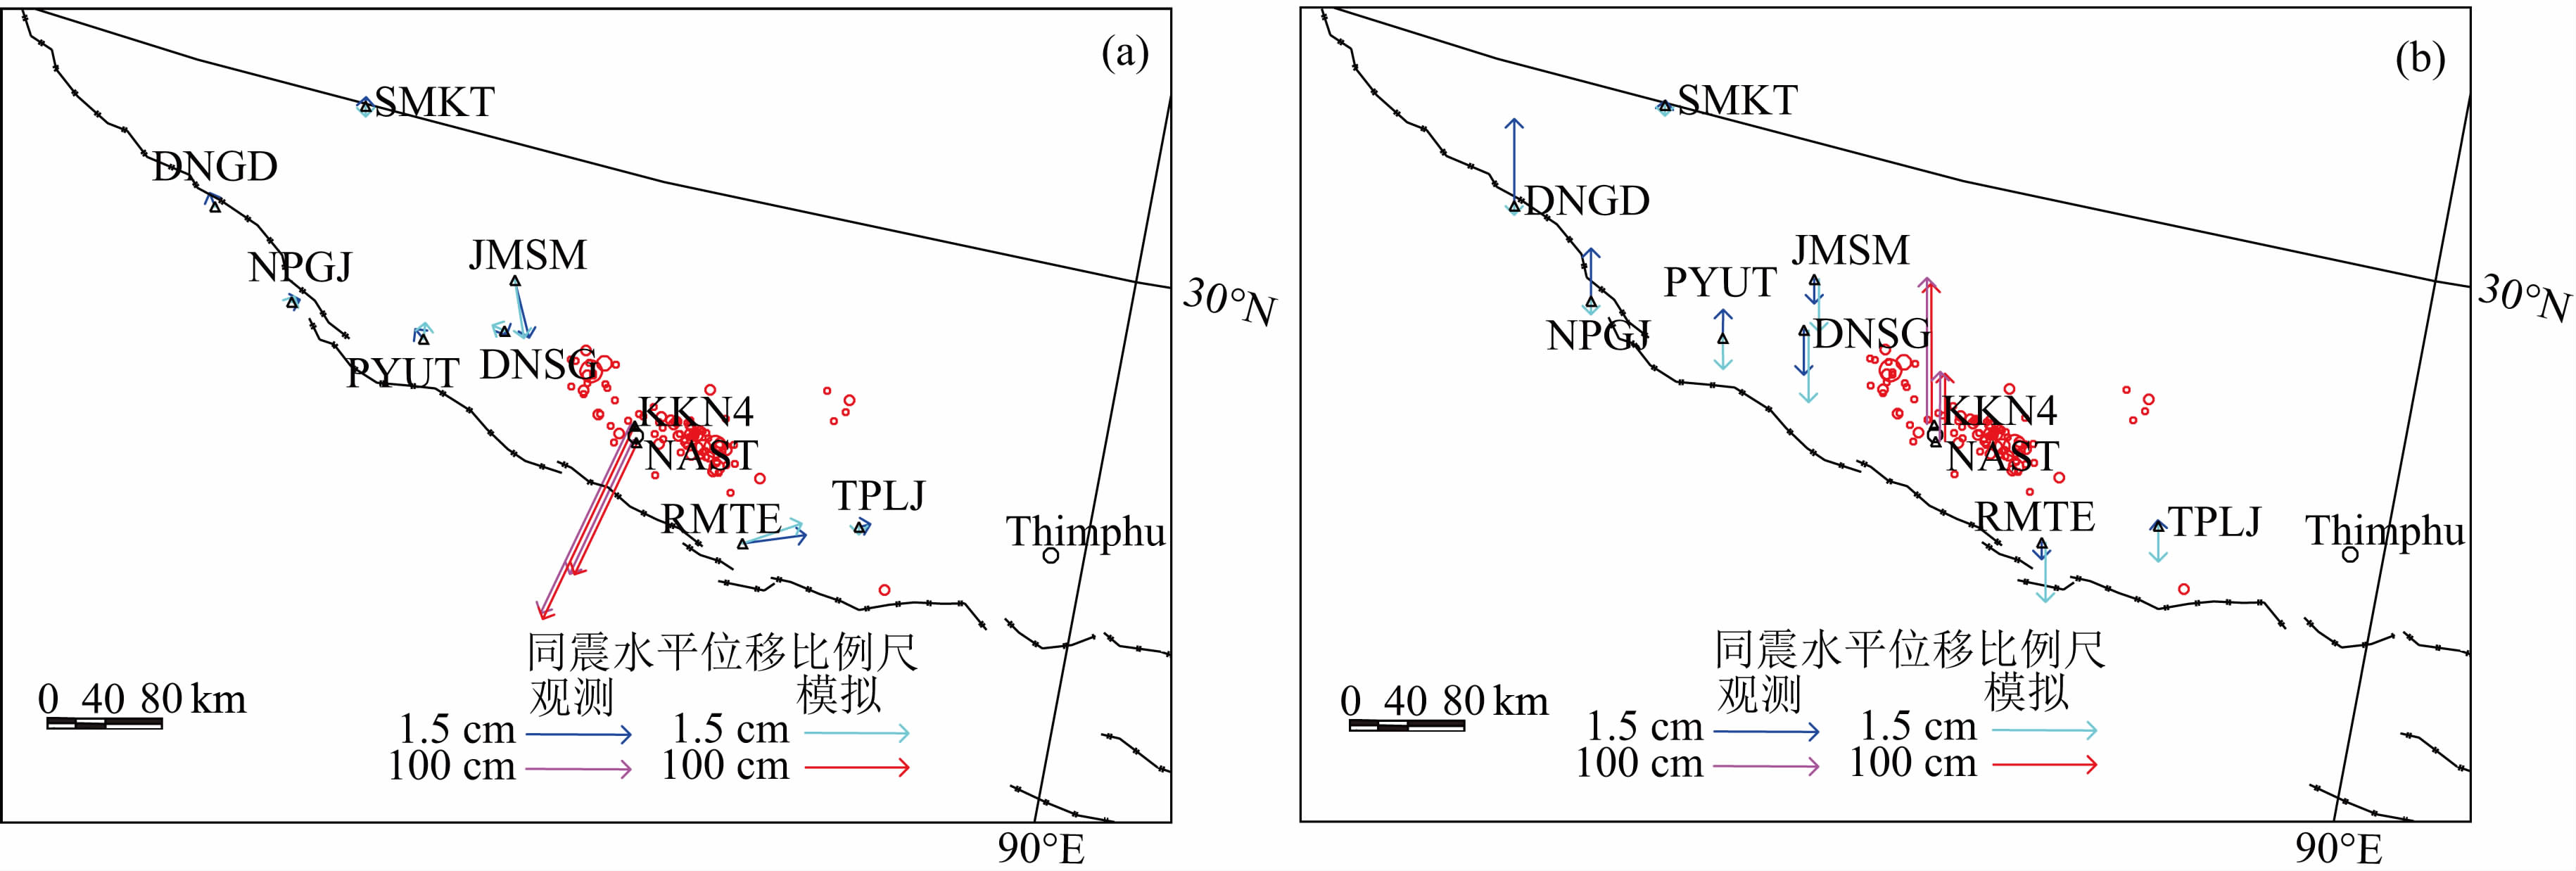 | 图 6 GPS同震位移观测与模拟对比 (a) GPS同震水平位移观测与模拟对比; (b) GPS同震垂直位移观测与模拟对比. Fig. 6 GPS data fitting (a) GPS-observed and model predicted horizontal coseismic displacements of the Nepal earthquake; (b) Observed and model-predicted vertical displacements of GPS sites located near the epicenter region. |
| 表 3 GPS同震位移观测、模拟与残差 Table 3 GPS-derived coseismicdisplacements, model predictions and residuals |
通过联合反演,得到了尼泊尔地震断层位错分布,各数据源与模型的相关系数达到了0.9955.图 7、8和9分别给出了不同视角下的尼泊尔地震的断层位错分布图.从滑动位错由东向西沿断层走向与倾向深度的关系可以看出(图 7),滑动分布主要集中在沿走向150 km,沿倾向70 km的范围内,最大滑动量为5.59 m,平均滑动量为0.94 m,平均滑动角为94.8°,显示出以逆冲为主兼微量右旋分量.张勇等(2015)在采用地震波加2个GPS台站的静态位错反演,联合反演得到的最大滑动量为5.2 m,与本研究结果接近.由图 8显示,发震断层倾角在不同深度并不一致,倾角在浅部约为7°,随着深度增加,倾角逐渐变大,到垂直深度20 km时倾角接近12°.滑动量超过4 m的区域主要集中在垂直深度8~10 km之间.
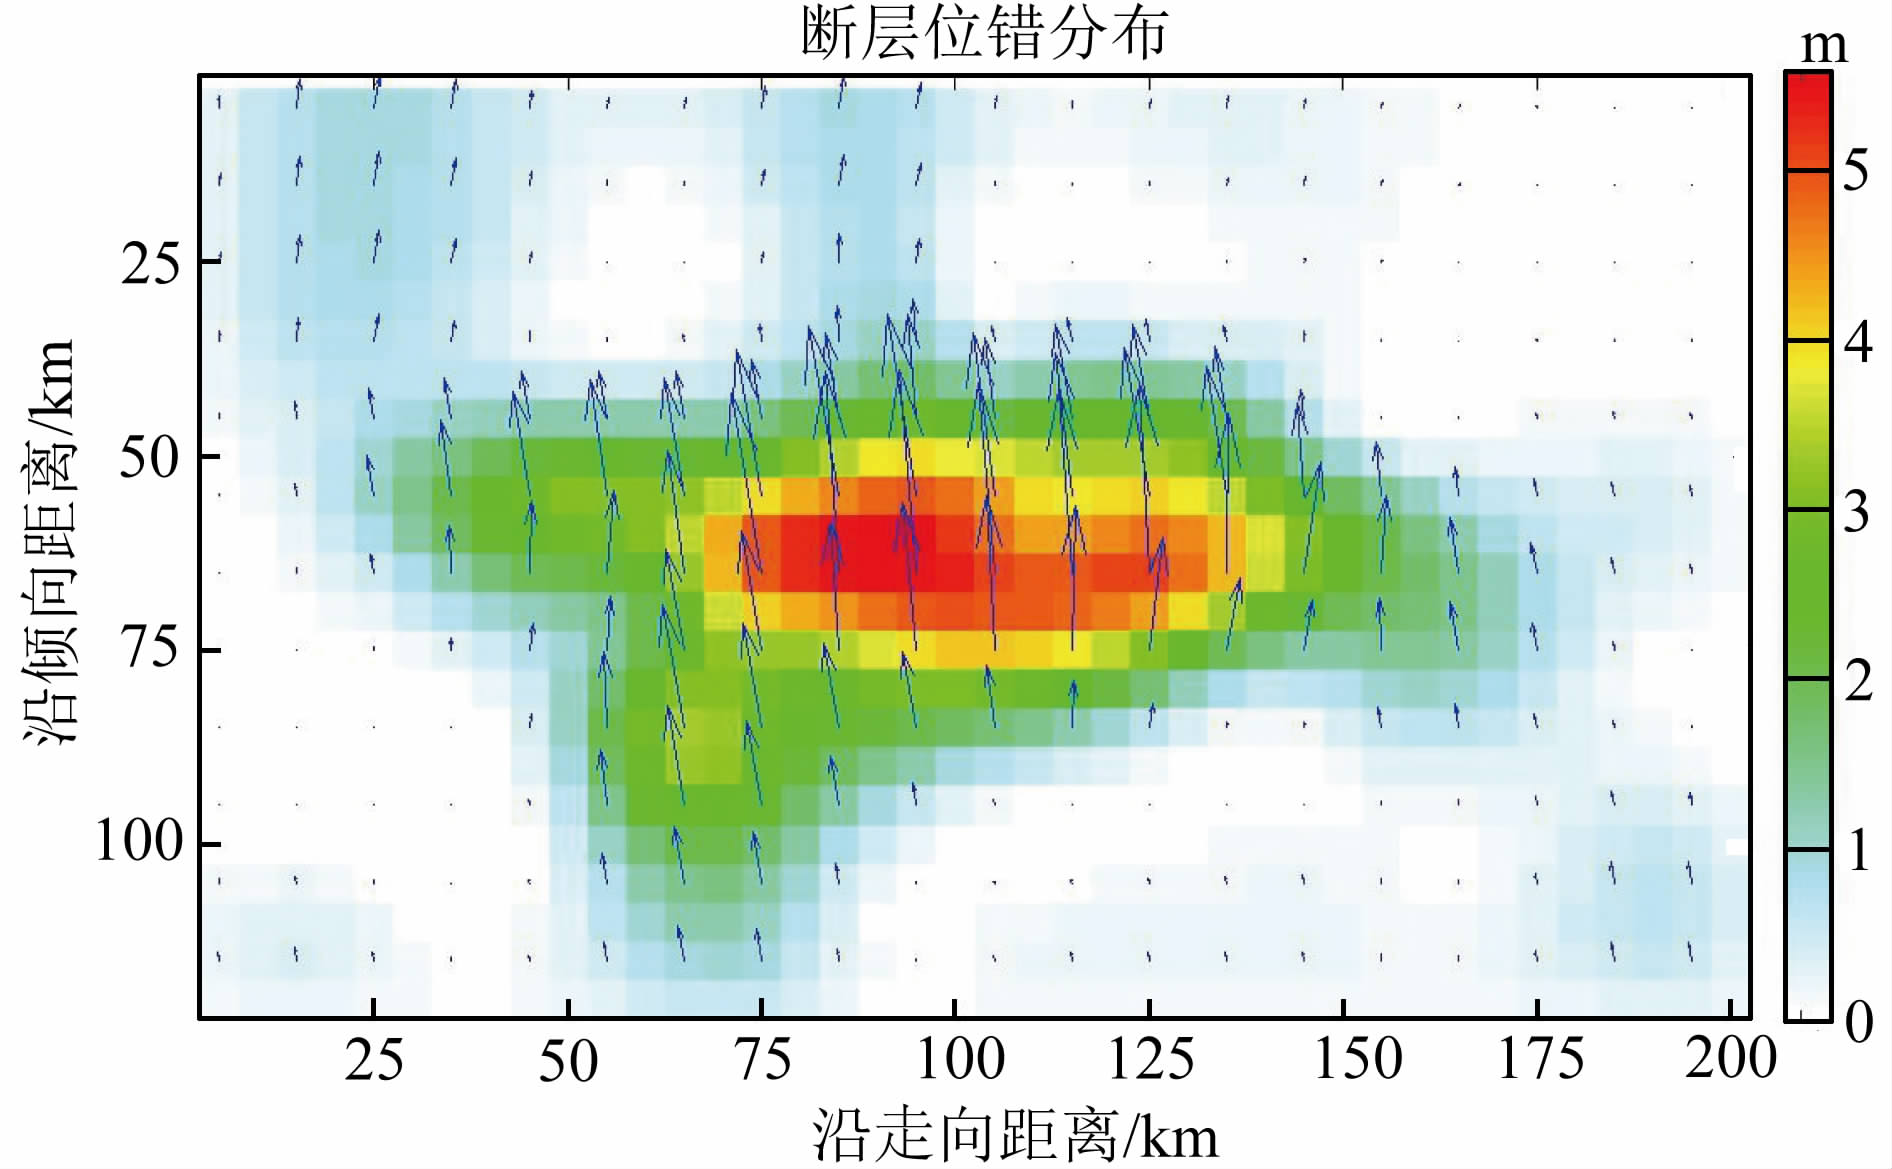 | 图 7 联合反演获取的断层位错分布 Fig. 7 Fault slip distribution from joint inversion |
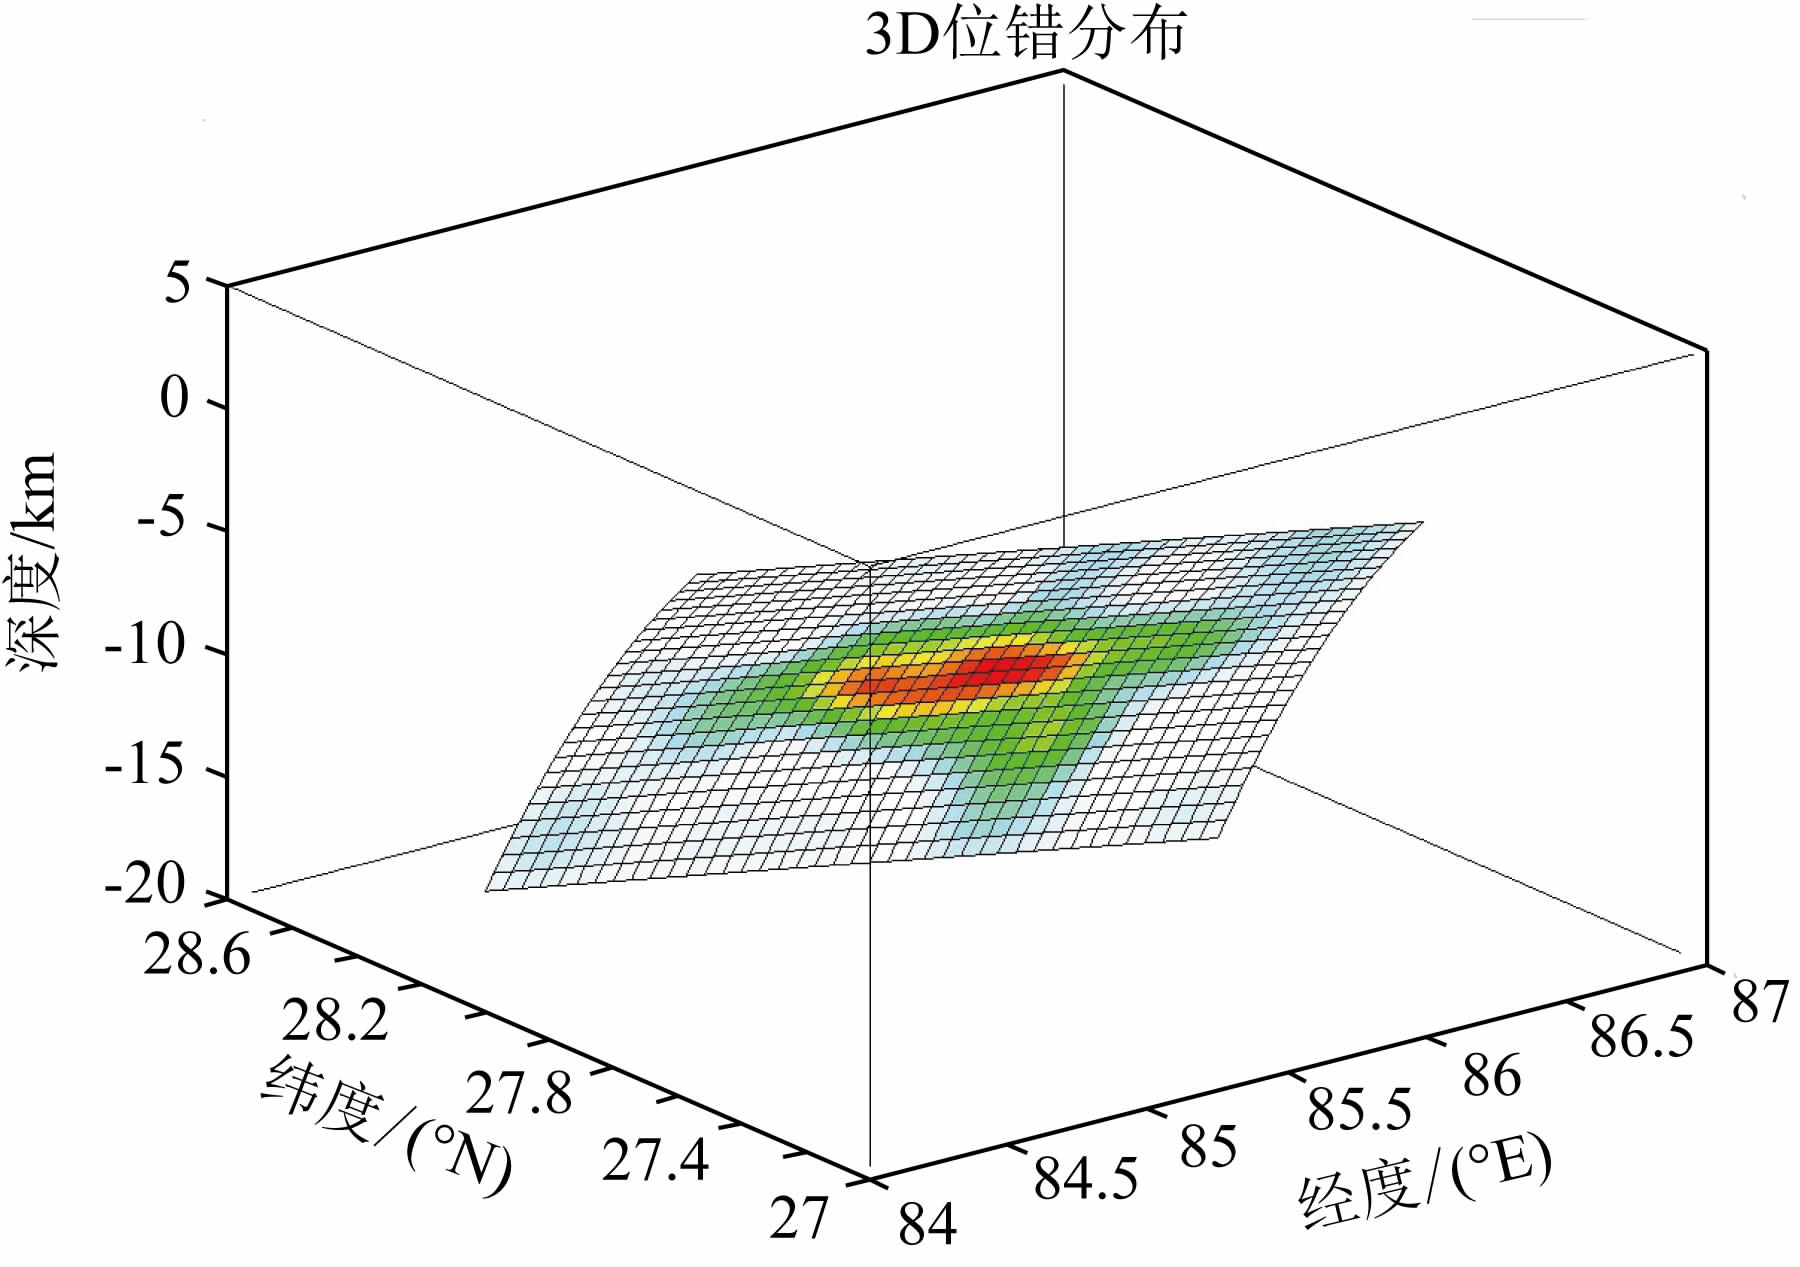 | 图 8 三维显示下的断层位错分布 Fig. 8 3D view of fault slip distribution |
图 9给出了断层滑动分布在地表的投影,可以看出整个滑动分布在200 km×120 km的范围内,4月25日的MW7.8级主震发生在西端,破裂由西向南东东方向单侧破裂,主要形成了长约150 km场的主滑动面.张旭和许力生(2015)时空破裂过程图像证实破裂几乎是纯粹的单侧破裂,从破裂起始点开始,沿断层面向东南方向扩展约100 km,同时沿断层面向深部扩展约80 km,最大位错约5.8m.余震主要分布在主震破裂区域周边,余震区与主震破裂区形成了互补的关系.震后5月12日最大余震MW7.2级位于主震破裂区的“凹”型滑动缺损区域,可以初步判定该强余震的发生,填补了主震破裂的空区.
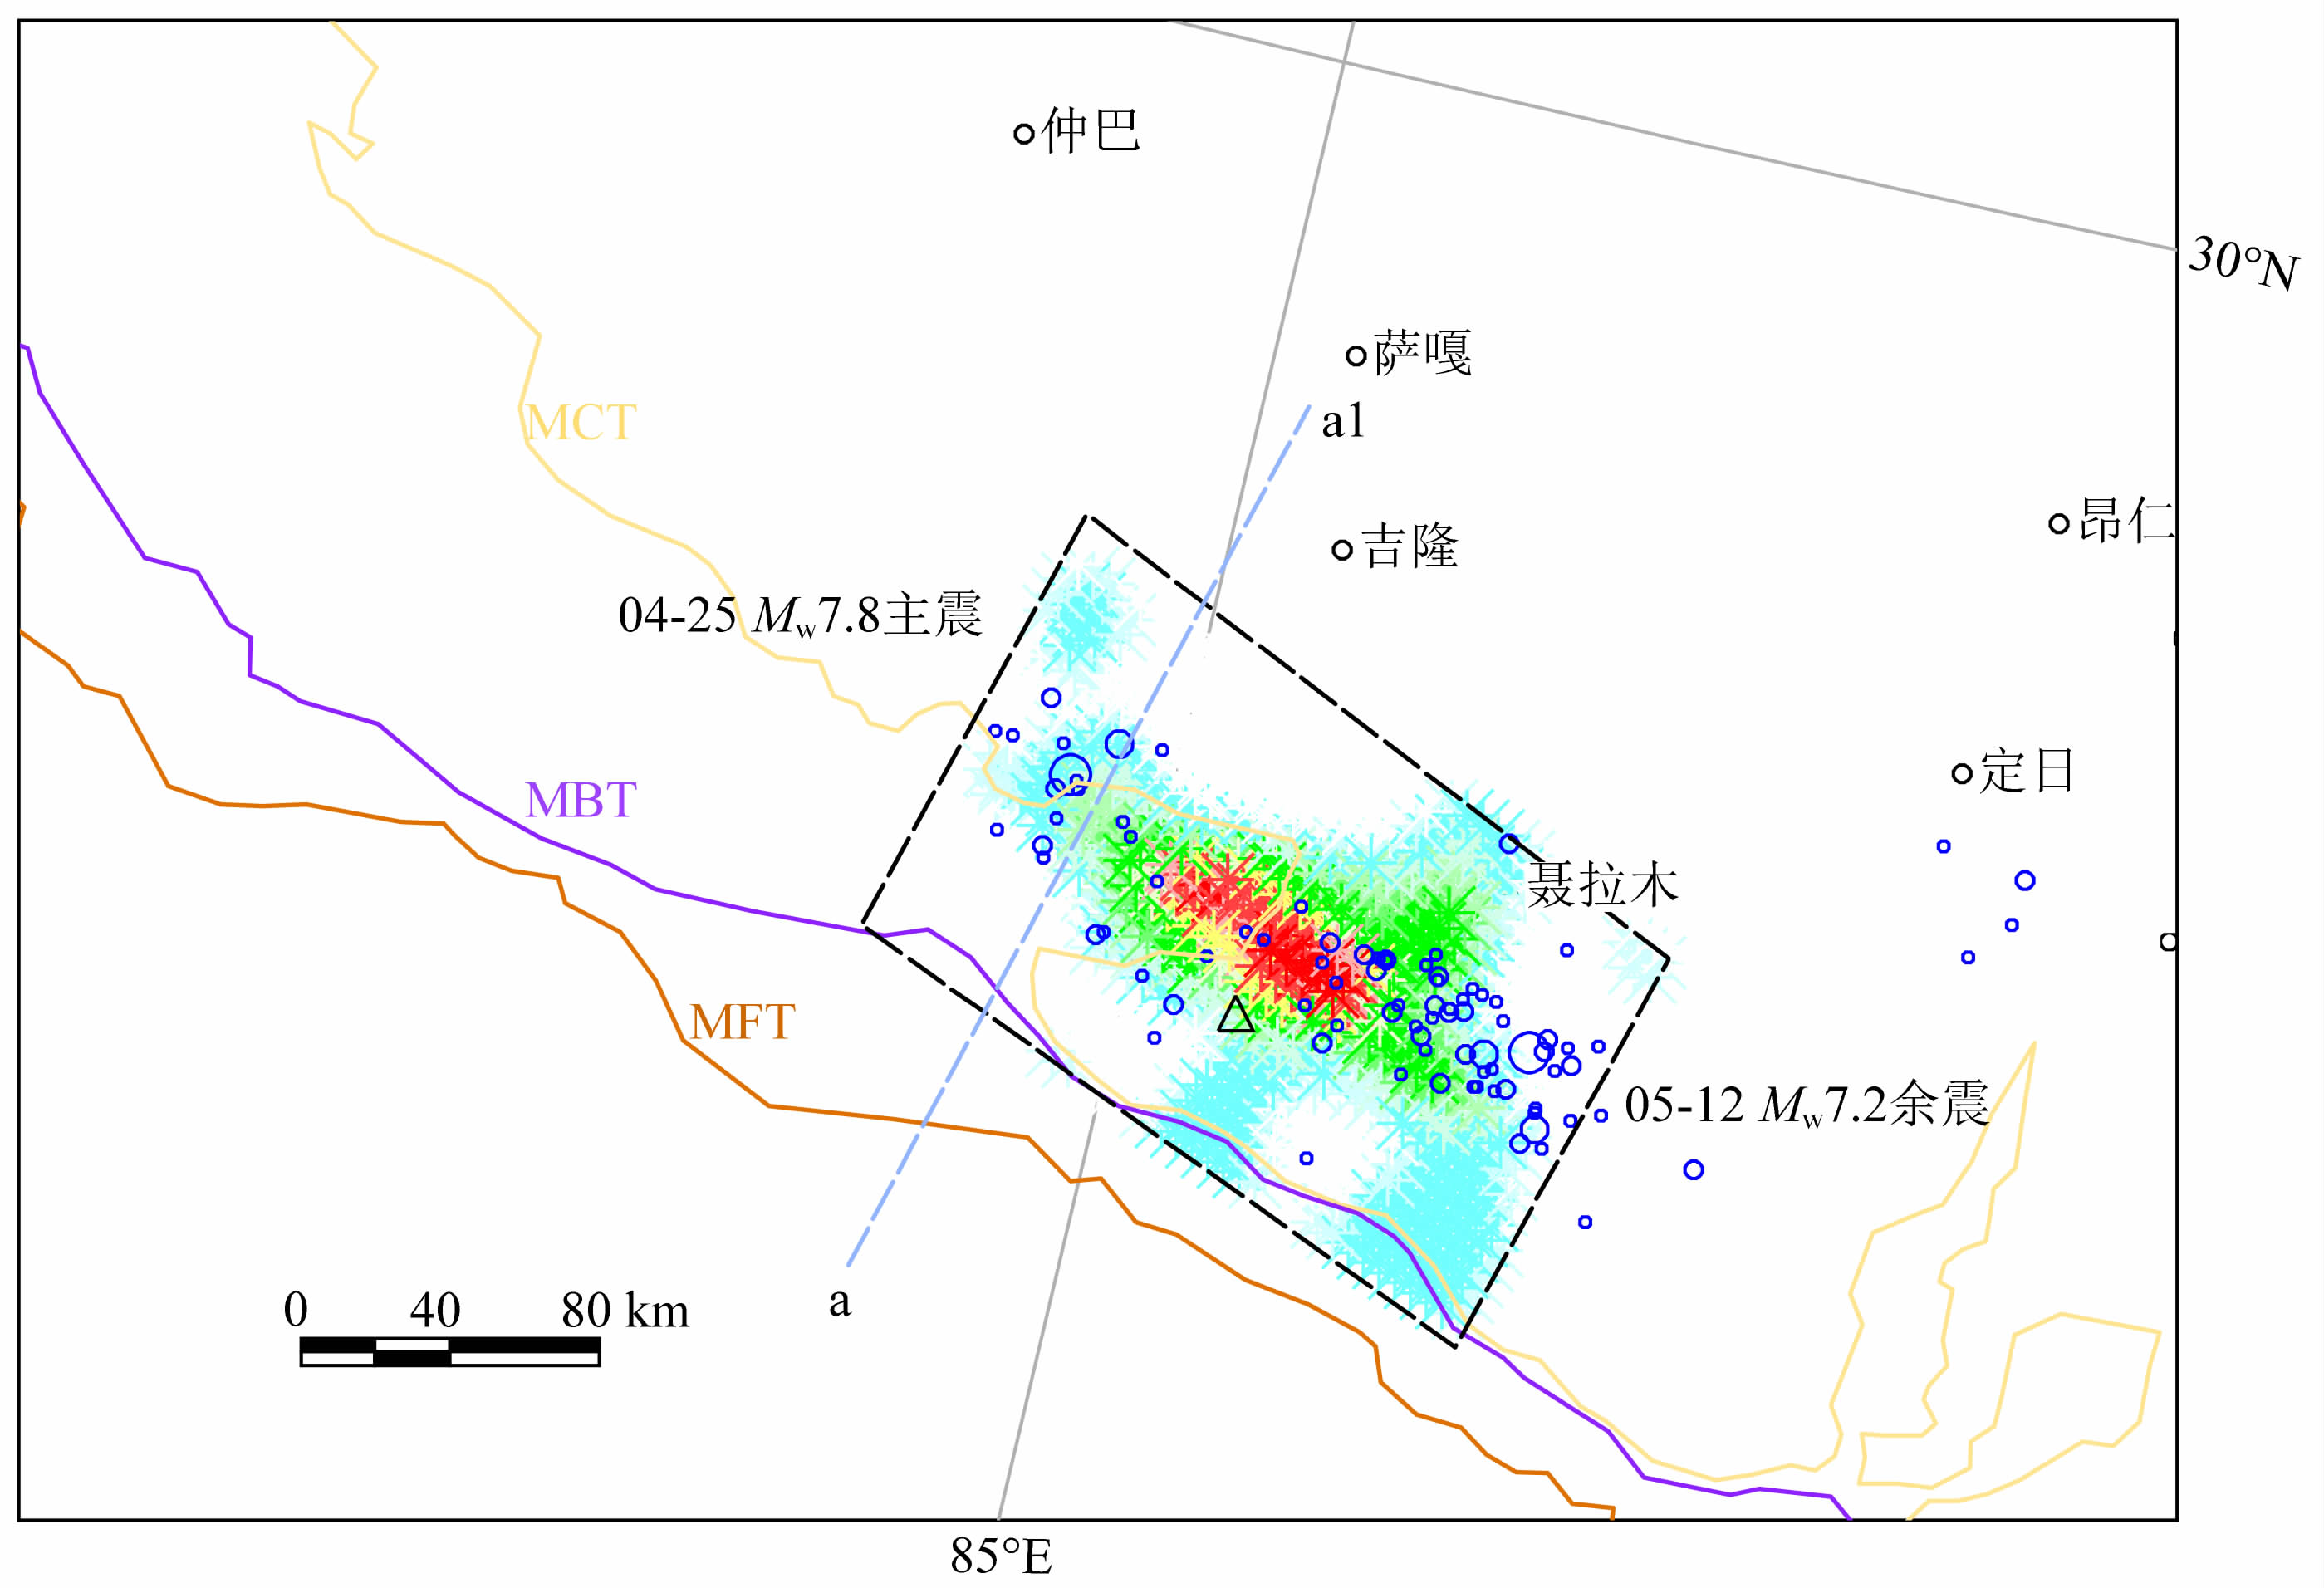 | 图 9 断层位错分布在地表投影 蓝色圈为GFZ给出的4月25日—6月26日尼泊尔主震和余震分布图;棕色、紫色和红色线分别代表MFT、MBT和MCT(Jouanne et al., 2004);蓝色虚线a1—a为断层剖面. Fig. 9 Slip distribution projected onto the surface Blue circles show the main shock and aftershocks (from GFZ) of Nepal earthquake till June 26th, 2015. Brown purple and red lines refer to MFT, MBT and MCT respectively (Jouanne et al., 2004).The blue dotted line marks the profile of faults in Fig.10. |
从断裂MFT、MBT和MCT与滑动面地表投影的位置来看,主震破裂区的上边界与MBT位置十分吻合,由于发震断层倾角很小,很难在地表形成破裂带.主震破裂面和余震分布均在MBT北侧,虽然在东侧MBT与MCT位置十分靠近,但西部沿过震中的a1—a剖面显示,MFT、MBT和MCT间隔距离相当,均在50 km左右.主震破裂区主要集中的MBT以北50~60 km处,此处的深度为8~9 km,倾角为9°,继续向北时主震破裂面以10°~12°的倾角向深延伸,在18 km~20 km处与MHT交汇.从图 10的断层示意图可以看出,主破裂面主要集中在MBT上,已经深入到MCT断面的下方,滑动面继续向深部已达到MHT.因此,从位错三维分布、断层空间位置来看,可以初步判定MBT为此次地震的发震断层.
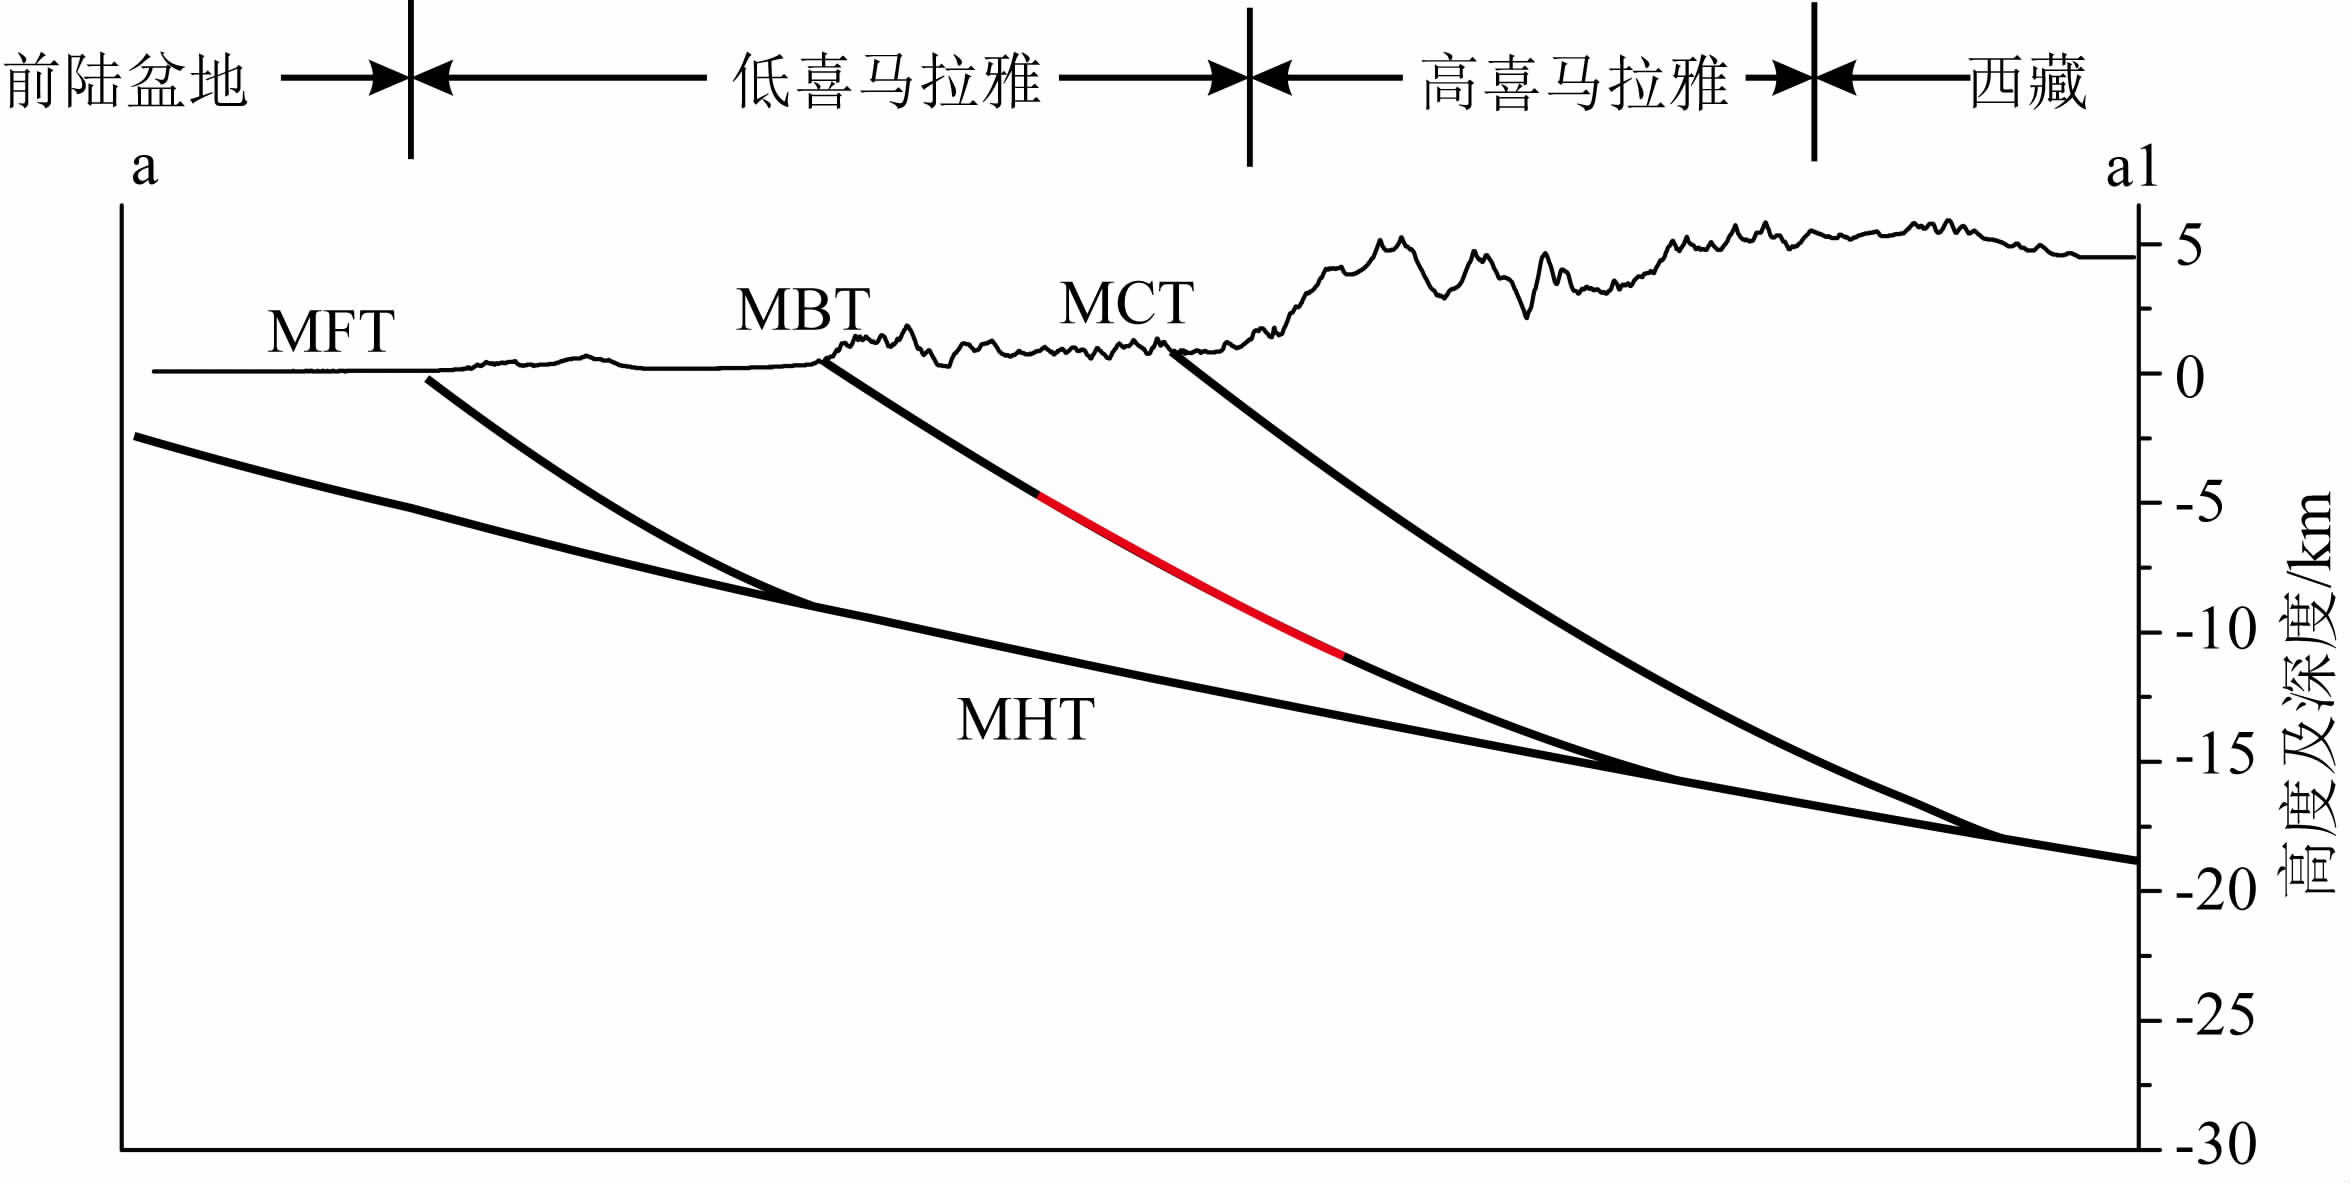 | 图 10 喜马拉雅地区断层(红色为尼泊尔地震主破裂带) Fig. 10 Schematic diagram of the fault system beneath the Himalayas(The red line denotes the main rupture zone of the Nepal earthquake) |
利用日本ALOS-2和欧空局Sentinel-1A卫星获得了尼泊尔地震InSAR同震形变场,结合GPS同震位移数据,在对形变场特征进行分析的基础上,联合反演了发震断层滑动分布特征,并分析了可能的发震断层.通过研究和分析,得到以下认识:
(1)尼泊尔地震的地表同震形变场主要集中在150 km×100 km的范围内,且分为南北两个相邻的形变中心,南形变中心的视线向抬升量约为1.2 m,北形变中心的视线向沉降量约为0.8 m.在图 2a F1南侧的区域,同震干涉条纹已开始反向包络,与北侧区域相反,可以初步判定F1为发震断层地表行迹,该行迹与MBT空间位置恰好一致.抬升和沉降中心均位于断层上盘,显示出低倾角逆断层强震的变形特征.位于形变抬升区的KKN4和NAST两个GPS站,水平和垂直位移都非常大,向南运动和抬升量均达到了m级,显示出上盘物质受挤压向南偏东运动的趋势,远离震区的其他GPS台水平和垂直观测量均小于1 cm.
(2)采用基于敏感性迭代拟合方法,同时模拟InSAR、GPS数据,当模拟值与观测数据拟合均方差达到最小时,即获得发震断层滑动量分布.结果表明,各数据与模型的相关系数达到了0.9955.ALOS-2同震模拟形变场与观测值非常一致,最大残差在-10 cm至10 cm之间.而Sentinel-1卫星同震模拟形变场与实际观测值基本一致,最大残差在-15 cm至15 cm之间.主震区附近的GPS水平和垂直拟合的非常好,特别是震中区KKN4站和NAST站,拟合残差只占观测值的2%~3%.而远离主破裂区的8个台站,垂直位移拟合误差较大,这可能与GPS垂直观测精度不高有关.
(3)通过联合反演得到的断层位错分布主要集中在沿走向150 km,沿倾向70 km的范围内,最大滑动量为5.59 m,平均滑动量为0.94 m.断层面倾角在浅部约为7°,随着深度增加,倾角逐渐变大,到垂直深度20 km时倾角接近12°.滑动量超过4 m的区域主要集中在垂直深度8~10 km之间.余震主要分布在主震破裂区域周边,5月12日MW7.2级余震位于主震破裂区的“凹”型滑动缺损区域.
(4)主震破裂区的上边界与MBT空间位置非常吻合,主震破裂区和余震分布均在MBT北侧,主震破裂区主要集中的MBT以北50~60 km处,垂直深度约为8~9 km,倾角为9°,继续向北时主震破裂面以10°~12°的倾角向深延伸,在18~20 km可能与MHT交汇.因此,我们初步判定MBT为此次地震的发震断层.
| [1] | Ader T, Avouac J P, Jing LZ, et al. 2012. Convergence rate across the Nepal Himalaya and interseismic coupling on the Main Himalayan Thrust: Implications for seismic hazard. Journal of Geophysical Research: Solid Earth (1978-2012), 117(B4). |
| [2] | Ambraseys N N, Douglas J. 2004. Magnitude calibration of north Indian earthquakes. Geophys. J. Int.159(1): 165-206. |
| [3] | Bilham R. 2004. Earthquakes in India and the Himalaya: Tectonics, geodesy and history. Ann. Geophys.47(2-3): 839-858. |
| [4] | Bilham R, Larson K, Freymuller J. 1997. GPS measurements of present-day convergence across the Nepal Himalaya. Nature, 386(6620):61-64. |
| [5] | Deng Q D, Cheng S P, Ma J, et al. 2014. Seismic activities and earthquake potential in the Tibetan Plateau. Chinese J. Geophys. (in Chinese), 57(7): 2025-2042, doi: 10.6038/cjg20140701. |
| [6] | FeldlN, Bilham R. 2006. Great Himalayan earthquakes and the Tibetan plateau. Nature, 444(7116): 165-170, doi: 10.1038/nature05199. |
| [7] | Guo Z, Gao X, Yao H J, et al. 2009. Midcrustal low-velocity layer beneath the central Himalaya and southern Tibet revealed by ambient noise array tomography. Geochemistry, Geophysics,Geosystems, 10(5): Q05007, doi: 10.1029/2009GC002458. |
| [8] | Hodges K V, Wobus C, Ruhl K, et al. 2004. Quaternary deformation, river steepening, and heavy precipitation at the front of the Higher Himalayan ranges. Earth Planet. Sci. Lett.220(3-4): 379-389. |
| [9] | Jouanne F, Mugnier J L, Gamond J F, et al. 2004. Current shortening across the Himalayas of Nepal. Geophysical Journal International, 157(1): 1-14. |
| [10] | Lavé J, Avouac J P. 2000. Active folding of fluvial terraces across the Siwaliks Hills, Himalayas of central Nepal. J. Geophys. Res.105(B3): 5735-5770. |
| [11] | Lindsey E, Natsuaki R, Xu X H, et al. 2015. Nepal Earthquake: line of sight deformation from ALOS-2 interferometry. Seismological Research Letters, in prep, http://topex.ucsd.edu/nepal. |
| [12] | Liu Z P, Ge Z X. 2015. Rupturing process of the MW7.9 Nepal earthquake inverted by the multi-array compressive sensing method. Chinese J. Geophys.(in Chinese), 58(6): 1891-1899, doi: 10.6038/cjg20150605. |
| [13] | Lu Q, Zhang Q, Sun J, et al. 2015. Coseismic deformation field of 2015 Nepal earthquake (MW7.8) detected by new generation satellite radar interferometry data. Progress in Geophysics (in Chinese), 0(0): 0-0, doi: 10.6038/pg20150400. |
| [14] | Ponraj M, Miura S, Reddy C D, et al. 2011. Slip distribution beneath the central and western Himalaya inferred from GPS observations. Geophysical Journal International, 185(2): 724-736. |
| [15] | Wang R, Motagh M, Walter T R. 2008. Inversion of slip distribution from co-seismic deformation data by a sensitivity-based iterative fitting (SBIF) method. EGU General Assembly 2008, 10, EGU2008-A-07971. |
| [16] | Zhan W, Wu Y Q, Liang H B, et al. 2015. Characteristics of the seismogenic model for the 2015 Nepal MW7.8 earthquake derived from GPS data. Chinese J. Geophys.(in Chinese), 58(5): 1818-1826, doi: 10.6038/cjg20150532. |
| [17] | Zhang B, Cheng H H, Shi Y L. 2015. Calculation of the co-seismic effect of MS8.1 earthquake, April 25, 2015, Nepal. Chinese J. Geophys.(in Chinese), 58(5): 1794-1803, doi: 10.6038/cjg20150529. |
| [18] | Zhang X, Xu L S. 2015. Inversion of the apparent source time functions for the rupture process of the Nepal MS8.1 earthquake. Chinese J. Geophys.(in Chinese), 58(6): 1881-1890, doi: 10.6038/cjg20150604. |
| [19] | Zhang Y, Xu L S, Chen Y T. 2015. Rupture process of the 2015 Nepal MW7.9 earthquake: Fast inversion and preliminary joint inversion. Chinese J. Geophys.(in Chinese), 58(5): 1804-1811, doi: 10.6038/cjg20150530. |
| [20] | 邓起东, 程绍平, 马冀等. 2014. 青藏高原地震活动特征及当前地震活动形势. 地球物理学报, 57(7): 2025-2042, doi: 10.6038/cjg20140701. |
| [21] | 刘志鹏, 盖增喜. 2015. 利用多台阵压缩传感方法反演尼泊尔MW7.9地震破裂过程. 地球物理学报, 58(6): 1891-1899, doi: 10.6038/cjg20150605. |
| [22] | 卢倩云, 郑茜, 孙建宝等. 2015. 基于新一代雷达卫星InSAR数据检测2015年尼泊尔MW7.8级地震的同震形变场. 地球物理学进展, 0(0): 0-0, doi: 10.6038/pg20150400. |
| [23] | 占伟, 武艳强, 梁洪宝等. 2015. GPS观测结果反映的尼泊尔MW7.8地震孕震特征. 地球物理学报, 58(5): 1818-1826, doi: 10.6038/cjg20150532. |
| [24] | 张贝, 程惠红, 石耀霖. 2015. 2015年4月25日尼泊尔MS8.1大地震的同震效应. 地球物理学报, 58(5): 1794-1803, doi: 10.6038/cjg20150529. |
| [25] | 张旭, 许力生. 2015. 利用视震源时间函数反演尼泊尔MS8.1地震破裂过程. 地球物理学报, 58(6): 1881-1890, doi: 10.6038/cjg20150604. |
| [26] | 张勇, 许力生, 陈运泰. 2015. 2015年尼泊尔MW7.9地震破裂过程: 快速反演与初步联合反演. 地球物理学报, 58(5): 1804-1811, doi: 10.6038/cjg20150530. |
 2015, Vol. 58

