2. 中国地震局地球物理研究所, 地震观测与地球物理成像重点实验室, 北京 100081
2. Key Laboratory of Seismic Observation and Geophysical Imaging, Institute of Geophysics, China Earthquake Administration, Beijing 100081, China
印度板块与欧亚大陆自50Ma以来的碰撞导致了青藏高原的不断隆升、地壳增厚及其物质侧向逃逸(Molnar and Tapponnier,1975; Rowley,1996; Royden et al.,2008).青藏高原东南缘是高原内部物质挤出的一个重要通道,这里强烈的造山运动和大型的走滑断裂活动使得该区域地质构造十分复杂、地震活动频繁.研究区位于青藏高原东南缘的南北地震带南段,是青藏高原与扬子克拉通的过渡地带,包含腾冲地块、保山地块、川滇菱形块体、扬子克拉通和多条近南北走向的走滑断裂带(图 1).另外,研究区西部的腾冲区域还是我国大陆年轻的近代火山活动区之一.利用远震P波走时层析成像,研究该区域的深部速度结构对揭示青藏高原的隆升机制和板块间的构造演化具有重要的科学意义.
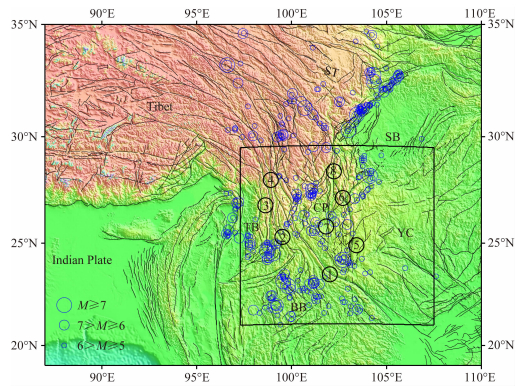 | 图 1 研究区位置及构造图(蔡麟孙等,2002;Liu et al.,2007) 图中黑色方框为研究区位置;蓝色圆圈为历史地震活动分布(数据来自:http://earthquake.usgs.gov/earthquakes/search/); ST:松潘—甘孜地体,SB:四川盆地,CP:川滇菱形块体,YC:扬子克拉通,TB:腾冲地块,BB:保山地块;①红河断裂,②澜沧江断裂,③怒江断裂,④金沙江断裂,⑤小江断裂,⑥则木河断裂,⑦绿汁江断裂,⑧安宁河断裂. Fig. 1 Study area and its tectonics The black rectangle indicates the study area. The blue circles suggest the epicenters of earthquakes occurred in this area (http://earthquake.usgs.gov/earthquakes/search/). ST: Songpan-Garzê terrane, SB: Sichuan basin, CP: Chuandian diamond block, YC: Yangtze craton, TB: Tengchong block, BB: Baoshan block. ① Red-river fault, ② Lancangjiang fault, ③ Nujiang fault, ④ Jinshajiang fault, ⑤ Xiaojiang fault, ⑥ Zemuhe fault,⑦ Lvzhijiang fault, ⑧ Anninghe fault. |
南北地震带南段地区的深部地球物理研究近年来得到了广泛关注,并取得了一些有益的研究进展.人们在该区域进行了多条人工地震测深剖面研究(Liu et al.,2006),给出了地壳内部的精细速度结构.考虑到人工地震测深剖面研究的局限,为能获取地壳和上地幔速度结构的整体异常形态,自20世纪90年代末以来,在青藏高原东南缘开展了接收函数(Xu et al.,2007; 李永华等,2009)、面波层析成像(Yao et al.,2008; Li et al.,2014)和体波走时层析成像(丁志峰等,1999;Huang et al.,2002; Wang et al.,2003)等研究,对南北地震带南段地区的壳幔结构取得了很多一致的认识.但受到地震台站分布不均匀和台站间距较大的影响,有待于利用台站分布均匀、密集的地震观测台阵对该区域开展进一步的深部速度结构成像研究.
2010年以来,随着科技部公益性行业科研专项“中国地震科学台阵探测—南北地震带南段”的启动与推进,大量的宽频带流动地震台站被布设到南北地震带南段地区.结合该区域已有的固定地震台站(郑秀芬等,2009),在南北地震带南段地区形成了密集的地震观测台阵(图 2),这为我们在该区域开展深部速度结构研究提供了可靠的数据保障.本文利用观测台阵记录的远震P波走时数据,进行了南北地震带南段深部的三维速度结构研究.
 | 图 2 台站分布 正方形为流动观测台站,三角为固定观测台站. Fig. 2 The distribution of stations The squares denote the portable stations, and the triangles denote the permanent stations. |
本文研究区的范围为21—29.5°N,97.3—107.5°E,位于图 1中黑色实线方框内.我们收集了由科技部公益性行业科研专项资助布设在南北地震带南段地区的356个流动地震观测台站和中国地震局省局区域地震台网中的90个固定台站所记录的远震事件波形数据.其中,固定台站选取的地震数据记录时间范围为2008年1月至2010年12月,而流动台站的地震数据记录时间范围为2011年8月至2013年5月.这些宽频带地震台站记录的波形数据信噪比较高,有利于我们开展远震P波走时层析成像研究.
依据美国地质调查局(USGS)提供的地震目录,我们按照IASP91速度模型(Kennett et al.,1991)计算每个远震事件到达各个台站的理论到时截取了P波波形.为能拾取准确、可靠的走时资料,保证反演质量,选取远震波形事件的原则为:(1)震中距要求在30°~90°之间,以减少地表效应和核幔边界复杂结构对P波走时产生的影响;(2)震级大于MS5.0,保证台站记录震中距较大的远震波形数据也具有较高的信噪比;(3)每个远震事件具有清晰P波初至记录的台站个数要大于10.然后,对筛选后的远震波形数据进行去均值、去倾斜、去仪器响应和带通滤波(0.02~0.1 Hz)等处理,采用波形互相关方法(VanDecar et al.,1990; Rawlinson et al.,2004; 张风雪等,2013a)拾取远震走时残差.最后,拾取到P波初至清晰的远震走时数据共88691个.符合要求的远震事件共827个,其震中位置的分布如图 3所示,从图中可以看出这些远震事件具有较好的方位角覆盖范围.
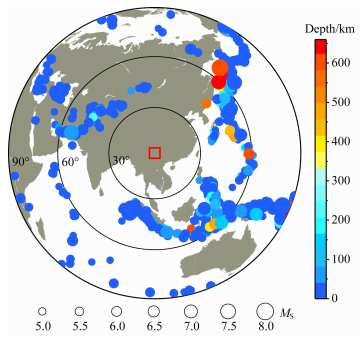 | 图 3 地震事件分布 Fig. 3 The distribution of the epicenters |
本研究中采用FMTT(Fast marching Teleseismic)走时层析成像的方法进行速度结构反演,研究南北地震带南段深部的速度结构特征.FMTT走时层析成像是近些年发展起来的一种新的研究地球内部速度结构的方法,在国内外均得到了很多不错的研究成果(Rawlinson et al.,2006,2008; 张风雪等,2013b).该方法通过FMM(Fast Marching Method)来进行射线追踪,以求解程函方程的数值解来获取射线路径(Rawlinsion et al.,2006),从而具有快速高效、无条件稳定的特点,其核心思想是利用由波前节点组成的窄带模拟波前曲面的演化.在反演计算时,本文采用带阻尼的最小二乘(LSQR)反演算法(Paige et al.,1982),LSQR反演算法可以高效的进行大型稀疏矩阵反演.
3 反演的可靠性地球物理反演问题存在解的不唯一性,对反演结果可靠性的评价分析是非常必要的.本文将从检测板测试、阻尼因子选择和反演前后相对走时残差分布等三个方面对反演结果的可靠性进行评价,以检验反演结果的可靠性.
3.1 检测板分辨测试在检测板分辨测试时,地震台站、远震事件及其相应的射线分布与实际的反演计算应完全一致.在初始模型上加±3%的速度扰动,计算合成各个台站的理论相对走时残差,然后将该走时残差作为已知量,以未加扰动的模型作为参考模型,采用与实际观测数据反演时相同的反演参数进行反演计算,将反演得到的模型与加了扰动的模型相比,其能够分辨出的最小异常尺度就是该检测板测试的分辨率.
本次反演中模型的网格参数化采用等间隔的方式划分:水平方向网格大小0.5°×0.5°,垂直方向的深度间隔则为50 km.经过反复的检测板测试,我们发现在输入两倍于原本网格划分尺度的正负异常大小时,可以得到很好的恢复,这说明本次反演中能够分辨的异常体尺度为1°×1°×100 km.图 4为不同深度上的检测板测试结果,我们可以从图中明显的看到,在400 km深度内研究区大部分区域都具有较好的分辨能力,只是在50和100 km较浅的深度上受台站分布的影响,研究区的边缘地区分辨较差.通过检测板测试表明,本研究的反演结果分辨能力较高,具有一定的可信度.
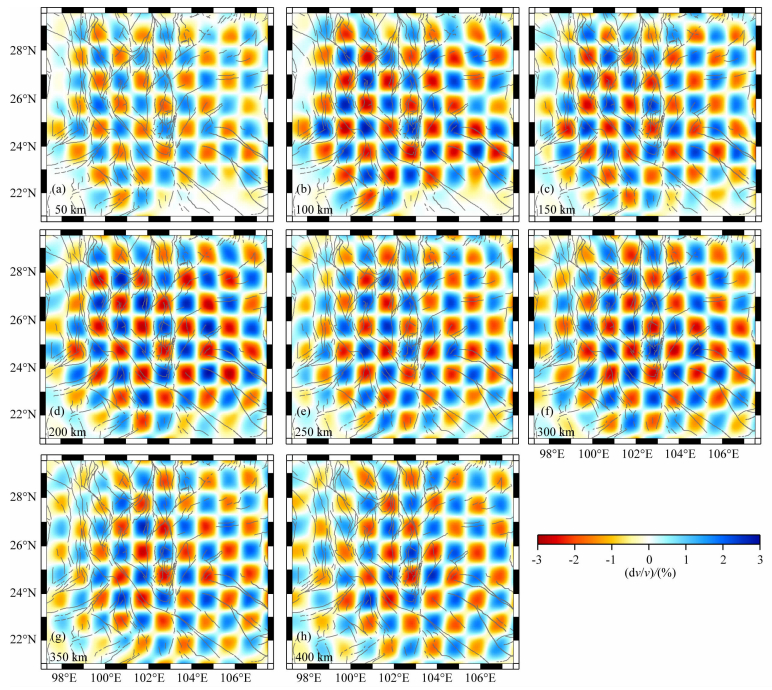 | 图 4 检测板分辨率测试结果 Fig. 4 The results of the checkboard resolution test |
本次层析成像反演计算采用的是带阻尼的LSQR算法(Paige et al.,1982),阻尼因子的选择影响着结果的可靠性.最佳的LSQR反演结果应同时使得模型方差和数据走时残差方差最小.反演计算时,选取不同的阻尼因子会让反演后的模型方差与数据走时残差方差呈现此消彼长的变化.那么,要得到最佳的反演结果,就要选取合适的阻尼因子,其选取往往通过模型方差和数据走时残差方差的折衷曲线来确定.图 5给出了本次反演的模型方差和数据走时残差方差的折衷曲线,根据该曲线,最后确定15是最为理想的阻尼因子.
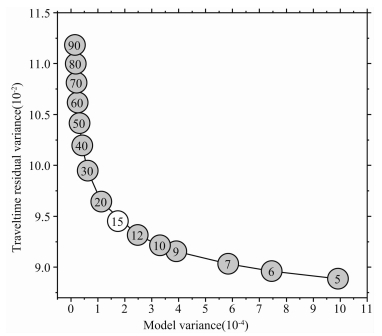 | 图 5 阻尼因子折衷曲线 圆圈里的数字为阻尼因子值,15是最终选取的阻尼因子. Fig. 5 The tradeoff curve for the damping factor The numbers in the circles indicate the damping factors, and we select 15 as final damping factor. |
图 6为研究区内射线路径和各个台站的平均走时残差分布.其中,图 6(a—d)分别为来自研究区东北、东南、西南和西北等四象限内的射线路径和相应各个台站的平均走时残差,而图 6e为研究区内88691条射线路径的分布和每个台站的平均走时残差.由图 6中的射线路径和各个台站的平均走时残差分布可以看出,射线路径的方向对台站的平均走时残差影响较小.在图 6(a—d)中,研究区东北部为四川盆地地区,基本都分布着正的走时残差;研究的西北部为青藏高原,南部区域为保山块体和扬子克拉通南部,这些地区则分布着负的走时残差.本次反演中均匀、密集的射线分布保证了反演结果的可靠性.图 7是反演前后走时残差的统计结果.图 7a为反演前的走时残差,其主要集中在-1.0~0.8 s的范围内;而反演后的走时残差则大部分集中于-0.5~0.5 s之间(图 7b),并呈正态分布,这也表明经过反演后初始模型朝着“能拟合走时异常的模型”演化,而不是背离(张风雪等,2013b).
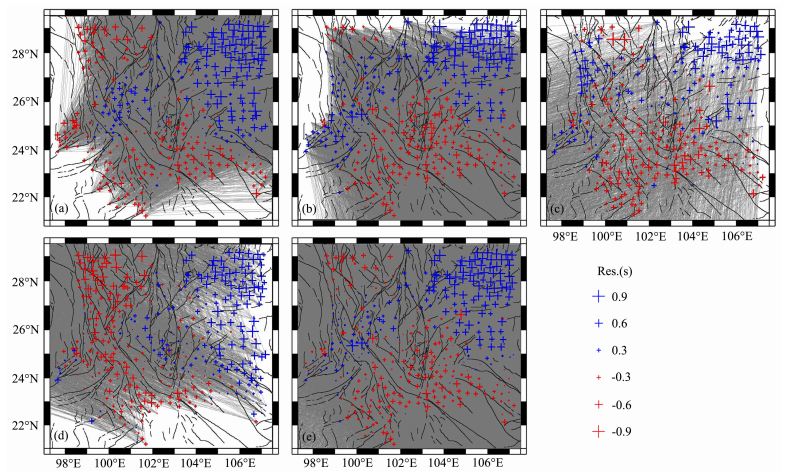 | 图 6 平均走时残差分布 蓝色十字表示正的走时残差,红色十字表示负的走时残差;灰线表示射线路径;(a)、(b)、(c)和(d)分别为地震分别于东北、东南、西南和西北方向时的平均走时残差分布;(e)为所有走时数据平均走时残差. Fig. 6 Distributions of the average traveltime residuals at every seismic station The blue and red crosses denote the early and delayed arrivals respectively. The gray lines denote the P-wave rays from the epicenters. (a), (b), (c) and (d) present the distributions of the average traveltime residuals from four different quadrants; (e) is the distributions of the all average traveltime residuals. |
 | 图 7 反演前(a)、后(b)走时残差统计 Fig. 7 The statistic of the traveltime residuals before (a) and after (b) inversion |
以全球一维速度模型IASP91(Kennett et al.,1991)作为初始参考模型,本文应用FMTT走时层析成像反演方法获取了南北地震带南段的P波速度结构.图 8是研究区400 km深度内的P波速度结构水平分布,图 9给出了沿图 8a中路径AA′、BB′和CC′的P波速度结构剖面.本文所得的结果反映了研究区深部结构具有十分显著的不均匀性.
 | 图 8 速度结构水平切片 (a)中AA′、BB′和CC′表示图9中三条剖面的位置;TC表示腾冲火山区位置. Fig. 8 Horizontal slices of the velocity structure Lines AA′, BB′ and CC′ indicate the locations of the vertical profiles shown in Fig.9. TC: Tengchong volcano. |
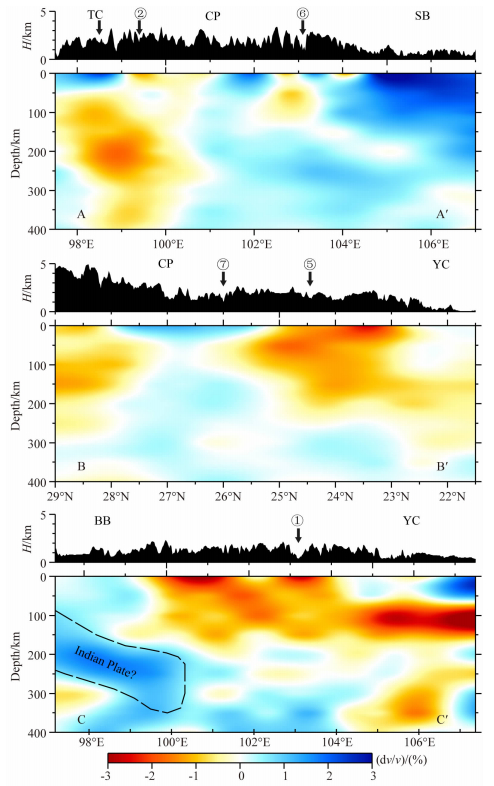 | 图 9 速度结构垂直剖面 地形图中的字符含义同图1. Fig. 9 Vertical profiles of the velocity structure The meanings of the characters in topographic profiles are the same as Fig.1. |
在水平切片中(图 8),研究区东北部的四川盆地地区呈现较明显的高速异常,并向下延伸至近300 km的深度;研究区西北部的青藏高原地区在350 km深度内存在较强的低速异常,随着深度的增加,该低速异常逐渐向研究区西北方向缩小;在腾冲火山地区,400 km以浅的深度上均分布着明显的低速异常;在川滇菱形块体周边的断裂带地区,100~150 km深度的切片上可以见到沿着断裂带走向的条带状低速异常,而川滇菱形块体内部在150~400 km深度内都呈高速异常;研究区东南部的扬子克拉通地区,在50~200 km深度内分布着较大面积的低速异常,该低速异常在50~100 km深度上与川滇菱形块体周围低速异常相连,直至研究区西北部的青藏高原地区;研究区西南部的保山地块从150 km深度开始,随着深度增加至400 km,高速异常从保山地块西部逐渐向东部扩展.
在图 9中,剖面AA′西起腾冲地块,经过腾冲火山地区,横跨川滇菱形块体后进入四川盆地,腾冲火山下方可见明显的低速异常,而四川盆地300 km深度以上为显著的高速异常;剖面BB′从川滇菱形块体北部的青藏高原东南部起经过小江断裂带,到达扬子克拉通南部地区,在该剖面中可见高原下方为低速异常,川滇菱形块体区域为高速异常,而从小江断裂带至扬子克拉通下方为低速异常;剖面CC′为沿着纬度23°的垂直剖面,它西部为保山地块,东部为扬子克拉通,该剖面中扬子克拉通下方100~150 km深度上分布着一条低速异常带,保山地块东部至红河断裂带下方150 km深度内为低速异常,保山地块下方存在一东向俯冲的高速异常带.
4.1 腾冲火山腾冲地块位于怒江断裂带以西,是一个狭长的微大陆.在第三纪初,腾冲地块处于印度板块和欧亚板块的碰撞带上,之后一直处于强烈的构造活动之中,这也导致腾冲地区的岩浆活动十分强烈.腾冲地区火山岩属于高钾性岩系,熔岩源区为俯冲带再循环的富集地幔(邓万明,2003).在腾冲地区已经开展的地球物理研究表明,腾冲地区具有高热流值(阚荣举等,1996;Hu et al.,2000)、低电阻率(孙洁等,1989;Bai et al.,2001)、低Q值(Qin et al.,1998; 胡家富等,2003)和低波速(Li et al.,2008; Lei et al.,2009; Wang et al.,2010; Yang et al.,2014)等特征.
在本研究中,腾冲火山地区分布着明显的低速异常.图 8的P波速度异常水平切片和图 9a穿过腾冲地区的垂直剖面显示了腾冲火山地区在50~400 km深度上低速异常的分布形态特征.在腾冲火山地区,已有的地震层析成像研究基本上都获得了腾冲火山下方低速异常的分布,但该低速异常的形态和向下延伸的深度范围却不尽相同.Li等(2008)反演的P波速度结构显示,腾冲火山下方的低速异常向下仅延伸至约150 km的深度.Yang等(2014)的层析成像结果中,该低速异常延伸至约300 km的深度.显然,本研究中腾冲火山下方低速异常的深度范围大于Li等(2008)和Yang等(2014)获取的结果.Lei等(2009)和Wang等(2010)的研究结果分别给出了腾冲火山下方低速异常延伸至400 km及以上的深度,该结果与本文获得的低速异常分布更为相近.
4.2 四川盆地四川盆地属于上扬子地台的一部分,四周为高山环绕,内部为低山丘陵,该盆地基底为中晚古代固结的产物(江为为等,2001).在图 8和图 9a中,四川盆地西南地区300 km深度内分布着不同程度的高速异常.在四川盆地地区,已有的层析成像结果(Huang et al.,2006;Yao et al.,2008;Wang et al.,2010;Yang et al.,2014)均显示该区域上地幔部分为高速异常,但不同的结果给出的高速异常分布也存在差异.Yao等(2008)应用面波层析成像发现该区域下方250 km以上分布着高速异常.Huang等(2006)在对中国大陆的层析成像研究中,四川盆地下方的高速异常深达300 km,这和Yang等(2014)反演得到的四川盆地地区高速异常深度范围相一致.在Wang等(2010)南北地震带地区的层析成像结果中,四川盆地下方的高速异常可延伸至400 km以下的深度.根据本文所获取的速度结构,四川盆地西南部下方的高速异常向下可追溯至约300 km的深度,这一结果与Huang等(2006)和Yang等(2014)的结果较为相似,该高速异常也说明四川盆地是非常稳定的块体.
4.3 上地幔顶部的速度异常由于印度板块和欧亚板块的连续碰撞,导致了碰撞区数千公里的地壳缩短、青藏高原地壳增厚和整体抬升,该变形被沿着大型走滑断裂的逃逸运动所吸收,同时也造成高原岩石圈物质向东南流出(Rowley,1996; Tapponnier et al.,2001; Royden et al.,2008).两大板块的碰撞在缅甸区域形成了南北向的弧形造山带,已有的研究(胡家富等,2008; Lei et al.,2009; Yang et al.,2014)证明了印度板块在东北方向沿着缅甸弧向欧亚板块俯冲的高速异常是普遍存在的.
图 8(a—c)为50~150 km深度的P波速度异常水平分布,图 9(b—c)分别为沿剖面BB′和CC′的速度异常垂直分布.图中显示在50至150 km的深度上沿川滇菱形块体周边的大型断裂带分布着较强的低速异常,特别是小江断裂以西、红河断裂以北以及二者的交汇处具有较强低速度异常.其中红河断裂下方的低速异常向下延伸至150 km深度,而小江断裂与红河断裂交汇处的低速异常深达200 km以上(图 8和9).另外,扬子克拉通南部分布着近东西向的显著低速异常.Zhang等(2004)由GPS观测研究指出,川滇菱形块体以较大的速率向东南方向滑移.Wei等(2010)的地震层析成像结果指出川滇菱形块体是青藏高原物质向东南方向挤出的重要通道.常利军等(2006)和Wang等(2008)在该区域研究得到的SKS波分裂结果表明,各项异性的快波方向在川滇菱形块体地区为近南北向,川滇菱形块体南端的保山地块和扬子克拉通南部地区则呈近东西向,这也与文中上地幔顶部的低速异常分布较为相近.综合已有的研究结果和本文的结果,青藏高原物质不仅存在地壳物质流,而且存在大尺度的上地幔物质向东南方向流出的可能.在本文中,沿小江断裂和红河断裂分布的上地幔顶部低速异常为青藏高原物质向东南方向挤出提供了必要的通道.
在图 9c中,保山地块100 km深度以下存在一东倾的带状高速异常,下插到研究区西南部下方.胡家富等(2008)应用面波资料反演了缅甸弧及邻区的S波速度结构,给出了体现印度板块俯冲的高速异常分布和印度板块向东俯冲的动力学模型.Lei等(2009)的层析成像结果清晰的显示了印度板块向东俯冲的高速异常,并用印度板块俯冲模型解释了腾冲火山和研究区内的地震构造.Yang等(2014)指出印度板块向东俯冲高速异常深至地幔转换带,并延伸到东经106°附近.这些结果表明,在川滇地区下方所观测的高速异常是印度板块岩石圈向东俯冲体现.根据俯冲板块的平均下沉速度,Richards等(2007)估算了印度板块俯冲到不同深度时所需要的时间.Replumaz等(2004;2010)基于地震层析成像给出的俯冲岩石圈形态重构了50 Ma以来印度板块和欧亚板块的地质碰撞过程,并指出俯冲板块约40 Ma可俯冲1100 km的深度,其速率在地幔转换带以上可达约5 cm·a-1.综合本文和前人的结果(Lei et al.,2009; Yang et al.,2014;Replumaz et al.,2004; 2010),保山地块下方的高速异常在时间和空间上约束了印度板块的俯冲.本文所获取的高速异常条带符合前人对印度板块向东俯冲的解释(胡家富等,2008; Lei et al.,2009; Yang et al.,2014; Richards et al.,2007; Replumaz et al.,2004; 2010).
5 结论利用南北地震带南段的90个固定台站和356个流动台站所记录远震波形数据,本文采用波形互相关方法共提取了88691个远震P波走时残差数据,应用FMTT走时层析成像方法获取了研究区内的P波速度结构.本文获得的三维P波速度结构显示研究区深部结构具有较强的不均匀性.
经过分析和讨论,我们得到以下几点认识:1)腾冲火山地区深部存在明显的低速异常,在400 km以浅的深度内均可见该低速异常分布;2)四川盆地西南部下方具有较强的高速异常,该高速异常向下可追溯至约300 km的深度;3)在上地幔顶部,沿川滇菱形块体周边的大型断裂带及川滇菱形块体南端分布着显著的低速异常,这些低速异常为青藏高原物质向东南方向挤出提供了必要的通道;4)保山地块下方的高速异常向东斜插到川滇地区下方,该高速异常是印度板块岩石圈向东俯冲的体现.
致谢 感谢中国地震局地球物理研究所国家数字测震台网数据备份中心(doi:10.7914/SN/CB)为本研究提供地震波形数据.衷心感谢审稿专家提供的宝贵修改意见.
| [1] | Bai D H, Unsworth M J, Meju M A, et al. 2010. Crustal deformation of the eastern Tibetan plateau revealed by magnetotelluric imaging. Nature Geosci., 3: 358-362. |
| [2] | Cai L S, Li X L. 2002. Geology of Yunnan province. In: Ma L F (ed). Geological Atlas of China. Geological Publishing House, Beijing (in Chinese). |
| [3] | Chang L J, Wang C Y, Ding Z F. 2006. A study on SKS splitting beneath the Yunnan region. Chinese J. Geophys. (in Chinese), 49(1): 197-204. |
| [4] | Deng W M. 2003. Cenozoic volcanic activity and its geotectonic background in west China-Formative excitation mechanism of volcanic rocks in Qinghai-Xizang and adjacent districts. Earth Science Frontiers (in Chinese), 10(2): 471-478. |
| [5] | Ding Z F, He Z Q, Sun W G, et al. 1999. 3-D crust and upper mantle velocity structure in eastern Tibetan plateau and its surrounding areas. Chinese J. Geophys. (in Chinese), 42(2): 197-205. |
| [6] | Hu J F, Cong L L, Su Y J, et al. 2003. Distribution characteristics of Q value of the Lg coda in Yunnan and its adjacent regions. Chinese J. Geophys. (in Chinese), 46(6): 809-813. |
| [7] | Hu J F, Hu Y L, Xia J Y, et al. 2008. Crust-mantle velocity structure of S wave and dynamic process beneath Burma Arc and its adjacent regions. Chinese J. Geophys.(in Chinese), 51(1): 140-148. |
| [8] | Hu S B, He L J, Wang J Y. 2000. Heat flow in the continental area of China: a new data set. Earth Planet. Sci. Lett., 179(2): 407-419. |
| [9] | Huang J L, Zhao D P, Zheng S H. 2002. Lithospheric structure and its relationship to seismic and volcanic activity in southwest China. J. Geophys. Res., 107(B10,2255): doi:10.1029/2000JB000137. |
| [10] | Huang J L, Zhao D P. 2006. High-resolution mantle tomography of China and surrounding regions. J. Geophys. Res., 111(B09305): doi:10.1029/2005JB004066. |
| [11] | Jiang W W, Liu Y K, Hao T Y, et al. 2001. Comprehensive study of geology and geophysics of Sichuan basin. Progress in Geophysics (in Chinese), 16(1): 11-23. |
| [12] | Kan R J, Zhao J M, Kan D. 1996. The tectonic evolution and volcanic eruption in Tengchong volcano-geothermic region. Seismological and Geomagnetic Observation and Research (in Chinese), 17: 28-33. |
| [13] | Kennett B L N, Engdahl E R. 1991. Traveltimes for global earthquake location and phase identification. Geophys. J. Int., 105(2): 429-465. |
| [14] | Lei, J., Zhao D P, Su Y. 2009. Insight into the origin of the Tengchong intraplate volcano and seismotectonics in southwest China from local and teleseismic data. J. Geophys. Res., 114, no. B05302, doi: 10.1029/2008JB005881. |
| [15] | Li C, van der Hilst R D, Meltzer A S, et al. 2008. Subduction of the Indian lithosphere beneath the Tibetan plateau and Burma. Earth Planet. Sci. Lett., 274: 157-168. |
| [16] | Li Y H, Pan J T, Wu Q J, et al. 2014. Crustal and uppermost mantle structure of SE Tibetan plateau from Rayleigh-wave group-velocity measurements. Earthquake Science, 27(4): 411-419. |
| [17] | Li Y H, Wu Q J, Tian X B, et al. 2009. Crustal structure in the Yunnan region determined by modeling receiver functions. Chinese J. Geophys. (in Chinese), 52(1): 67-80. |
| [18] | Liu M J, Mooney W D, Li S L, et al. 2006. Crustal structure of the northeastern margin of the Tibetan plateau from the Songpan-Ganzi terrane to the Ordos basin. Tectonophysics, 420(1-2): 253-266. |
| [19] | Liu M, Yang Y Q, Shen Z K, et al. 2007. Active tectonics and intracontinental earthquakes in China: The kinematics and geodynamics. The Geological Society of America, 425(19): 299-318. |
| [20] | Molnar P, Tapponnier P. 1975. Cenozoic tectonics of Asia: effects of a continental collision. Science, 189: 419-426. |
| [21] | Paige C C, Saunders M A. 1982. LSQR: An algorithm for sparse linear equations and sparse least squares. ACM Trans. Math. Softw., 8(1): 43-71. |
| [22] | Qin J, Huangfu G, Zhang J. 1998. Characteristics of Q values around Tengchong volcano and adjacent areas. J. Seismol. Res., 21: 358-361. |
| [23] | Rawlinson N, Kennett B L N. 2004. Rapid estimation of relative and absolute delay times across a network by adaptive stacking. Geophys. J. Int., 157: 332-340. |
| [24] | Rawlinson N, Kennett B L N. 2008. Teleseismic tomography of the upper mantle beneath the southern Lachlan Orogen. Phys. Earth Planet. Inter., 167, 84-97. |
| [25] | Rawlinson N, Reading A M. Kennett B L N. 2006. Lithospheric structure of Tasmania from a novel form of teleseismic tomography. J. Geophys. Res., 111, B02301, doi:10.1029/2005JB003803. |
| [26] | Replumaz A, Kárason H, van der Hilst R D, et al. 2004. 4-D evolution of SE Asia's mantle from geological reconstructions and seismic tomography. Earth and Planetary Science Letters, 221(1-4): 103-115. |
| [27] | Replumaz A, Negredo A M, Guillot S, et al. 2010. Multiple episodes of continental subduction during India/Asia convergence: Insight from seismic tomography and tectonic reconstruction. Tectonophysics, 483(1-2): 125-134. |
| [28] | Richards S, Lister L, Kennett B. 2007. A slab in depth: Three-dimensional geometry and evolution of the Indo-Australian plate. Geochem. Geophys. Geosyst., 8(12): doi:10.1029/2007GC001657. |
| [29] | Rowley, D. B., 1996. Age of initiation of collision between India and Asia: a review of stratigraphic data. Earth Planet. Sci. Lett., 145: 1-13. |
| [30] | Royden L, Burchfie B C, van der Hilst R D. 2008. The Geological Evolution of the Tibetan Plateau. Science, 321: 1054-1058. |
| [31] | Sun J, Xu C F, Jiang Z, et al. 1989. The electrical structure of the crust and upper mantle in the west part of Yunnan province and its relation to crustal tectonics. Seismology and Geology (in Chinese), 11(1): 35-45. |
| [32] | Tapponnier P, Xu Z Q, Roger F, et al. 2001. Oblique stepwise rise and growth of the Tibet plateau. Science, 294: 1671-1677. |
| [33] | VanDecar J C, Crosson R S. 1990. Determination of teleseismic relative phase arrival times using multi-channel cross-correlation and least squares. Bull. Seismol. Soc. Am., 80(1): 150-169. |
| [34] | Wang C Y, Chan W W, Mooney W D. 2003. Three-dimensional velocity structure of crust and upper mantle in southwestern China and its tectonic implications. J. Geophys. Res., 108(B9): 176-193. |
| [35] | Wang C Y, Flesch L M, Silver P G, et al. 2008. Evidence for mechanically coupled lithosphere in central Asia and resulting implications. Geology, 36(5): 363-366. |
| [36] | Wang Z, Zhao D P, Wang J. 2010. Deep structure and seismogenesis of the north-south seismic zone in southwest China. J. Geophys. Res., 115(B12334): doi: 10.1029/2010JB007797. |
| [37] | Wei W, Sun R M, Shi Y L. 2010. P-wave tomographic images beneath southeastern Tibet: Investigating the mechanism of the 2008 Wenchuan earthquake. Science in China Series D: Earth Sciences, 53 (9): 1252-1259. |
| [38] | Xu L L, Rondenay S, Van der Hilst R D. 2007. Structure of the crust beneath the southeastern Tibetan Plateau from teleseismic receiver functions. Phys. Earth Planet. Inter., 165: 176-193. |
| [39] | Yang T, Wu J P, Fang L H, et al. 2014. Complex Structure beneath the Southeastern Tibetan Plateau from Teleseismic P-Wave Tomography. Bulletin of the Seismological Society of America, 104(3), 1056-1069. |
| [40] | Yao H. J., Beghein C., ven der Hilst R. D., 2008. Surface wave array tomography in SE Tibet from ambient seismic noise and two-station analysis-II. Crustal and upper-mantle structure. Geophys. J. Int., 173: 205-219 |
| [41] | Zhang F X, Wu Q J, Li Y H, et al. 2013a. Pick up the teleseismic relative traveltime residuals by wave form correlation based on the GUI. Seismological and Geomagnetic Observation and Research (in Chinese), 34: 58-64. |
| [42] | Zhang F X, Wu Q J, Li Y H. 2013b. The traveltime tomography study by teleseismic P wave data in the Northeast China area. Chinese J. Geophys. (in Chinese), 56(8): 2690-2700. |
| [43] | Zhang P Z, Shen Z K, Wang M, et al. 2004. Continuous deformation of the Tibetan Plateau from global positioning system data. Geology, 32(9): 809-812. |
| [44] | Zheng X F, Ouyang B, Zhang D N, et al. 2009. Technical system construction of Data Backup Centre for China Seismograph Network and the data support to researches on the Wenchuan earthquake. Chinese J. Geophys.(in Chinese),52(5): 1412-1417. |
| [45] | 蔡麟孙,李兴林. 2002. 云南省地质.见: 马丽芳主编. 中国地质图集. 北京: 地质出版社. |
| [46] | 常利军, 王椿镛, 丁志峰. 2006. 云南地区SKS波分裂研究. 地球物理学报, 49(1): 197-204. |
| [47] | 邓万明. 2003. 中国西部新生代火山活动及其大地构造背景—青藏及邻区火山岩的形成机制. 地学前缘,10(2): 471-478. |
| [48] | 丁志峰,何正勤,孙为国等. 1999. 青藏高原东部及其边缘地区的地壳上地幔三维速度结构. 地球物理学报,42(2):197-205. |
| [49] | 胡家富, 胡毅力, 夏静瑜等. 2008. 缅甸弧及邻区的壳幔S波速度结构与动力学过程. 地球物理学报, 51(1): 140-148. |
| [50] | 胡家富,丛连理,苏有锦等. 2003. 云南及周边地区Lg尾波Q值的分布特征. 地球物理学报, 46(6): 809-813. |
| [51] | 江为为, 刘伊克, 郝天珧等. 2001. 四川盆地综合地质、地球物理研究. 地球物理学进展, 16(1): 11-23. |
| [52] | 阚荣举,赵晋明,阚丹. 1996. 腾冲火山地热区的构造演化与火山喷发. 地震地磁观测与研究,17: 28-33. |
| [53] | 李永华,吴庆举,田小波等. 2009. 用接收函数方法研究云南及其邻区地壳上地幔结构. 地球物理学报,52(1):67-80. |
| [54] | 孙洁,徐常芳,江钊等. 1989. 滇西地区地壳上地幔电性结构与地壳构造活动的关系. 地震地质,11(1): 35-45. |
| [55] | 张风雪,吴庆举,李永华等. 2013a. 基于图形界面的波形相关法拾取远震相对走时残差. 地震地磁观测与研究,34: 58-64. |
| [56] | 张风雪, 吴庆举, 李永华. 2013b. 中国东北地区远震P波走时层析成像研究. 地球物理学报, 56(8): 2690-2700. |
| [57] | 郑秀芬,欧阳飚,张东宁等. 2009. “国家数字测震台网数据备份中心”技术系统建设及其对汶川大地震研究的数据支撑. 地球物理学报,52(5): 1412-1417. |
 2015, Vol. 58

