 2015, Vol. 58


2. 中国地震局地球物理研究所, 地震观测与地球物理成像重点实验室, 北京 100081;
3. 中国地震局第一监测中心, 天津 300180
2. Key Laboratory of Seismic Observation and Geophysical Imaging, Institute of Geophysics, China Earhtquake Administration, Beijing 100081, China;
3. First Crust Monitoring and Application Center of China Earthquake Administration, Tianjin 300180, China
The tomographic method was used to estimate the crustal and mantle structure beneath the SNSZ. A two-step inversion scheme was adopted to obtain the S-wave velocity structure. Firstly, we constructed phase velocity distributions by inverting pure path dispersions of Love wave at different periods. Secondly, we determined the S-wave velocity structure at different depths from the acquired phase velocities.
We collected the seismic waveform data recorded between January 2008 and March 2011 by 292 stations from the Chinese Provincial Digital Seismic Networks, measured the Love wave phase velocity dispersion curves with Frequency-Time Analysis and constructed the distributions of the Love wave phase velocity beneath the SNSZ. From the pure path dispersions of Love wave phase velocity, the one-dimension S-wave velocity was inverted by the linearized inversion program at each node on a 0.25°×0.25° grid. Then these one-dimension S-wave velocity were assembled together to obtain the three-dimension S-wave velocity structure.
Our results suggested that the significantly low velocity layer of S-wave existed in Songpan-Garzê terrane and Chuandian diamond block. The characteristic of the low velocity anomaly supported the lower crust flow model for explaining the uplift of the Tibetan plateau and its crustal materials movement. The high S-wave velocity anomaly was presented in northwestern Chuandian diamond block at the depth 100 to 120 km, which maybe attribute to the underthrust plate of the India lithosphere along the Himalayas east structural knot. The obvious comparison between the weak lower crust with the low S-wave velocity and the hard upper mantle with high S-wave velocity maybe imply the different tectonic movement and deformation mode between the crust and upper mantle, which provided the condition for the dynamic decoupling of the crust and mantle beneath the northwestern Chuandian diamond block.
南北地震带位于青藏高原东部地区,是一条纵贯中国大陆的地貌分界带,也是分割东部相对稳定块体与西部强烈隆升高原之间的边界活动构造带.这里的地震活动性非常高,1970年以来发生的5级以上地震达6百多次,区域构造也十分复杂,包含多个地质构造单元(图 1a).该区北起阿拉善块体和鄂尔多斯块体,跨越祁连造山带和秦岭—大别造山带,穿过松潘—甘孜地体和四川盆地,经过川滇菱形块体和扬子克拉通西部向南至云南南部区域(邓起东等,2002;张家声等,2003;黄忠贤等,2013).
 | 图 1 研究区位置及台站分布 (a) 黑色矩形框为研究区位置;红色圆圈表示研究区内1970年以来5级以上地震的震中;AL为阿拉善块体;OR为鄂尔多斯块体;QL为祁连造山带;QD为秦岭—大别造山带;ST为松潘—甘孜地体;SB为四川盆地;CP为川滇菱形块体;YC为扬子克拉通;QB为柴达木盆地;TB为塔里木盆地;(b) 黑色、蓝色和红色三角形分别表示研究区内宽频带、甚宽频和超宽频地震计的台站位置.Fig. 1 The location of the study area and the distribution of stations (a) The dashed rectangle denotes the location of the study area. The red circles are the epicenters of the earthquakes with magnitude over MS5.0 occurred in the study area since 1970s. AL, Alashan block; OR, Ordos block; QL, Qilian orogen; QD, Qinling-Dabie orogen; ST, Songpan-Ganzi terrane; SB, Sichuan basin; CP, Chuandian diamond block; YC, Yangtze craton; QB, Qaidam basin; TB, Tarim basin. (b) The black, blue and red triangles present the location of the broadband, very broadband and ultra broadband stations in the study area, respectively. |
受印度岩石圈板块不断向青藏高原下方俯冲作用的影响,青藏高原不断隆起及向周围生长,其岩石圈变形强烈,地壳厚度两倍于正常地壳.同时,相邻的稳定地块对青藏高原的隆起和运动也起到一定的制约作用(Tapponnier et al.,2001;Wang et al.,2001;Zhang et al.,2004).本文的研究区便处于青藏高原向东、东南和东北方向的生长区与相邻稳定块体阻挡而发生强相互作用的区域.这里被认为是研究和探索印度板块与欧亚板块碰撞远程效应的场所(张家声等,2003).获取南北地震带地区的壳幔结构对揭示该区域的深部构造、不同块体的深层耦合关系和青藏高原的隆升机制及其与相邻块体的相互作用等地球动力学问题具有重要的科学意义.
面波层析成像是研究地球壳幔结构的一种有效方法.近些年来,人们利用面波频散资料在南北地震带地区开展了很多的研究工作,对壳幔结构的研究取得了一系列成果(李白基等,1989;何正勤等,1990;庄真等,1992;朱良保等2002;苏伟等,2002;张雪梅等,2007;黄忠贤等,2013;Li et al.,2009,2010;Xu et al.,2011;Zhou et al.,2012).早在20世纪,利用Rayleigh波群速度频散资料,前人便对南北地震带及邻近区域不同地质构造单元的深部结构进行了研究(李白基等,1989;何正勤等,1990;庄真等,1992),但由于所用的台站数量少,结果的分辨率较低.进入本世纪后,面波资料得到了不断累积,朱良保等(2002)、苏伟等(2002)和张雪梅等(2007)分别给出了该区内岩石圈尺度的面波层析成像结果,其横向分辨率在5°以内.黄忠贤等(2013)应用面波成像方法反演了南北地震带区域地壳上地幔的三维S波速度结构,讨论了不同块体的结构特征,并指出了青藏高原东缘下地壳存在低速层.地震背景噪声成像近年来得到迅速发展,相比于天然地震资料,能够更好地分辨地壳的结构信息,Li等(2009,2010)、Xu等(2011)和Zhou等(2012)利用背景噪声资料提取了面波频散,获取了南北地震带不同区域内的壳幔S波速度结构,也揭示了在松潘—甘孜地体和川滇菱形块体的中下地壳存在着低速层.
上述的面波成像研究工作给出了南北地震带地区壳幔结构的基本特征,本文将收集更多的台站数据,提取Love波的相速度频散曲线,试图进一步研究南北地震带地区的壳幔结构,对其深部构造和动力学意义进行探讨.“十五”期间中国地震观测系统得到了迅速发展,特别是在南北地震带这一重点地震监视区,地震台站布设得非常密集(郑秀芬等,2009).本文收集了该区内231个宽频带、57个甚宽频带和4个超宽频带数字地震台站(图 1b)的面波数据,这为本文开展Love波相速度成像研究提供了有利的数据保障.
2 数据资料和处理2.1 数据资料我们收集了南北地震带区域国家数字地震台网中292个台站(其中,231个宽频带、57个甚宽频带和4个超宽频带台站)的三分量地震事件波形数据,时间范围为2008年1月至2011年3月.图 1b给出了这些台站在研究区内的分布.
2.2 数据预处理本文采用双台法测量面波的相速度频散曲线.双台法无需考虑震源定位误差、发震时刻误差和初始相位等因素,仅要求两个台站与震源大致位于同一条大圆弧路径上,且震中距远大于台站间距,便可以测量到可靠的频散曲线.为减小近源效应和高阶面波干涉的不利影响,我们要求震中距在20°至75°之间.另外,地震面波震级大于5.0且震源深度小于50 km,以保证面波波形具有较高的信噪比.台站对间距越小,频散测量的误差越大,为使相速度频散曲线测量的误差较小,我们设定最小的台站对间距为300 km.之后,我们对波形数据进行重采样、去均值、去倾斜和去仪器响应等处理,再对配好对的台站波形数据进行互相关计算,以求取台站对间的格林函数.至此,我们便可以进行Love波频散曲线的测量.
2.3 频散曲线测量频时分析(Frequency-Time Analysis)是一种基于图像分析的快速提取相速度频散曲线的方法(Bensen et al.,2007).该方法可以快速提取相速度频散曲线,且具有较高的测量精度,被广泛应用在基于背景噪声资料的相速度频散曲线提取中(Lin et al.,2008; Zhou et al.,2012).本文采用此方法对研究区内所有台站对的格林函数进行了Love波相速度频散曲线的测量.
图 2给出了研究区内3条不同台站对的频散曲线.其中,YCI-HCS台站对的路径位于鄂尔多斯块体、四川盆地和扬子克拉通等稳定的块体内,其Love波相速度最高;ZOD-NZH台站对经过了川滇菱形块体和四川盆地,其具有中等的Love波相速度;CAD-TSS台站对横跨了松潘—甘孜地体,而具有最低的Love波相速度.
 | 图 2 不同台站对的Love波相速度频散曲线Fig. 2 Examples of the Love wave phase velocity dispersion curves from the different interstation paths |
经过严格的挑选,我们保留了光滑、可靠的频散曲线,并针对存在多条重复路径的相速度频散,对其进行了算术平均处理.图 3a和3b显示了周期15 s(4231条)和50 s(4396条)的射线分布,可以看出射线交叉、密集,基本均匀地覆盖了研究区.
 | 图 3 a)和(b)为15 s和50 s周期的射线分布;(c)和(d)是相应周期的相速度误差分布; (e)和(f)则是检测板测试结果,15 s周期的网格为1°×1°,50 s周期的网格为1.5°×1.5°Fig. 3 (a) and (b) denote the distribution of ray paths at 15 s and 50 s respectively. (c) and (d) are the distribution of phase velocity errors at corresponding periods. (e) and (f) indicate the results of the checkboard resolution test at 15 with a grid spacing of 1°×1° and 50 s with a grid spacing of 1.5°×1.5° |
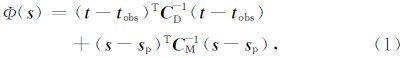
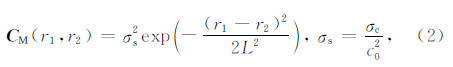
Tarantola和Valette(1982)、Tarantola和Nercessian(1984)发展了非线性面波反演方法.该方法就是通过极小化目标函数Φ(s)来反演面波相速度:
为了评估反演结果的可靠性和分辨能力,本文给出了15 s和50 s周期的相速度误差分布(图 3c和3d)及其相应周期的检测板测试(图 3e和3f).周期15 s的相速度误差在研究区大部分区域小于0.04 km·s-1,而周期50 s的相速度误差则基本小于0.03 km·s-1.在研究区的边缘,由于射线分布偏少,误差较大.在检测板测试中,初始模型速度值为3.3 km·s-1,加入的扰动值为±0.3 km·s-1,15 s周期的网格划分为1°×1°,50 s周期的网格为1.5°×1.5°.经过检测板测试后,我们可以看到整个研究区内基本可以得到很好的恢复,这也表明了本文网格划分的可行性及相应周期的分辨尺度.
3.2 Love波相速度分布采用上述反演方法,我们获取了研究区15~80 s周期的Love波相速度,图 4给出了各个周期的相速度分布.
 | 图 4 不同周期的Love波相速度分布Fig. 4 The distribution of the Love wave phase velocity at different periods |
在15 s的短周期上(图 4a),Love波相速度主要反映了地壳浅部的横向速度结构变化特征.低速异常位于四川盆地、松潘—甘孜地体和川滇菱形块体内部,而高速异常分布于扬子克拉通和鄂尔多斯块体.周期30~50 s(图 4b和4c)的Love波相速度大体反映的是研究区中下地壳部分的速度结构.从30 s和50 s周期的相速度分布来看,二者的分布特征较为相似.北起祁连造山带,向南穿过松潘—甘孜地体,至川滇菱形块体的区域均为较强的低速异常,而高速异常则出现在阿拉善块体、鄂尔多斯块体、秦岭—大别造山带、四川盆地和扬子克拉通等地区.这也意味着在具有较高地形的青藏高原东缘中下地壳广泛分布着较低的Love波相速度异常,但像阿拉善块体、鄂尔多斯块体、四川盆地和扬子克拉通等刚性块体的中下地壳具有较高的Love波相速度分布.该异常分布特征与Zhou等(2012)获取的Rayleigh波相速度分布具有一定的相似性.在周期为80 s的长周期上(图 4d),Love波相速度体现的是上地幔的速度结构.研究区内的Love波相速度均在4.2 km·s-1以上,最高的相速度达4.75 km·s-1左右.较低的相速度只是分布在松潘—甘孜地体西部和川滇菱形块体西南的腾冲火山地区,研究区的其他区域基本上都分布着高速异常.
4 S波速度结构4.1 最小二乘线性反演方法Herrmann和Ammon(2004)发展了最小二乘线性迭代反演方法,假设每个节点的纯路径频散为un,给定初始S波速度模型后,用泰勒展开来表示un与速度模型之间的关系:
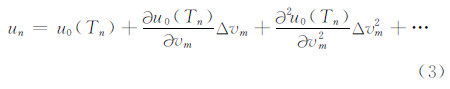
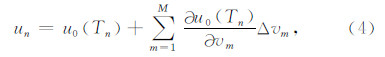
采用该线性反演方法,本研究对0.25°×0.25°网格的Love波纯路径频散进行了一维S波速度结构反演.根据Love波不同周期的敏感核(图 5a),我们的数据能够分辨120 km深度内的S波速度结构.反演中的初始模型采用一维层状模型,其地壳部分采用CRUST1.0模型(Laske et al.,2013),每层厚度为2 km,地幔部分采用AK135模型(Kennett et al.,1995),Moho面至120 km深度分为12层,120 km深度以下则每层厚度为10 km.地壳厚度对S波反演结果存在一定的影响,为采用更为准确的地壳厚度,本文依据P波接收函数的结果(Xu et al.,2013; Li et al.,2014b)对地壳厚度进行约束(图 6a).在反演中,我们固定P波与S波速度比、密度和层厚度值,且对模型中不同的层设置了不同的权重,0~150 km深度中每层权重均为1.0,150~200 km深度内权重从0.85降至0.15,200 km以下的权重设定为0.当频散曲线拟合的标准偏差小于0.01时,将停止反演,其最大的反演次数为40次.另外,为避免起始反演时模型扰动量过大,我们将前两次反演的阻尼因子设为10,而后反演的阻尼因子设为0.1.
 | 图 5 (a) 不同周期Love波相速度的敏感核;(b) 不同深度范围S波速度的分辨矩阵Fig. 5 (a) Love wave phase velocity sensitivity kernels at different periods; (b) Rows of the resolution matrix in different range of depths |
 | 图 6 (a) 研究区地壳厚度分布(Xu et al., 2013; Li et al., 2014),AA′、BB′、CC′和DD′分别为图8中4条S波速度剖面的位置,点I和II为图(b)和(c)的网格点位置;(b) 网格点I和II的纯路径频散,圆圈为观测的频散,实线为拟合的频散; (c) S波速度反演结果Fig. 6 (a) The distribution of the crustal thickness (Xu et al., 2013; Li et al., 2014). AA′, BB′, CC′ and DD′ are the locations of 4 S-wave velocity profiles shown in Fig.8 respectively. I and II denote the locations of the grid nodes in (b) and (c). (b) The pure path dispersions for the grid nodes of I and II. The circles are the observed dispersion curves, and the solid lines are the predicted dispersion curves. (c) Results of S-wave velocity inversion |
我们可以利用反演时计算的分辨矩阵来评估S波速度结构的分辨率(Li et al.,2013),图 5b给出了0~120 km深度内S波反演的分辨矩阵,可以看出随深度的增加,分辨矩阵的峰值逐渐减小,这意味着分辨能力在逐渐下降.图 6b和6c为网格点I和II的频散拟合与一维S波速度结构,其拟合的频散与观测的频散吻合较好,进一步说明了反演的可靠性.
4.3 三维S波速度结构在得到研究区每个网格点的一维S波速度之后,本文通过线性插值获取了南北地震带地区地壳上地幔的三维S波速度结构.我们用不同深度范围内的水平切片(图 7)和不同位置的垂直剖面(图 8)展示了南北地震带地区的三维S波速度结构分布特征.
 | 图 7 不同深度范围内的S波速度 (a, b, c, d) 分别为10~25、40~50、60~80和100~120 km深度平均S波速度.Fig. 7 S-wave velocity in different range of depths (a, b, c, d) are the average S-wave velocity in depths of 10~25、40~50、60~80 and 100~120 km. |
 | 图 8 S波速度剖面(H指地形的海拔高度)Fig. 8 Vertical profiles of S-wave velocity |
在水平切片中,图 7a是10至25 km深度范围内的平均S波速度.在该深度范围内,S波低速异常主要分布在鄂尔多斯块体、松潘—甘孜地体、四川盆地和扬子克拉通大部分区域,阿拉善块体、川滇菱形块体及其西部呈现高速异常.该深度范围内的S波速度分布体现了南北地震带地区上地壳的结构特征,这种S波速度异常主要受到地表沉积和浅层结构的影响.在40至50 km深度的平均S波速度分布中(图 7b),研究区以鄂尔多斯块体和四川盆地的西部、川滇菱形块体的东部为界,两侧的S波速度异常具有明显的差异.东部地区呈现较强的高速异常,而西部则为低速异常,特别是川滇菱形块体北部与松潘—甘孜地体西部为明显的S波低速异常.这与前人利用不同资料反演的S波速度结构分布趋势(苏伟等,2002;Li et al.,2009,2010; Zhou et al.,2012;黄忠贤等,2013)有一定的相似性,只是在S波速度异常的局部特征和范围上,不同结果间还存在一些差异.图 7c和7d分别为60至80 km、100至120 km深度范围的平均S波速度,属于南北地震带的上地幔速度结构.其中,在60至80 km深度中,稳定的扬子克拉通、四川盆地和鄂尔多斯块体呈现较高的S波速度,而在活动的造山带、松潘—甘孜地体和川滇菱形块体等高原活动构造区域表现为较低的S波速度.在100至120 km深度上,祁连造山带、秦岭—大别造山带、松潘—甘孜地体和扬子克拉通均分布着低速异常,而显著的S波高速异常出现在川滇菱形块体的西北部区域,Zhang等(2011)和Wei等(2013)利用P波走时层析成像也发现了类似的高速异常,Liang和Song(2006)的Pn波成像和Ren和Shen(2008)的有限频层析成像结果均认为印度板块在青藏高原东部地区向东北方向俯冲的距离更长.
在垂直剖面中(图 8),各个剖面位于松潘—甘孜地体和川滇菱形块体的部分,在地壳的40至50 km深度上均分布着明显的S波低速层.剖面BB′(图 8b)和CC′(图 8c)中川滇菱形块体的上地幔100至120 km深度上具有较高的S波速度.另外,鄂尔多斯块体(图 8b)、四川盆地(图 8d)和扬子克拉通(图 8c和8d)的上地幔部分也分布着S波高速异常.
5 讨论与结论本文通过收集2008年1月到2011年3月期间南北地震带地区的地震记录,采用频时分析方法提取了不同台站对间的Love波相速度频散,应用Tarantola反演方法获取了研究区内的相速度分布.由研究区内的纯路径频散,我们利用Herrmann和Ammon(2004)的线性迭代法反演了0.25°×0.25°网格节点上的一维S波速度结构,经过线性插值得到了南北地震带地区的三维S波速度结构.根据上述所获取的成像结果,本文将试图对以下几个热点问题进行探讨.
青藏高原隆升及其物质向外围逃逸的模型一直是大家讨论的热点问题,近年来受到了地球科学家们的广泛关注(黄忠贤等,2013;Li et al.,2014a; Liu et al.,2014).其中,下地壳黏滞流模型(Royden et al.,1997,2008; Clark and Royden,2000; Shen et al.,2001)是被很多地球物理观测所支持的一种模型,符合由GPS资料研究显示的现今地表运动模式(Zhang et al.,2004),在预测青藏高原地形起伏、地壳厚度、地壳缩短及岩石圈地体东向滑移方面也起了很好的作用.
在我们获取的三维S波速度结构中,松潘—甘孜地体和川滇菱形块体区域呈现了明显的S波低速层(图 7b和图 8).结合利用其他数据资料和方法在该区得到的结果,如人工地震测深(Liu et al.,2006; Wang et al.,2007)获取的P波低速层、接收函数(Xu et al.,2007;Wang et al.,2010)反演得到的S波低速层、地热学方法(汪集旸和黄少鹏,1990;Hu et al.,2000;Tao and Shen,2008)给出的高热流值和大地电磁测深(赵国泽等,2008;Bai et al.,2010)得到的低电阻率层等,本文在图 7b和图 8中呈现的S波低速层为下地壳流模型提供了有力的地震学证据.在印度板块不断挤压作用下,青藏高原下地壳的弱强度物质向东发生侧向流动,而在青藏高原的东缘,四川盆地是很稳定的地台区,地壳物质强度较大,因此高原下方的地壳流流动受到坚硬物质的阻档,产生向东北和东南方向的流动并导致地形的急剧变化(Clark and Royden,2000; Royden et al.,2008).本文中S波低速层主要分布于地形海拔较高的四川盆地西南和西北部(图 8),而进入稳定的阿拉善块体、鄂尔多斯块体、四川盆地和扬子克拉通前,S波低速层逐渐消失,这与下地壳流模型对青藏高原地壳物质运移和地表地形变化的解释相吻合(Li et al.,2009; 黄忠贤等,2013).
壳幔耦合方式是当前大陆动力学研究中一个值得探讨的问题.王椿镛等(2007)利用GPS资料和上地幔各向异性分析得出青藏高原内部和外部的云南地区具有完全不同的壳幔变形特征,认为高原内部为强壳幔耦合型,而云南地区为壳幔解耦型.胥颐等(2012)综合GPS资料、上地幔各向异性和速度结构异常给出了滇西地区存在壳幔解耦的结论.黄忠贤等(2013)由面波资料得到的S波速度结构和面波方位各向异性也表明了青藏高原东缘存在壳幔解耦.从本文的S波速度分布看,川滇菱形块体区域具有明显下地壳低速层(图 7和8).该S波低速层支持下地壳流模型,那么青藏高原地壳物质易于向东南方向流出.图 7d中,川滇菱形块体西北部存在明显的S波高速异常.根据Pn波成像(Liang and Song,2006)、有限频成像(Ren and Shen,2008)和P波走时成像(Zhang et al.,2011; Wei et al.,2013)结果,我们推测该S波高速异常可能是印度岩石圈沿喜马拉雅东构造结向东北方向下插到青藏高原东南缘所致.那么,该区域的地壳和上地幔就可能具有完全不同的构造运动与变形方式,下地壳的低速软弱物质与上地幔的高速强硬物质形成了鲜明对比,为壳幔动力学解耦提供了条件.因此,本文在川滇菱形块体区域获取的壳幔S波速度异常特征可以视为该地区存在壳幔解耦的地震学证据.
致谢 感谢中国地震局地球物理研究所国家数字测震台网数据备份中心(doi:10.7914/SN/CB)为本研究提供地震波形数据.衷心感谢审稿专家提出的宝贵修改意见.| [1] | Bai D H, Unsworth M J, Meju M A, et al. 2010. Crustal deformation of the eastern Tibetan plateau revealed by magnetotelluric imaging. Nature Geoscience, 3(5): 358-362. |
| [2] | Bensen G D, Ritzwoller M H, Barmin M P, et al. 2007. Processing seismic ambient noise data to obtain reliable broad-band surface wave dispersion measurements. Geophys. J. Int., 169(3): 1239-1260. |
| [3] | Clark M K, Royden L H. 2000. Topographic ooze: Building the eastern margin of Tibet by lower crustal flow. Geology, 28(8): 703-706. |
| [4] | Deng Q D, Zhang P Z, Ran Y K, et al. 2003. Basic characteristics of active tectonics of China. Science in China Series D: Earth Sciences, 46(4): 356-372. |
| [5] | He Z Q, Zeng R S, Chen G Y. 1990. The group velocity of Rayleigh waves and crust structure in North-South Seismic Zone. Northwestern Seismological Journal (in Chinese), 12(3): 19-22. |
| [6] | Herrmann R B, Ammon C J. 2004. Surface waves, receiver functions and crustal structure. Computer Programs in Seismology, Version 3.30. Saint Louis University, http://www.eas.slu.edu/People/RBHerrmann/CPS330.html. |
| [7] | Hu S B, He L J, Wang J Y. 2000. Heat flow in the continental area of China: a new data set. Earth Planet. Sci. Lett., 179(2): 407-419. |
| [8] | Huang Z X, Li H Y, Xu Y. 2013. Lithospheric S-wave velocity structure of the North-South Seismic Belt of China from surface wave tomography. Chinese Journal of Geophysics (in Chinese), 56(4): 1121-1131, doi: 10.6038/cjg20130408. |
| [9] | Kennett B L N, Engdahl E R, Buland R. 1995. Constraints on seismic velocities in the Earth from travel times. Geophys. J. Int., 122(1): 108-124. |
| [10] | Laske G, Masters G, Ma Z T, et al. 2013. Update on CRUST1. 0-A 1-degree Global Model of Earth's Crust. Geophys. Res.Abstracts, 15: 2658. |
| [11] | Li B J, Li N, Chen H. 1989. Group velocity differences of Rayleigh waves between the NS Seismic Belt, China, and the side regions, and their tectonic implications. Acta Seismologica Sinica (in Chinese), 11(3): 268-274. |
| [12] | Li H Y, Su W, Wang C Y, et al. 2009. Ambient noise Rayleigh wave tomography in western Sichuan and eastern Tibet. Earth Planet. Sci. Lett., 282(1-4): 201-211. |
| [13] | Li H Y, Su W, Wang C Y, et al. 2010. Ambient noise Love wave tomography in the eastern margin of the Tibetan plateau. Tectonophysics, 491(1-4): 194-204. |
| [14] | Li L, Li A B, Shen Y, et al. 2013. Shear wave structure in the northeastern Tibetan Plateau from Rayleigh wave tomography. J. Geophys. Res., 118(8): 4170-4183. |
| [15] | Li Y, Yao H J, Liu Q Y, et al. 2010. Phase velocity array tomography of Rayleigh waves in western Sichuan from ambient seismic noise. Chinese Journal of Geophysics (in Chinese), 53(4): 842-852, doi: 10.3969/j.issn.0001-5733.2010.04.009. |
| [16] | Li Y H, Pan J T, Wu Q J, et al. 2014a. Crustal and uppermost mantle structure of SE Tibetan plateau from Rayleigh-wave group-velocity measurements. Earthquake Science, 27(4): 411-419. |
| [17] | Li Y H, Gao M T, Wu Q J. 2014b. Crustal thickness map of the Chinese mainland from teleseismic receiver functions. Tectonophysics, 611: 51-60. |
| [18] | Liang C T, Song X D. 2006. A low velocity belt beneath northern and eastern Tibetan Plateau from Pn tomography. Geophys. Res. Lett., 33: L22306, doi: 10.1029/2006GL027926. |
| [19] | Lin F C, Moschetti M P, Ritzwoller M H. 2008. Surface wave tomography of the western United States from ambient seismic noise: Rayleigh and Love wave phase velocity maps. Geophys. J. Int., 173(1): 281-298. |
| [20] | Liu M J, Mooney W D, Li S L, et al. 2006. Crustal structure of the northeastern margin of the Tibetan plateau from the Songpan-Ganzi terrane to the Ordos basin. Tectonophysics, 420(1-2): 253-266. |
| [21] | Liu Q Y, van der Hilst R D, Li Y, et al. 2014. Eastward expansion of the Tibetan Plateau by crustal flow and strain partitioning across faults. Nature Geoscience, 7(5): 361-365. |
| [22] | Montagner J P. 1986. Regional three-dimensional structures using long-period surface waves. Annales Geophysicae (Series B), 4(3): 283-294. |
| [23] | Ren Y, Shen Y. 2008. Finite frequency tomography in southeastern Tibet: Evidence for the causal relationship between mantle lithosphere delamination and the north-south trending rifts. J. Geophys. Res., 113: B10316, doi: 10.1029/2008JB005615. |
| [24] | Royden L H, Burchfiel B C, King R W, et al. 1997. Surface deformation and lower crustal flow in eastern Tibet. Science, 276(5313): 788-790. |
| [25] | Royden L H, Burchfie B C, van der Hilst R D. 2008. The geological evolution of the Tibetan Plateau. Science, 321(5892): 1054-1058. |
| [26] | Shen F, Royden L H, Burchfiel B C. 2001. Large-scale crustal deformation of the Tibetan Plateau., J. Geophys. Res. 106(B4): 6793-6816. |
| [27] | Su W, Peng Y J, Zheng Y J, et al. 2002. Crust and upper mantle shear velocity structure beneath the Tibetan Plateau and adjacent areas. Acta Geoscientia Sinica (in Chinese), 23(3): 193-200. |
| [28] | Tao W, Shen Z K. 2008. Heat flow distribution in Chinese continent and its adjacent areas. Prog. Nat. Sci., 18(7): 843-849. |
| [29] | Tapponnier P, Xu Z Q, Roger F, et al. 2001. Oblique stepwise rise and growth of the Tibet plateau. Science, 294(5547): 1671-1677. |
| [30] | Tarantola A, Valette B. 1982. Generalized nonlinear inverse problems solved using the least squares criterion. Revi. Geophys. Space Phys., 20(2): 219-232. |
| [31] | Tarantola A, Nercessian A. 1984. Three-dimensional inversion without blocks. Geophys. J. Int., 76(2): 299-306. |
| [32] | Wang C Y, Chang L J, LÜ Z Y, et al. 2007. Seismic anisotropy of upper mantle in eastern Tibetan Plateau and related crust-mantle coupling pattern. Science in China Series D: Earth Sciences, 50(8): 1150-1160. |
| [33] | Wang C Y, Han W B, Wu J P, et al. 2007. Crustal structure beneath the eastern margin of the Tibetan Plateau and its tectonic implications. J. Geophys. Res., 112(B7): B07307, doi: 10.1029/2005JB003873. |
| [34] | Wang C Y, Lou H, Silver P G, et al. 2010. Crustal structure variation along 30°N in the eastern Tibetan Plateau and its tectonic implications. Earth and Planetary Science Letters, 289(3-4): 367-376. |
| [35] | Wang J Y, Huang S P. 1990. Compilation of heat flow data in the China continental area (2nd Edition). Seismology and Geology (in Chinese), 12(4): 351-363, 366. |
| [36] | Wang Q, Zhang P Z, Freymueller J T, et al. 2001. Present-day crustal deformation in China constrained by Global Positioning System measurements. Science, 249(5542): 574-577. |
| [37] | Wei W, Zhao D P, Xu J D. 2013. P-wave anisotropic tomography in Southeast Tibet: New insight into the lower crustal flow and seismotectonics. Physics of the Earth and Planetary Interiors, 222: 47-57. |
| [38] | Xu L L, Rondenay S, van der Hilst R D. 2007. Structure of the crust beneath the southeastern Tibetan Plateau from teleseismic receiver functions. Phys. Earth Planet. Inter., 165(3-4): 176-193. |
| [39] | Xu X M, Li H Y, Gong M, et al. 2011. Three-dimensional S-wave velocity structure in eastern Tibet from ambient noise Rayleigh and love wave tomography. J. Earth Sci., 22(2): 195-204. |
| [40] | Xu X M, Ding Z F, Shi D N, et al. 2013. Receiver function analysis of crustal structure beneath the eastern Tibetan plateau. J. Asian Earth Sci., 73: 121-127. |
| [41] | Xu Y, Zhong D L, Liu J H. 2012. Constraints of deep structures on the crust-mantle decoupling in the western Yunnan and the magma activity in the Tengchong volcanic area. Progress in Geophys.(in Chinese), 27(3): 846-855. |
| [42] | Zhang H, Zhao J M, Xu Q. 2011. Seismic P-wave tomography in eastern Tibet: Formation of the rifts. Chinese Sci. Bull., 56(23): 2450-2455. |
| [43] | Zhang J S, Li Y, Han Z J. 2003. Deformation responses to eastwards escaping of the Qinghai-Tibet plateau and tectonics of the South-North Seismic Zones in China. Earth Science Frontiers (in Chinese), 10(Suppl.): 168-175. |
| [44] | Zhang P Z, Shen Z K, Wang M, et al. 2004. Continuous deformation of the Tibetan Plateau from global positioning system data. Geology, 32(9): 809-812. |
| [45] | Zhang X M, Sun R M, Teng J W. 2007. Study on crustal, lithospheric and asthenospheric thickness beneath the Qinghai-Tibet plateau and its adjacent areas. Chinese Science Bulletin, 52(6): 797-804. |
| [46] | Zhao G Z, Chen X B, Wang L F, et al. 2008. Evidence of crustal 'channel flow’ in the eastern margin of Tibetan plateau from MT measurements. Chinese Science Bulletin, 52(12): 1887-1893. |
| [47] | Zheng X F, Ouyang B, Zhang D N, et al. 2009. Technical system construction of Data Backup Centre for China Seismograph Network and the data support to researches on the Wenchuan earthquake. Chinese Journal of Geophysics (in Chinese), 52(5): 1412-1417, doi: 10.3969/j.issn.0001-5733.2009.05.031. |
| [48] | Zhou L Q, Xie J Y, Shen W S, et al. 2012. The structure of the crust and uppermost mantle beneath South China from ambient noise and earthquake tomography. Geophys. J. Int., 189(3): 1565-1583. |
| [49] | Zhu L B, Xu Q, Chen X F. 2002. Group velocity of Rayleigh wave in Chinese continent and its adjacent seas. Chinese Journal of Geophysics (in Chinese), 45(4): 475-482. |
| [50] | Zhuang Z, Fu Z W, LÜ Z L, et al. 1992. 3-D shear velocity model of crust and upper mantle beneath the Tibetan Plateau and its adjacent regions. Acta Geophysica Sinica (in Chinese), 35(6): 694-709. |
| [51] | 邓起东, 张培震, 冉勇康等. 2002. 中国活动构造基本特征. 中国科学D辑: 地球科学, 32(12): 1020-1030. |
| [52] | 何正勤, 曾融生, 陈国英. 1990. 南北地震带的瑞利波群速度与地壳结构. 西北地震学报, 12(3): 19-22. |
| [53] | 黄忠贤, 李红谊, 胥颐. 2013. 南北地震带岩石圈S波速度结构面波层析成像. 地球物理学报, 56(4): 1121-1131, doi: 10.6038/cjg20130408. |
| [54] | 李白基, 李宁, 陈虹. 1989. 南北地震带和两侧的瑞利面波群速度差异及其大地构造意义. 地震学报, 11(3): 268-274. |
| [55] | 李昱, 姚华建, 刘启元等. 2010. 川西地区台阵环境噪声瑞利波相速度层析成像. 地球物理学报, 53(4): 842-852, doi: 10.3969/j.issn.0001-5733.2010.04.009. |
| [56] | 苏伟, 彭艳菊, 郑月军等. 2002. 青藏高原及其邻区地壳上地幔S波速度结构. 地球学报, 23(3): 193-200. |
| [57] | 王椿镛, 常利军, 吕智勇等. 2007. 青藏高原东部上地幔各向异性及相关的壳幔耦合型式. 中国科学D辑: 地球科学, 37(4): 495-503. |
| [58] | 汪集旸, 黄少鹏. 1990. 中国大陆地区大地热流数据汇编(第二版). 地震地质, 12 (4): 351-363, 366. |
| [59] | 胥颐, 钟大赉, 刘建华. 2012. 滇西地区壳幔解耦与腾冲火山区岩浆活动的深部构造研究. 地球物理学进展, 27(3): 846-855. |
| [60] | 张家声, 李燕, 韩竹均. 2003. 青藏高原向东挤出的变形响应及南北地震带构造组成. 地学前缘, 10(特刊): 168-175. |
| [61] | 张雪梅, 孙若昧, 滕吉文. 2007. 青藏高原及其邻区地壳、岩石圈和软流层厚度研究. 科学通报, 52(3): 332-338. |
| [62] | 赵国泽, 陈小斌, 王立凤等. 2008. 青藏高原东边缘地壳“管流”层的电磁探测证据. 科学通报, 53(3): 345-350. |
| [63] | 郑秀芬, 欧阳飚, 张东宁等. 2009. “国家数字测震台网数据备份中心”技术系统建设及其对汶川大地震研究的数据支撑. 地球物理学报, 52(5): 1412-1417, doi: 10.3969/j.issn.0001-5733.2009.05.031. |
| [64] | 朱良保, 许庆, 陈晓非. 2002. 中国大陆及邻近海域的Rayleigh波群速度分布. 地球物理学报, 45(4): 475-482. |
| [65] | 庄真, 付竹武, 吕梓龄等. 1992. 青藏高原及邻近地区地壳与上地幔剪切波三维速度结构. 地球物理学报, 35(6): 694-709. |