2. 国土资源部海底矿产资源重点实验室, 广州海洋地质调查局, 广州 510075;
3. Department of Geology and Geophysics, Louisiana State University, Baton Rouge, LA 70803, USA;
4. School of Earth, Society, and Environment, University of Illinois, Urbana, IL 61801, USA;
5. 广东省有色地质勘查院, 广州 510080
2. Key Laboratory of Marine Mineral Resources, Guangzhou Marine Geological Survey, Ministry of Land and Resources, Guangzhou 510075, China;
3. Department of Geology and Geophysics, Louisiana State University, Baton Rouge, LA 70803, USA;
4. School of Earth, Society, and Environment, University of Illinois, Urbana, IL 61801, USA;
5. Guangdong Nonferrous Metals Geological Exploration Institution, Guangzhou 510080, China
1456 unoriented samples (sampling interval ~0.1 m) for MS measurement and 45 samples for biostratigraphic study were collected from outcrops with stratigraphic interval of ~147.5 m. The bottom horizon of sampling range is located at ~31.2 m below the Wordian-Capitanian (W-C) boundary. We conducted continuous sampling with the top horizon at 2.6 m above the Capitanian-Wuchiapingian (C-W) boundary at Tieqiao section, Laibin in South China, as a supplementary reference section for the Guadalupian-Lopingian (Middle-Upper Permian) Global Boundary Stratotype Section and Point (GSSP). The stratigraphic succession consists of alternations between thin-bedded chert and micritic limestone recognized as typical slope-basin facies with carbonate cap on shallow-water platform. Representative samples were selected to be carried out thermomagnetic susceptibility measurements after analysis of low-field bulk susceptibility for all samples. Then spectral (time-series) analysis of the MS data was performed by means of Multi Taper Method (MTM) and Fourier Transform (FT) analysis. Samples for biostratigraphic study were processed using acetic acid digestion in order to obtain conodont fossils.
Seven conodont zones are identified within the Capitanian stage, including Jinogondolella postserrata, J. shannoni, J. altudaensis, J. prexuanhanensis, J. xuanhanensis, J. granti, and Clarkina postbitteri hongshuiensis from the base to the top horizons of the Capitanian stage. The MS data sets are mostly negative (diamagnetic), suggesting that the Laibin area was isolated from terrigenous source during most period of the Capitanian stage. An abrupt increase in MS signal immediately below the Guadalupian-Lopingian (G-L) boundary is recorded. Although regression at the end of Capitanian might account for the increase, the coincidence of the increase with the onset of the Emeishan Large Igneous Province (LIP) eruption is intensively concerned for volcanic role in controlling the MS at the section. The results of MS and thermomagnetic susceptibility measurements indicate that the dominant magnetic constituents in this study are diamagnetic calcite and chert with subordinate paramagnetic and ferrimagnetic minerals producing the cyclicity observed in the data set. The variation of MS near the G-L boundary at Tieqiao section is essentially as same as previously published results for MS at Penglaitan Section (G-L boundary GSSP).
Six Milankovitch bands are reported with eccentricity peaks E2 (~405 ka) at 0.08 cycles·m-1 and E1 (~100 ka) at 0.35 cycles·m-1, obliquity peaks, O2 (~44.1 ka) at 0.78 cycles·m-1 and O1 (~35.0 ka), and precessional peaks P2 (~20.95 ka) at 1.69 cycles·m-1, and P1 (~17.7 ka) at 1.94 cycles·m-1. Four peaks exceed 99% confidence levels. In terms of the results of magnetostratigraphic susceptibility (MSS) zones developed from smoothed data to conform to the 405 ka (E2) eccentricity band identified in the time-series data set, a high-resolution FPTS was developed for the entire Tieqiao succession reported here. This FPTS allows a temporal resolution of ~200 ka for the studying section because each MSS zone represents half of the E2 eccentricity cycle. The results indicate that the time duration of the Capitanian Stage is estimated as ~3.85 Ma (with +0~0.28 Ma error). The mean sediment accumulation rate (SAR) for the succession is ~2.91 cm·ka-1. Moreover, conodont zones within the Capitanian stage is estimated to spanning the shortest time interval of ~26.6 ka and the longest duration of ~2.3 Ma. In addition, the onset of the Emeishan LIP eruptions is estimated at ~262.67 Ma, 1.42 Ma earlier than the Guadalupian-Lopingian boundary.
在整个显生宙建立高分辨率地质年代标尺是地层学的一项重要工作.现今,地质年代标尺的建立主要基于生物地层框架、放射性同位素定年和磁性地层,如二叠—三叠系界线年龄251.902±0.024 Ma,来源于界线层火山灰的锆石U/Pb年龄(Burgess et al.,2014).然而,许多界线附近缺少火山灰层或难以从火山灰锆石中获得准确年龄,限制了地质年代标尺的精度,即便获得了放射性同位素年龄,其误差通常也是百万年级别.米兰科维奇理论的提出与证实(Hays et al.,1976)为建立高分辨率地质年代标尺提供了一种新方法(龚一鸣等,2008;黄春菊,2014;吴怀春等,2011).天文轨道的周期性变化导致地球气候周期性变化,而沉积物记录了周期性气候,从沉积物中提取出天文轨道周期,将其调谐到理论的天文周期曲线上,即可确定该段沉积物沉积持续的时间,据此可建立浮动的地质年代标尺,其分辨率可达万年级别,极大提高了地质年代标尺的精度.目前,天文轨道调谐定年已广泛应用于中生代以来的地层中(Gradstein et al.,2012),但在古生代或更老的地层中应用相对较少.
中二叠世卡匹敦期是峨眉山大火成岩省猛烈喷发的时期,也是古—中生代之交双幕式生物大灭绝事件启动的时间,是研究生物和生态响应环境变化的极佳时期,引起众多学者关注(Ali et al.,2002; Bond et al.,2010a,b; He et al.,2007;Sun et al.,2010; Wignall,2001;Wignall et al.,2009a,b,2012;Zhou et al.,2002;李波等,2015).然而,卡匹敦阶的时限至今仍缺乏精确约束,归因于顶底界线精确放射性同位素年龄缺乏,唯一精确的锆石年龄来源于卡匹敦阶底界之下37.2 m的火山灰层,为卡匹敦阶底界提供一个最大年龄约束(Bowring et al.,1998).国际地质年代表中给出的卡匹敦阶参考时限为5.4 Ma(Gradstein et al.,2004;Ogg et al.,2008)或5.3 Ma(Gradstein et al.,2012),误差为±0.8~1.4 Ma,其精度远低于早二叠世和晚二叠世,严重影响对生物大灭绝和峨眉山玄武岩喷发启动时间和持续时间的了解.
磁化率是用来表征物体在外加磁场中被磁化难易程度的量(Borradaile,1988).海相沉积岩磁化率的大小反映岩石中亚铁磁性矿物和顺磁性矿物的含量(Ellwood et al.,2000),这些磁性矿物主要来自于陆源碎屑,通过河流或风力搬运到沉积盆地中.由于周期性气候变化控制陆源物质侵蚀与搬运,继而 控制了沉积岩的磁化率(Crick et al.,1997;Ellwood et al.,1999). 磁化率测量简单快捷、无损,已作为可靠的古气候替代指标广泛应用于沉积地层的旋回地层学研究中(Ellwood et al.,2012;Guo et al.,2008;Huang et al.,2011;Jovane et al.,2006;Wu et al.,2012,2013a,b,c).因此,本文利用磁化率数据对广西来宾铁桥剖面(乐平统底界GSSP辅助剖面)茅口组开展高精度旋回地层学研究,试图确定米兰科维奇沉积旋回,结合生物地层资料建立卡匹 敦阶高分辨率浮点年代标尺(Float Point Time Scale,FPTS),并探讨峨眉山大火成岩省喷发的启动时间和持续时间.
2 地质背景广西来宾地区位于来宾—合山孤立碳酸盐台地东南缘(图 1),在二叠纪晚期被深水盆地包围(郑和荣和胡宗全,2010).来宾地区周边的剖面在中二叠世大部分时期为盆地相沉积,主要发育放射虫硅质岩,但在中二叠世晚期发育比较典型的浅水孤立台地沉积(Qiu et al.,2014;李波等,2015;沙庆安等,1990;姚尧等,2012),这个沉积相的转变通常被认为是海平面下降(Mei et al.,1998)或东吴运动抬升造成(Shen et al.,2007;Wang and Jin,2000).
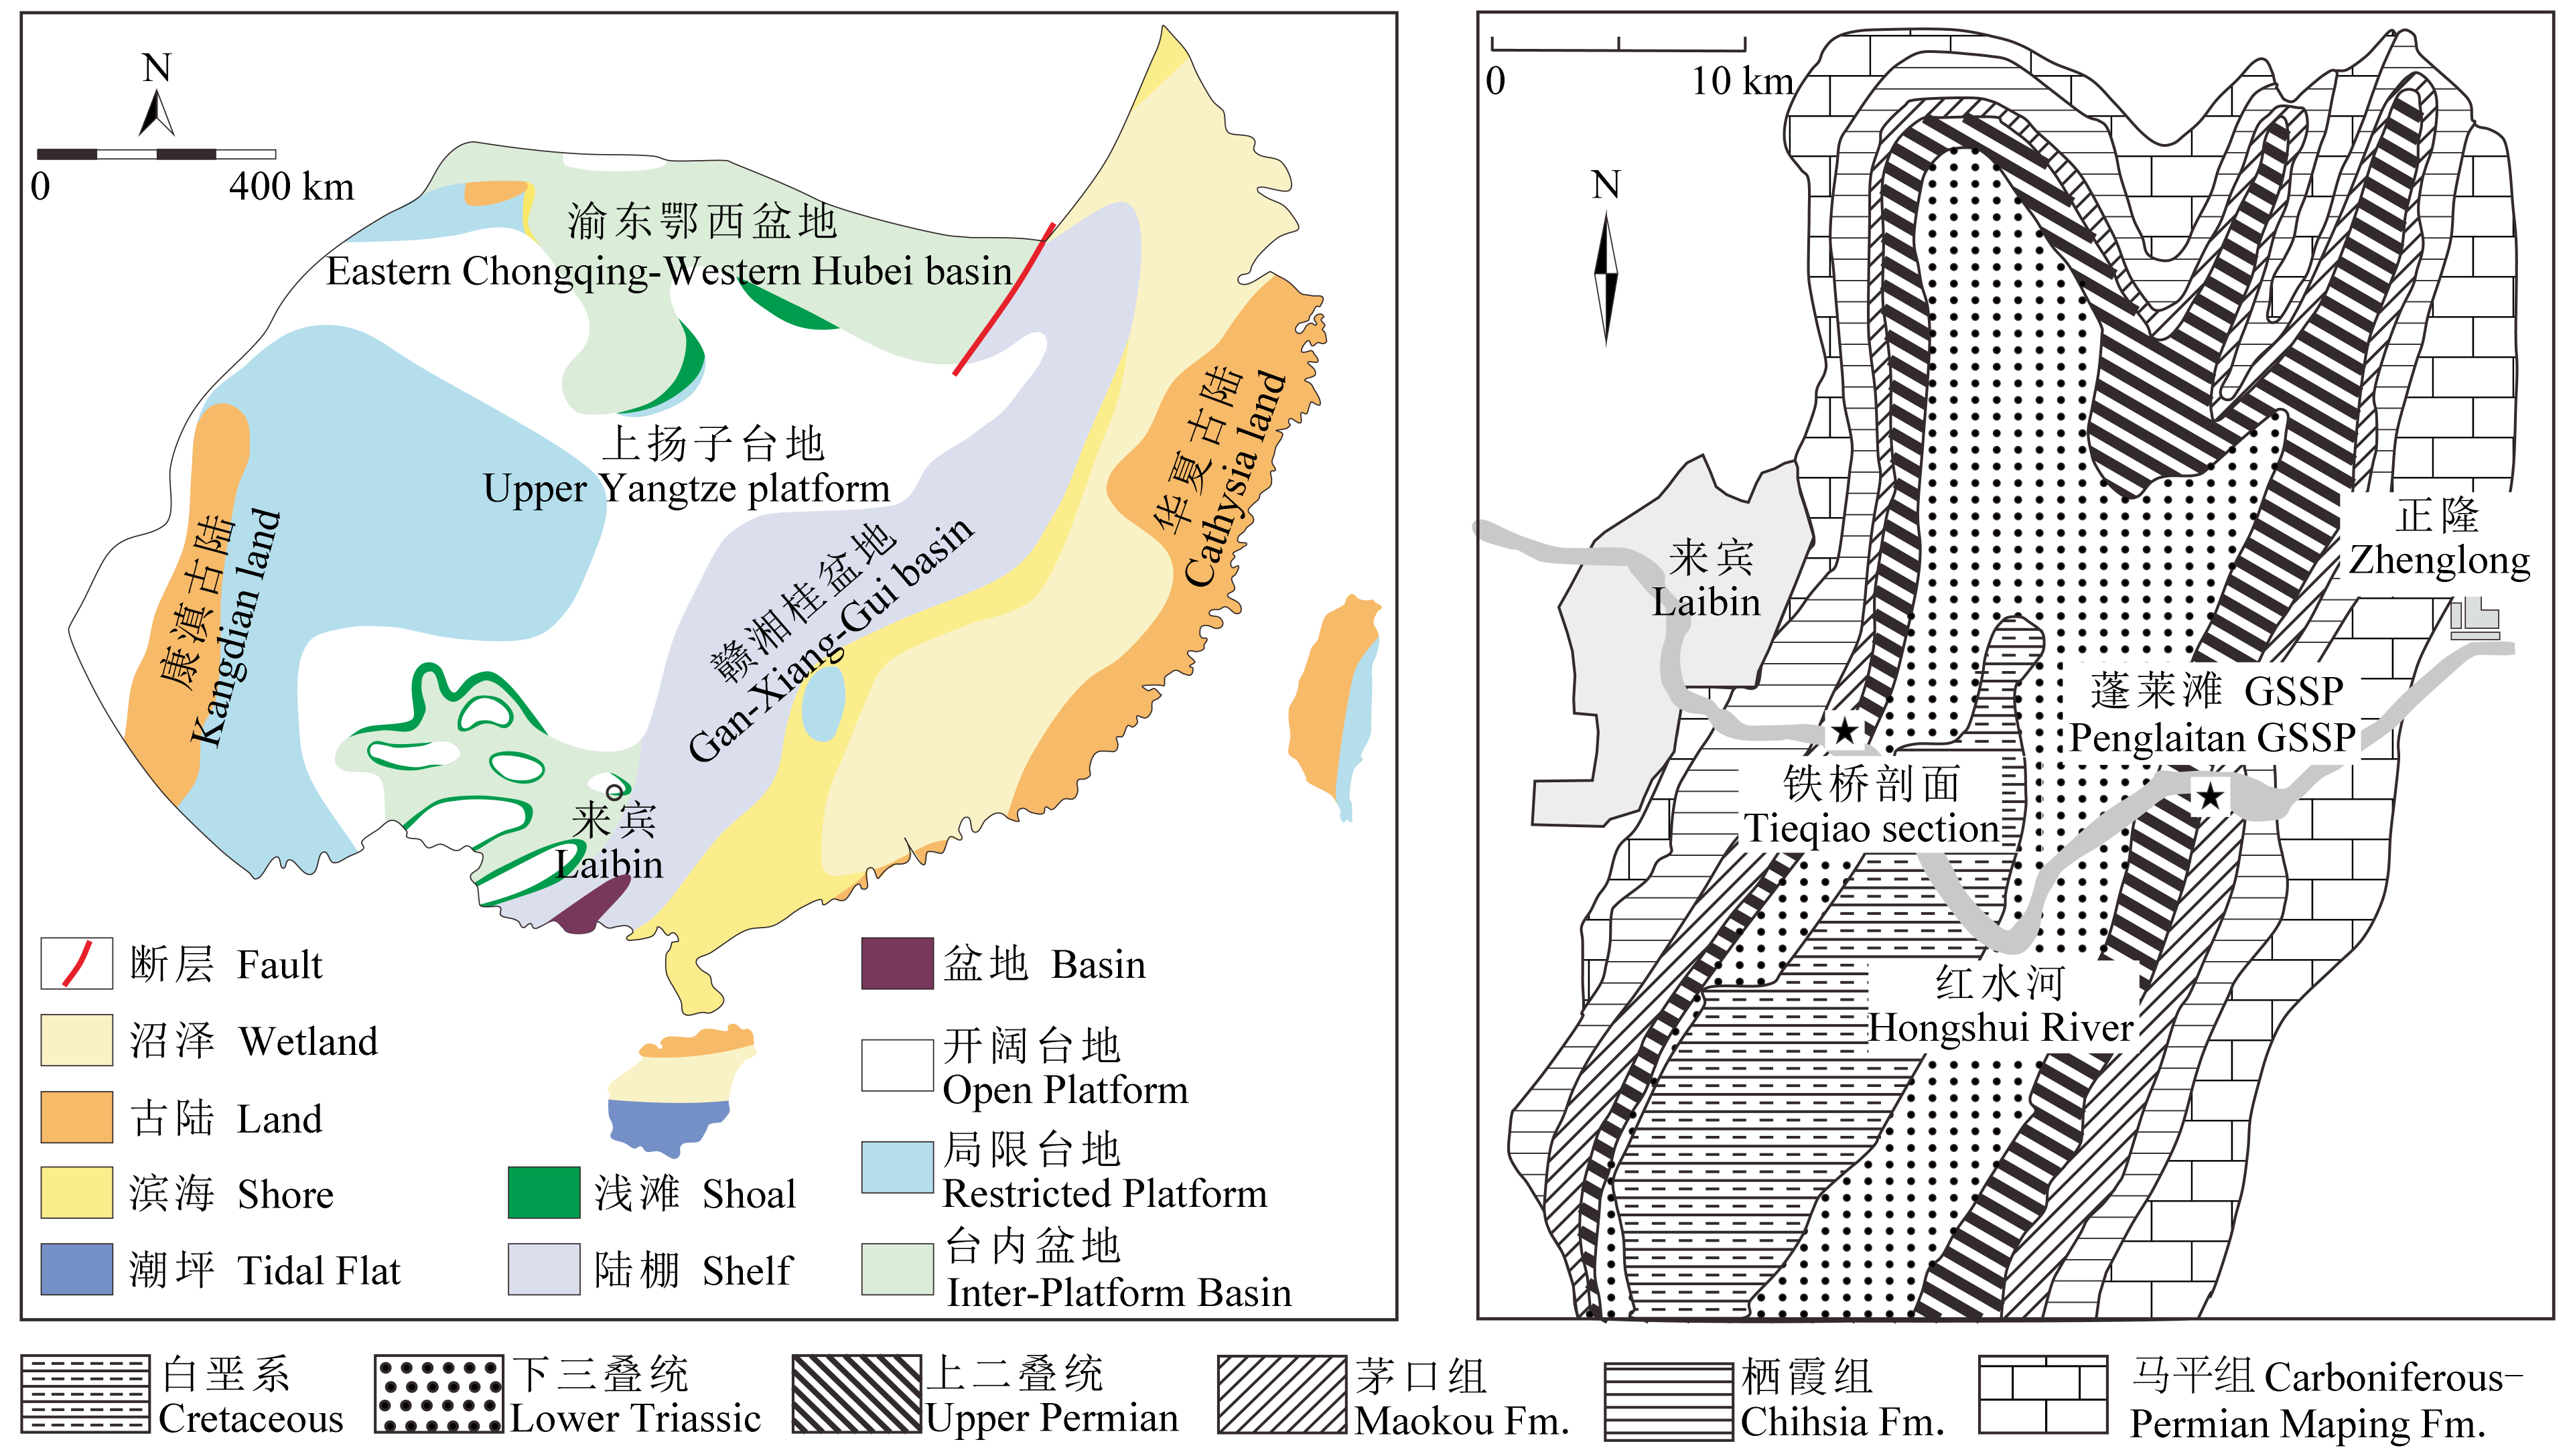 | 图 1 研究区中二叠世晚期古地理图(郑和荣和胡宗全,2010)及剖面位置图(Jin et al.,1998) Fig. 1 Paleogeographic map(revised from Zheng and Hu,2010) and geological map with locations(revised from Jin et al.,1998)of the studying sections in Laibin,South China |
铁桥剖面位于红水河北岸(23° 42.733′ N,109° 13.533′ E),距离来宾市区约5 km.铁桥剖面与蓬莱滩剖面(瓜德鲁普—乐平统界线GSSP)分别位于来宾向斜两翼,两者相距十几公里(Jin et al.,1998).二叠系栖霞组、茅口组、吴家坪组和大隆组依次沿着红水河河岸出露.中—上二叠统茅口组大部分层位是深水盆地相碳酸盐岩和硅质岩,但在顶部发育一套厚层灰岩(来宾灰岩)(沙庆安等,1990). 茅口组之上为吴家坪组放射虫硅质岩,两者呈整合接触,卡匹敦阶位于茅口组上部(Mei et al.,1998). 前人在铁桥剖面开展了大量牙形石生物地层工作,但这些生物地层工作大多集中在瓜德鲁普—乐平统(G-L)界线(Henderson et al.,2002; Jin et al.,1998,2001,2006;Mei et al.,1998; Shen et al.,2007).由于卡匹敦阶中部和下部硅质岩较多,前人对该层位的生物地层工作研究精度相对较低.
3 采样与实验方法 3.1 牙形石采样和处理本文对整个卡匹敦阶进行了较为完整的生物地层工作,以期获得更精细的牙形石带延限.从卡匹敦阶底界之下31.2 m到卡匹敦—吴家坪阶(C-W)界线之上2.6 m,大致以3 m间距采集牙形石样品45个(图 2),每个样品重量大于3.5 kg.按江海水等(2004)的方法对样品进行处理:室内先将样品破碎到1~2 cm大小,然后浸泡于10%冰醋酸水溶液中进行酸解处理,待反应完全后进行湿筛筛洗.先用20目筛洗去除较大颗粒,再用160目筛洗去除泥质及细小颗粒,充分清洗后自然风干,采用三溴甲烷和丙酮配制密度为2.80~2.81 g·mL-1的重液进行分选,最后在双目体视镜下人工挑样.
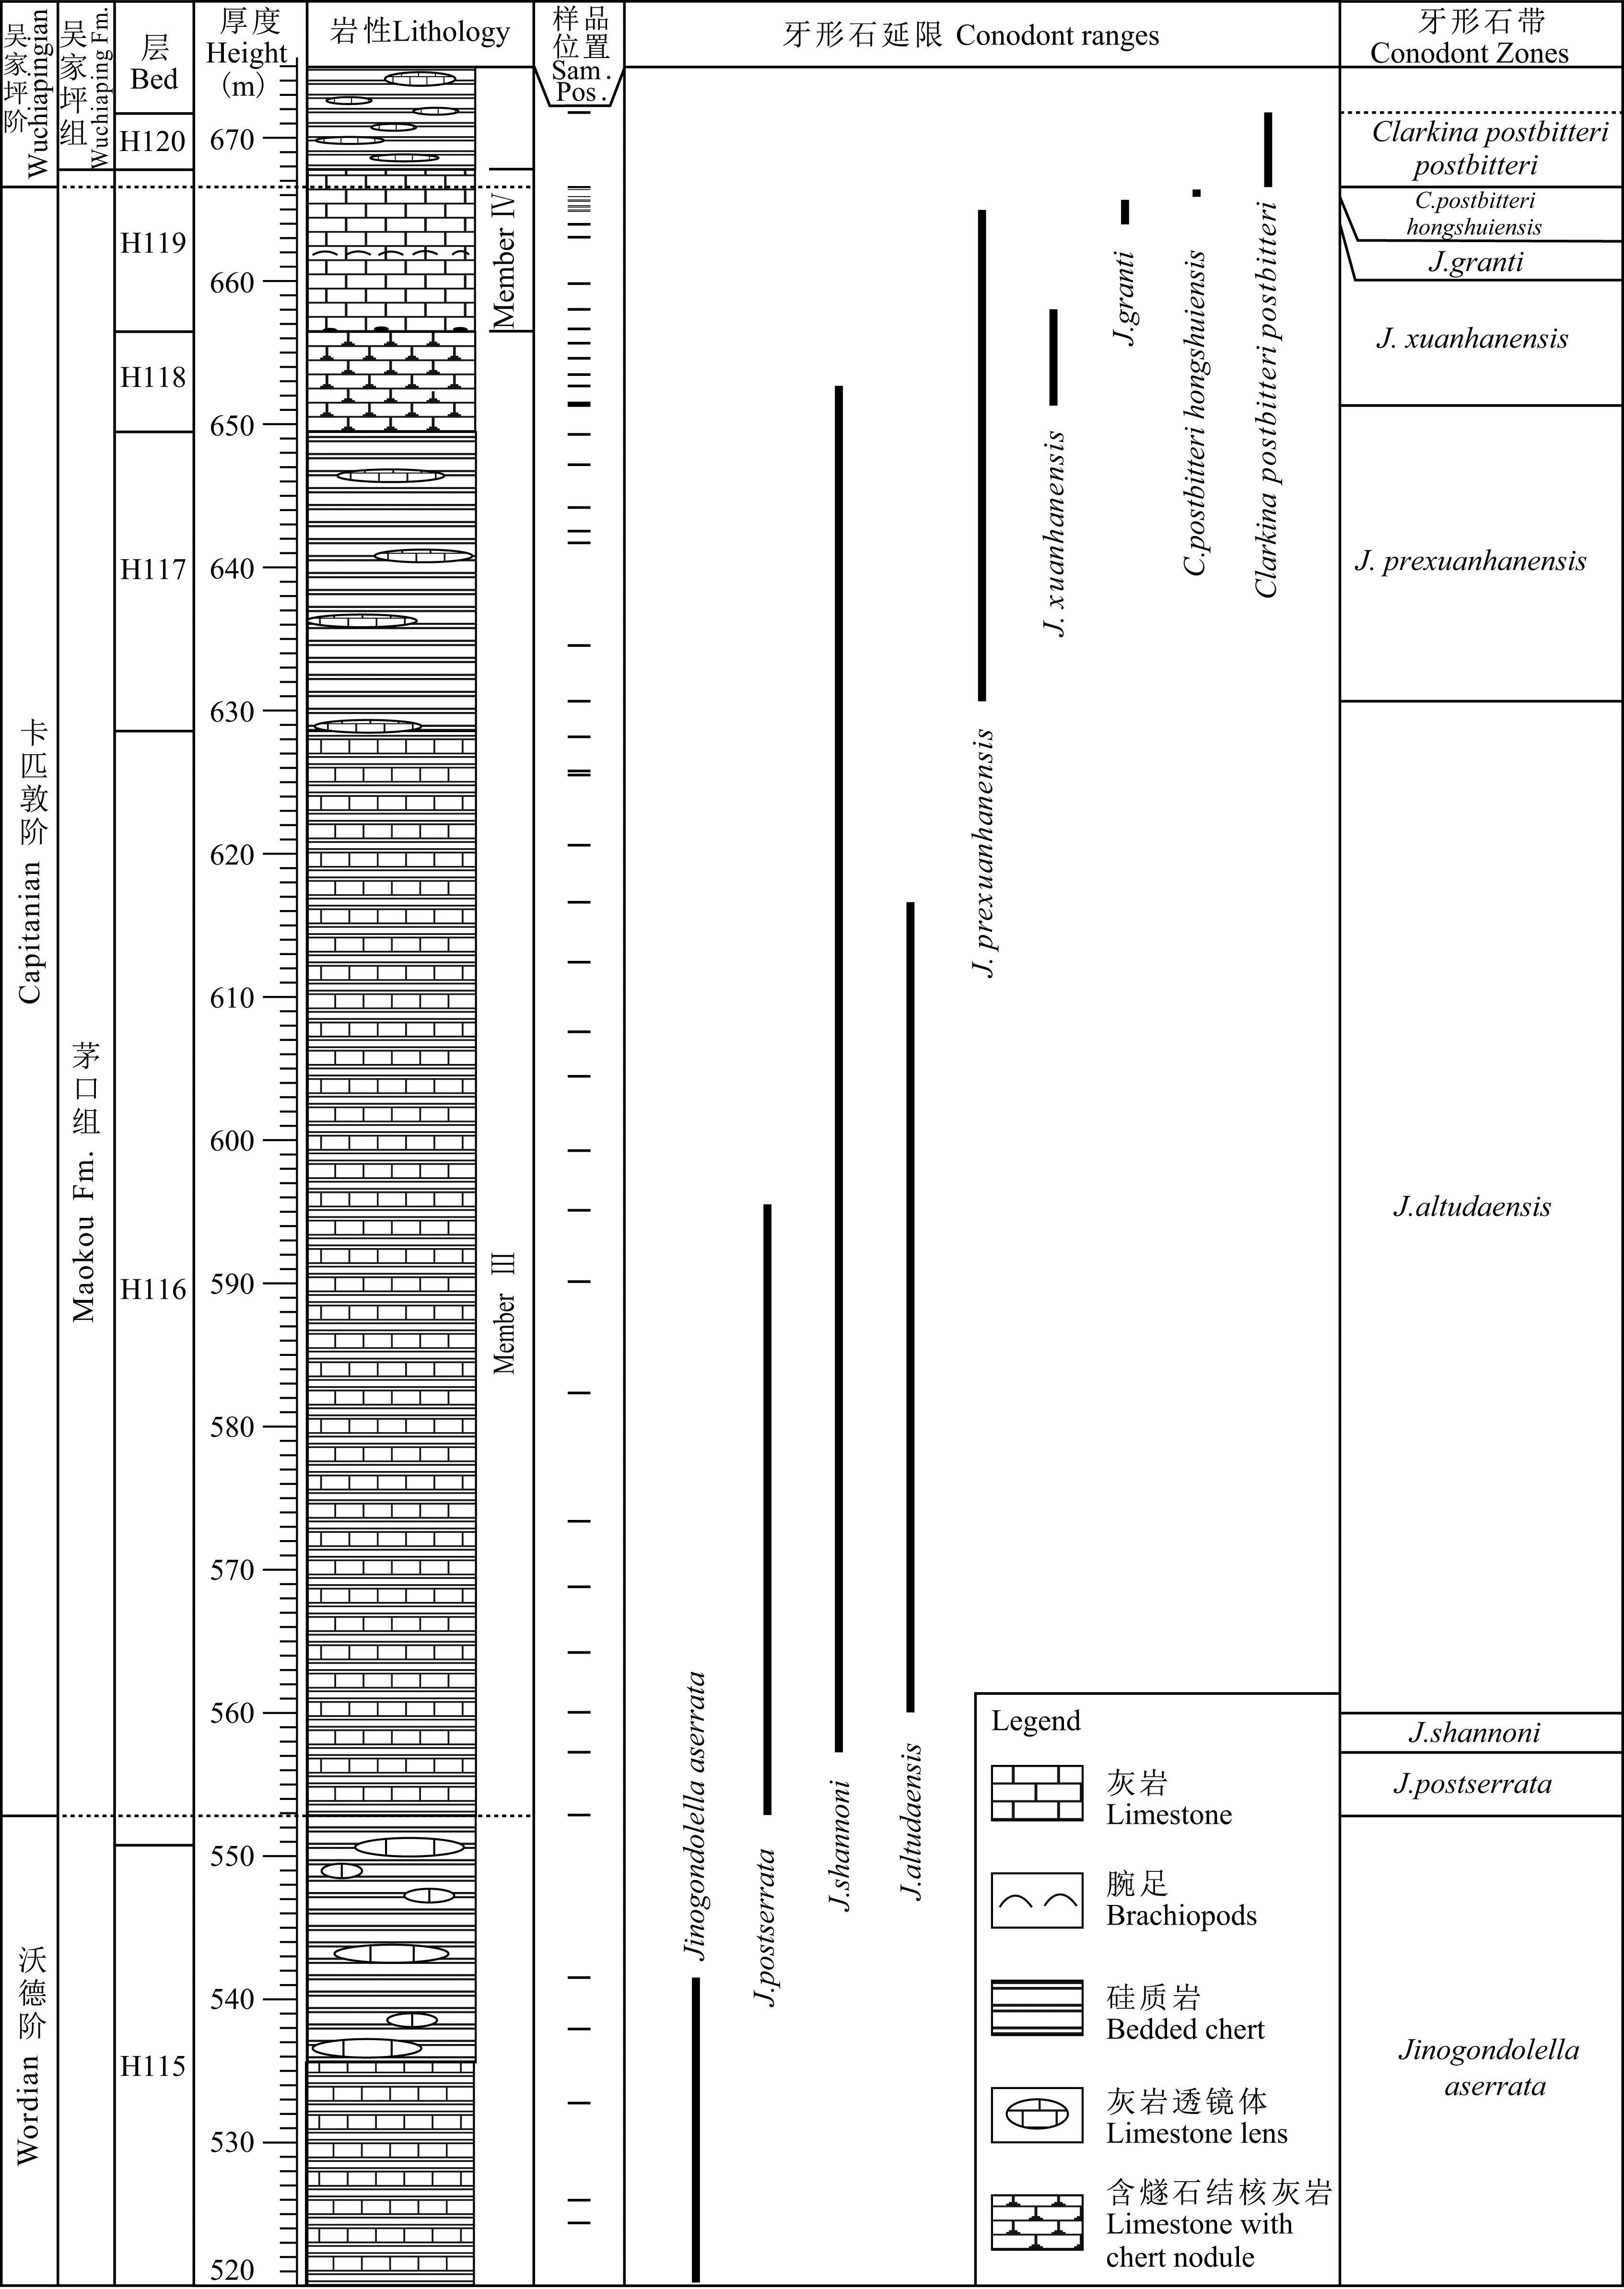 |
图 2 广西来宾铁桥剖面沃德—吴家坪阶岩性柱和牙形石带 茅口组层号参考沙庆安等(1990),段(Member)采用Shen等(2007)方案,图中样品位置为牙形石样品采样位置. Fig. 2 Lithological column with conodont zones for the Wordian-Wuchiapingian period at Tieqiao section,Laibin,South China Bed numbers of Maokou Formation are referring to subdivision in Sha et al.(1990). Member numbers are from Shen et al.(2007). Sampling locations for conodont biostratigraphy are marked with short bars on the right side of the lithological column. |
以0.1 m间距对卡匹敦阶底界之下31.2 m至C-W界线之上2.6 m的地层采样(图 2),共采集无定向样品1456个.低场体积磁化率测试在卡帕桥KLY-3S 型磁力仪上完成,称重后换算成质量磁化率(χ)(Ellwood et al.,1988),测试在中国地质大学(武汉)地空学院岩石磁学实验室完成.为了判断样品中磁性矿物类型,选择代表性样品进行热磁实验(κ-T曲线).测试时,粉末状样品在氩气环境中以11 ℃/min的速度从室温加热到700 ℃,随后以相同速率冷却至室温.热磁实验在中国地质大学(北京)古地磁和环境磁学实验室完成,所用仪器为卡帕桥KLY-4S/CS3 型磁力仪/温控系统.
3.3 时间序列分析在本次研究中,对原始 数据(未平滑)进行时间序列分析.因为样品为等间距(0.1 m)采集,假设采样深度与时间线性相关,即Δx(采样深度变化)与Δt(时间变化)成正比,即可开展频谱分析.沉积速率变化、差异成岩或其他因素影响越大,这个假设的真实度越低,在功率谱图中会产生更多的噪音,谱峰的置信水平越低(Ellwood et al.,2011).采用多窗谱法(Multi Taper Method,MTM)和傅里叶变换(Fourier Transform,FT)法对 数据进行谱分析.为了减少谱泄漏、增加动态区间,数据经过去趋势(Detrended)处理,调用了汉宁窗(Hanning window)(Jenkins and Watts,1968;Weedon,2003). 谱峰的显著性检验(置信水平90%、95%和99%)利用SSA-MTM工具(Dettinger et al.,1995)中MTM方法(Ghil et al.,2002)计算确定.
为方便数据展示和对比,在图形中采用Bar-Log格式(Ellwood et al.,2011;García-Alcalde et al.,2011),类似于磁性地层学中磁极性带划分.利用样条函数对原始质量磁化率曲线进行平滑拟合,平滑拟合类似于带通滤波,提取出目标频率信号,当 需要提取长周期时(如偏心率),增加系数λ,曲线更平滑,长周期显现出来.根据需要平滑曲线后,如同 磁性地层学中建立极性带一样,选择最高点和最低 点之间的中点定义为磁性地层磁化率(Magnetostratigraphic Susceptibility,MSS)带界线,如果 的变化趋势(升高或降低)由两个或以上的点组成,认为这个变化是一个有效周期(MSS带),将高值部分充填成黑色,低值部分留为空白(Ellwood et al.,2012).
4 结果 4.1 岩性与生物地层铁桥剖面卡匹敦阶的岩性和牙形石延限带见图 2.将沃德—卡匹敦阶(W-C)界线定在H116层下部,由牙形石分子Jinogondolella postserrata首现确定.由于H116层下部硅化严重,牙形石采样精度有限(首现牙形石分子J. postserrata样品与前一个样品之间的间距为11.8 m,图 2),可能导致W-C界线存在不确定性(实际界线可能会下移0~11.8 m). 基于牙形石分子Clarkina postbitteri postbitteri的首现(Jin et al.,2006),卡匹敦—吴家坪阶(C-W)界线位于H119层顶部,6j和7a—7b之间.在卡匹敦阶内部共确定了7 个牙形石带(图 2),从底到顶依次为J. postserrata,J.shannoni,J.altudaensis,J.prexuanhanensis,J. xuanhanensis,J. granti和C. postbitteri hongshuiensis(图 3),与前人划分方案一致(Jin et al.,2001,2006; Mei et al.,1998).H115—H118层由灰岩与硅质岩互层组成,其中灰岩为灰色中薄层,主要是灰泥岩—粒泥岩,含有孔虫、海百合茎和介形虫;硅质岩或硅化灰岩主要为暗红色,含有大量放射虫和海绵骨针.浊流沉积在灰岩层中非常发育,通常厚3~6 cm,由向上变细的粒序层组成,代表不完整鲍马序列.浊流沉积的结构和生物组成与背景沉积存在较大差异,浊流沉积通常由生屑泥粒岩组成,含有丰富的有孔虫、海百合茎、苔藓虫及管壳石碎片,生屑强烈侵蚀,从邻近陆架边缘或台地搬运而来,采样时避开这些异地沉积.上述特征表明,H115—H118层形成于斜坡—盆地环境.H119层(来宾灰岩)主要由灰白色中厚层灰岩组成,化石丰富,主要可分为7个单元,对应于Jin等(2001,2006)中的Unit 2—8,与下伏的硅质岩—灰岩互层(H115—H118)截然不同.H113—H118层到H119层沉积相的突然变化记录了卡匹敦晚期全球性的海退事件(Chen et al.,2009;Jin et al.,2001,2006;Qiu et al.,2014;Wignall et al.,2009b),这一海平面下降事件导致华南大部分地区茅口组上部地层缺失.
 |
图 3 (a)口视图;(b)侧视图;(c)反口视图.图中标尺长度为100 μm.1 Jinogondolella shannoni(Wardlaw 1994),SP_012; 2 Jinogondolella granti(Mei and Wardlaw 1994),06-70_027b; 3 Jinogondolella altudaensis(Kozur 1992),S3_033; 4 Jinogondolella xuanhanensis(Mei and Wardlaw 1994),S3_055; 5 Clarkina postbitteri postbitteri(Mei and Wardlaw 1994),S6_054.
Fig. 3 Key conodonts from the Tieqiao section,Laibin,South China (a)for upper view,(b)for lateral view and (c)for lower view. Scale bar for 100 μm. |
来宾灰岩底部(Unit 2)由块状灰岩组成,下部含燧石透镜体,发育向上变细的正粒序层.燧石中放射虫丰富,块状灰岩中富含海绵和有孔虫,为斜坡—盆地相沉积.上覆Unit 3由薄层灰岩组成,发育重力滑塌作用形成的软沉积变形构造,指示斜坡沉积环境.Unit 4和5主要由块状浅粉红色灰岩组成,富含苔藓虫、珊瑚、海百合茎和有孔虫,缝合线大量发育.此外,在Unit 5上部发育一层平行于层面的腕足壳体,指示风暴作用.Unit 4和5为典型的浅水碳酸盐台地相沉积.Unit 6为灰色灰岩,层面见极丰富 的海百合茎,大小混杂,茎板保存完好,显示原地埋藏特征,解释为海百合茎滩相沉积.Unit 7—8转变成暗灰色中薄层灰岩,该段指示海侵开始(李波等,2015).
茅口组上覆的吴家坪组由暗色薄层硅质岩和硅化灰岩组成,富含放射虫、海绵骨针,缺乏底栖生物,指示吴家坪早期海侵后低能斜坡或盆地相沉积环境.综上所述,H113—H118层和吴家坪组底部沉积于相对较深的斜坡—盆地相环境,而来宾灰岩(H119)主要沉积于浅海环境,因此,可认为来宾灰岩是硅质岩中的灰岩“内序列”(intersequence),形成于最大低水位期(Jin et al.,2001,2006).
4.2 磁化率(χ)铁桥剖面的i>χ值普遍较低,分布范围为 -2.22×10⁻⁹ ~5.92×10⁻⁸ m3·kg-1,平均值1.48×10⁻¹⁰ m3·kg-1.Ellwood等(2000)曾对包括灰岩、泥灰岩、页岩等在内的海相沉积岩进行统计,发现χ分布在1×10⁻⁹ m3·kg-1到 2 × 10⁻⁷ m3·kg-1之间,平均值为5.5×10⁻⁸ m3·kg-1.铁桥剖面沃德—吴家坪阶χ明显低于这一范围,表明这一时期输入到赣湘桂盆地来宾地区的陆源物质明显偏少.整个剖面可分成两个截然不同的部分,630 m之下,绝大部分χ为负值(抗磁性),630 m之上,χ发生显著变化,转变为正值(图 4和图 5).从图 4可看出,在普遍偏低的磁化率数据中,存在一些磁化率异常高值,这些数据可能是由于火山灰跌落或风化等原因造成,并不是气候波动导致,为异常数据,在频谱分析时予以剔除.
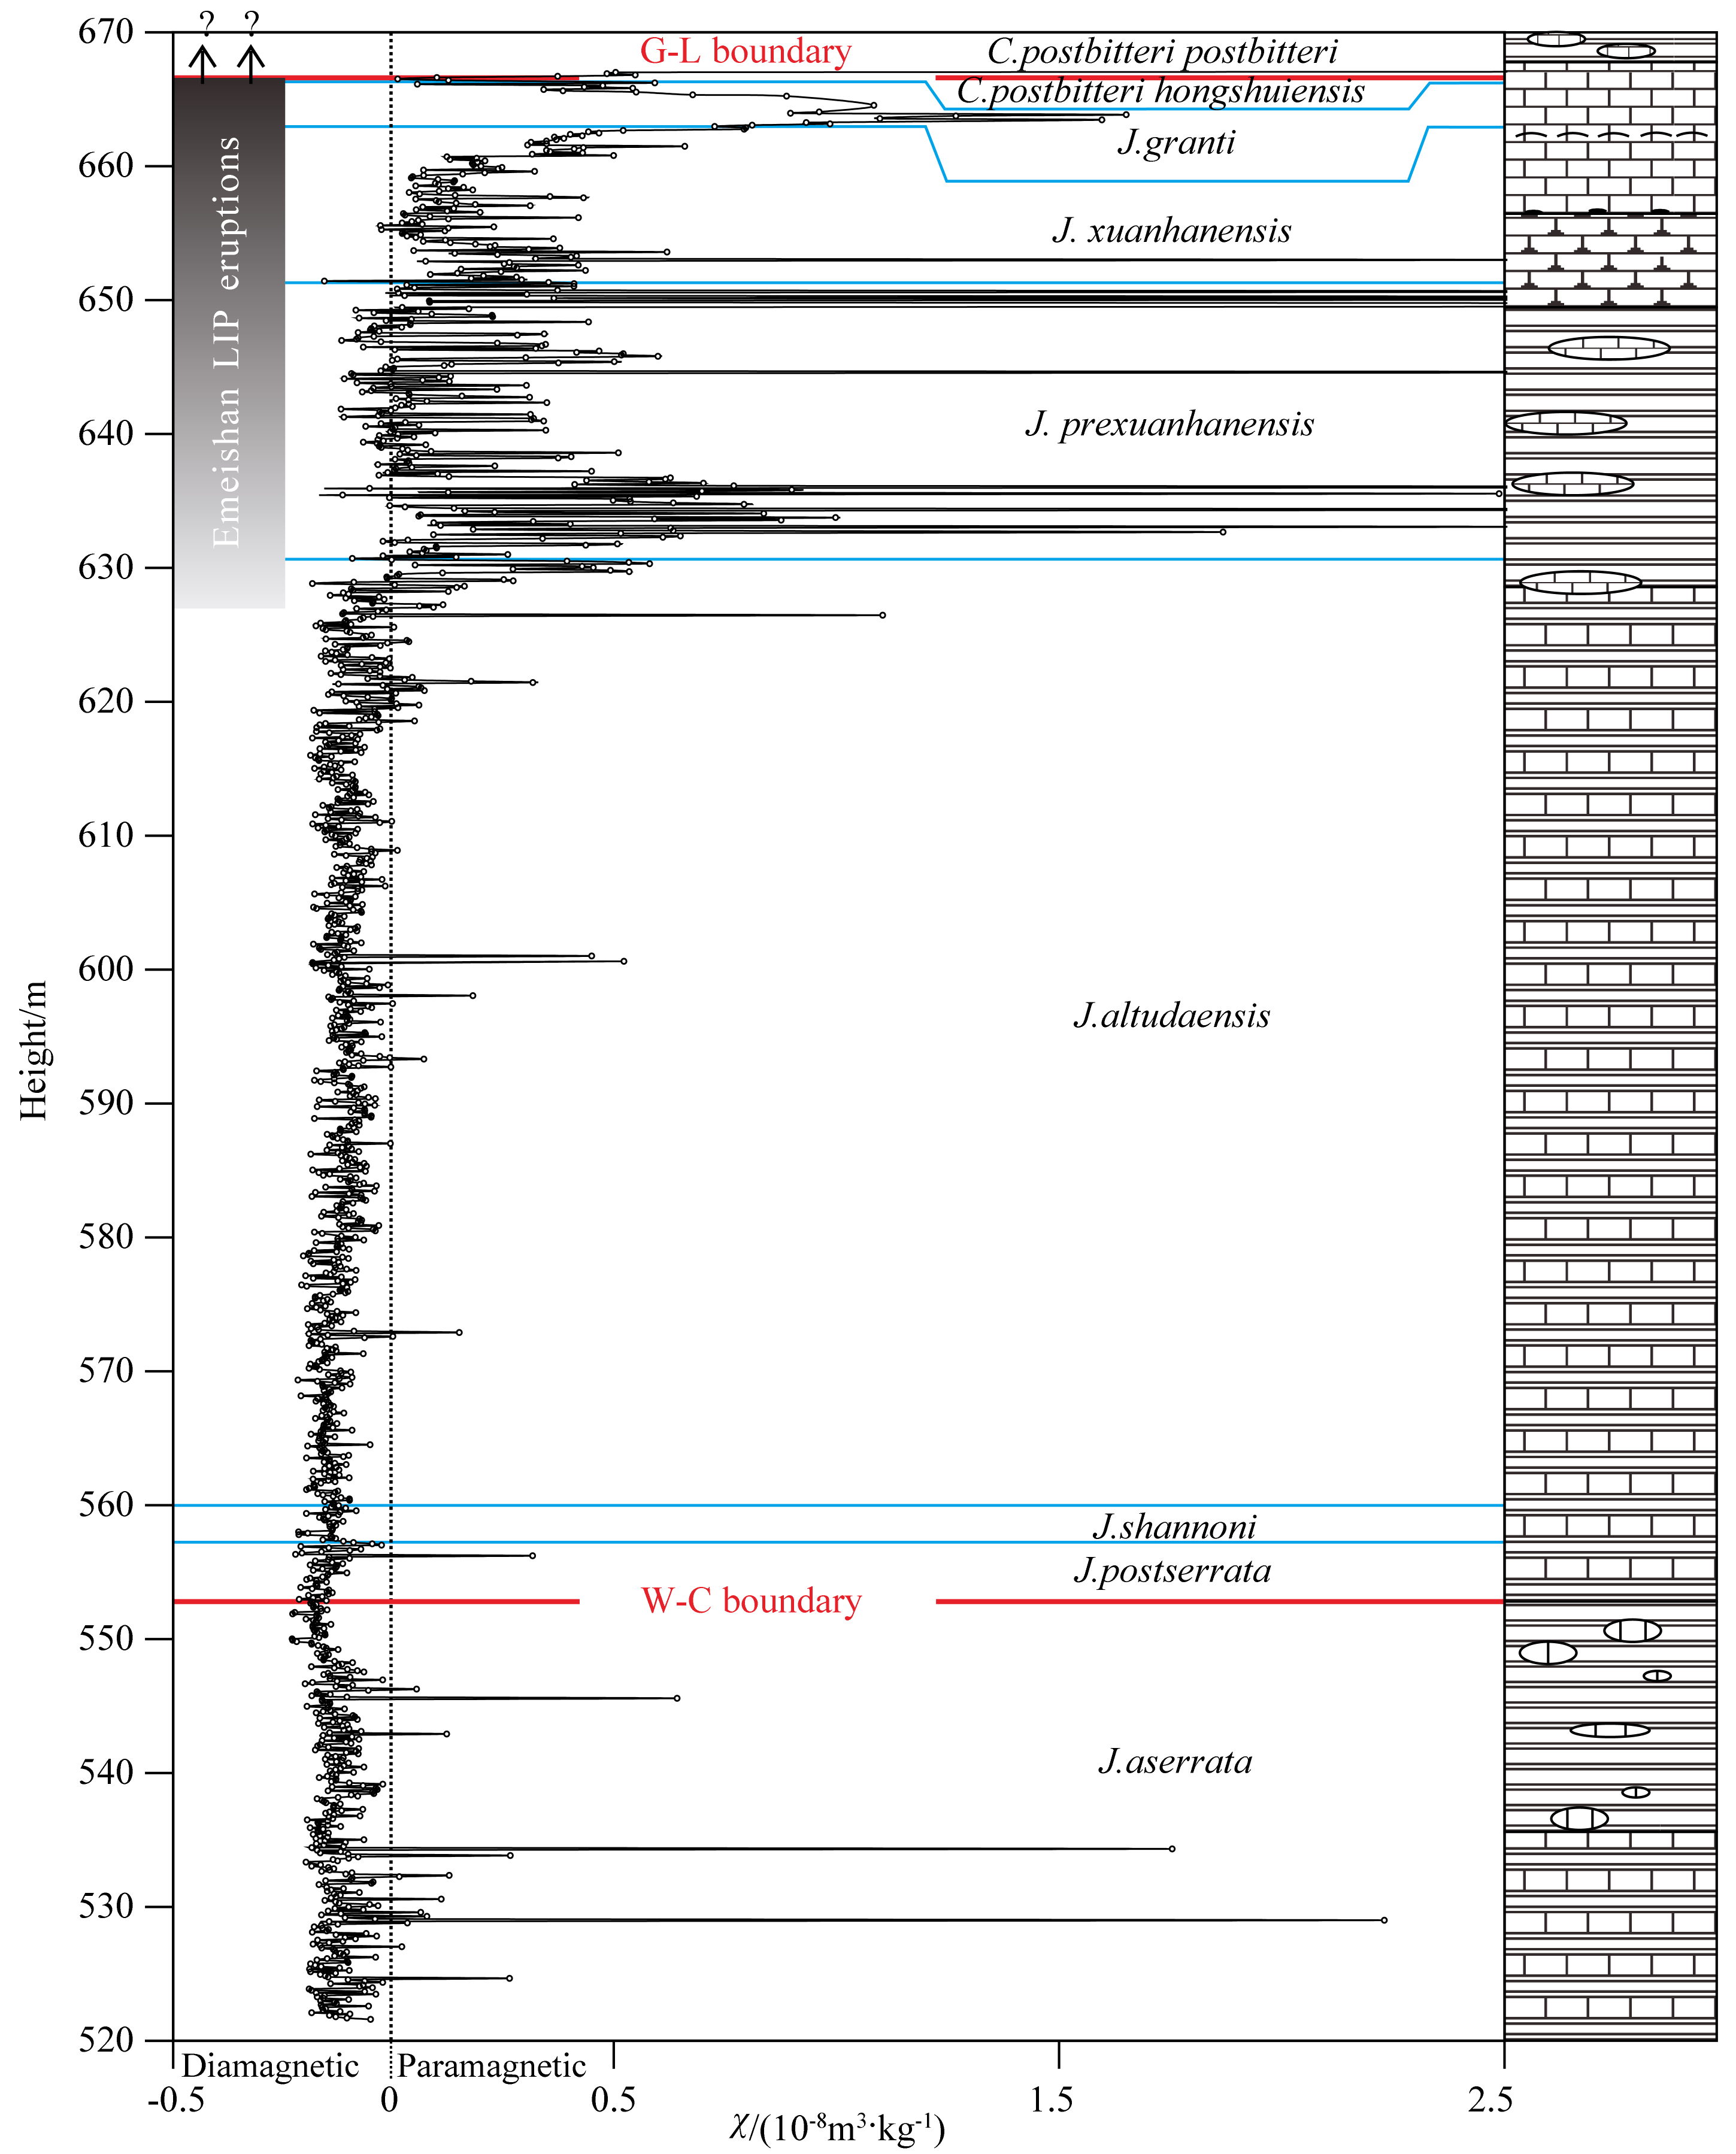 |
图 4 广西来宾铁桥剖面沃德—吴家坪阶磁化率(χ)剖面
阴影部分为峨眉山大火成岩省喷发的时间范围(Ali et al.,2002; Sun et al.,2010),岩性图例见图 2. Fig. 4 Raw MS profile across the Wordian-Wuchiapingian period at Tieqiao section,Laibin,South China Time duration of the Emeishan LIP emplacement event is marked with a grey shaded box(Ali et al.,2001; Sun et al.,2010).See lithology legend in Fig. 2. |
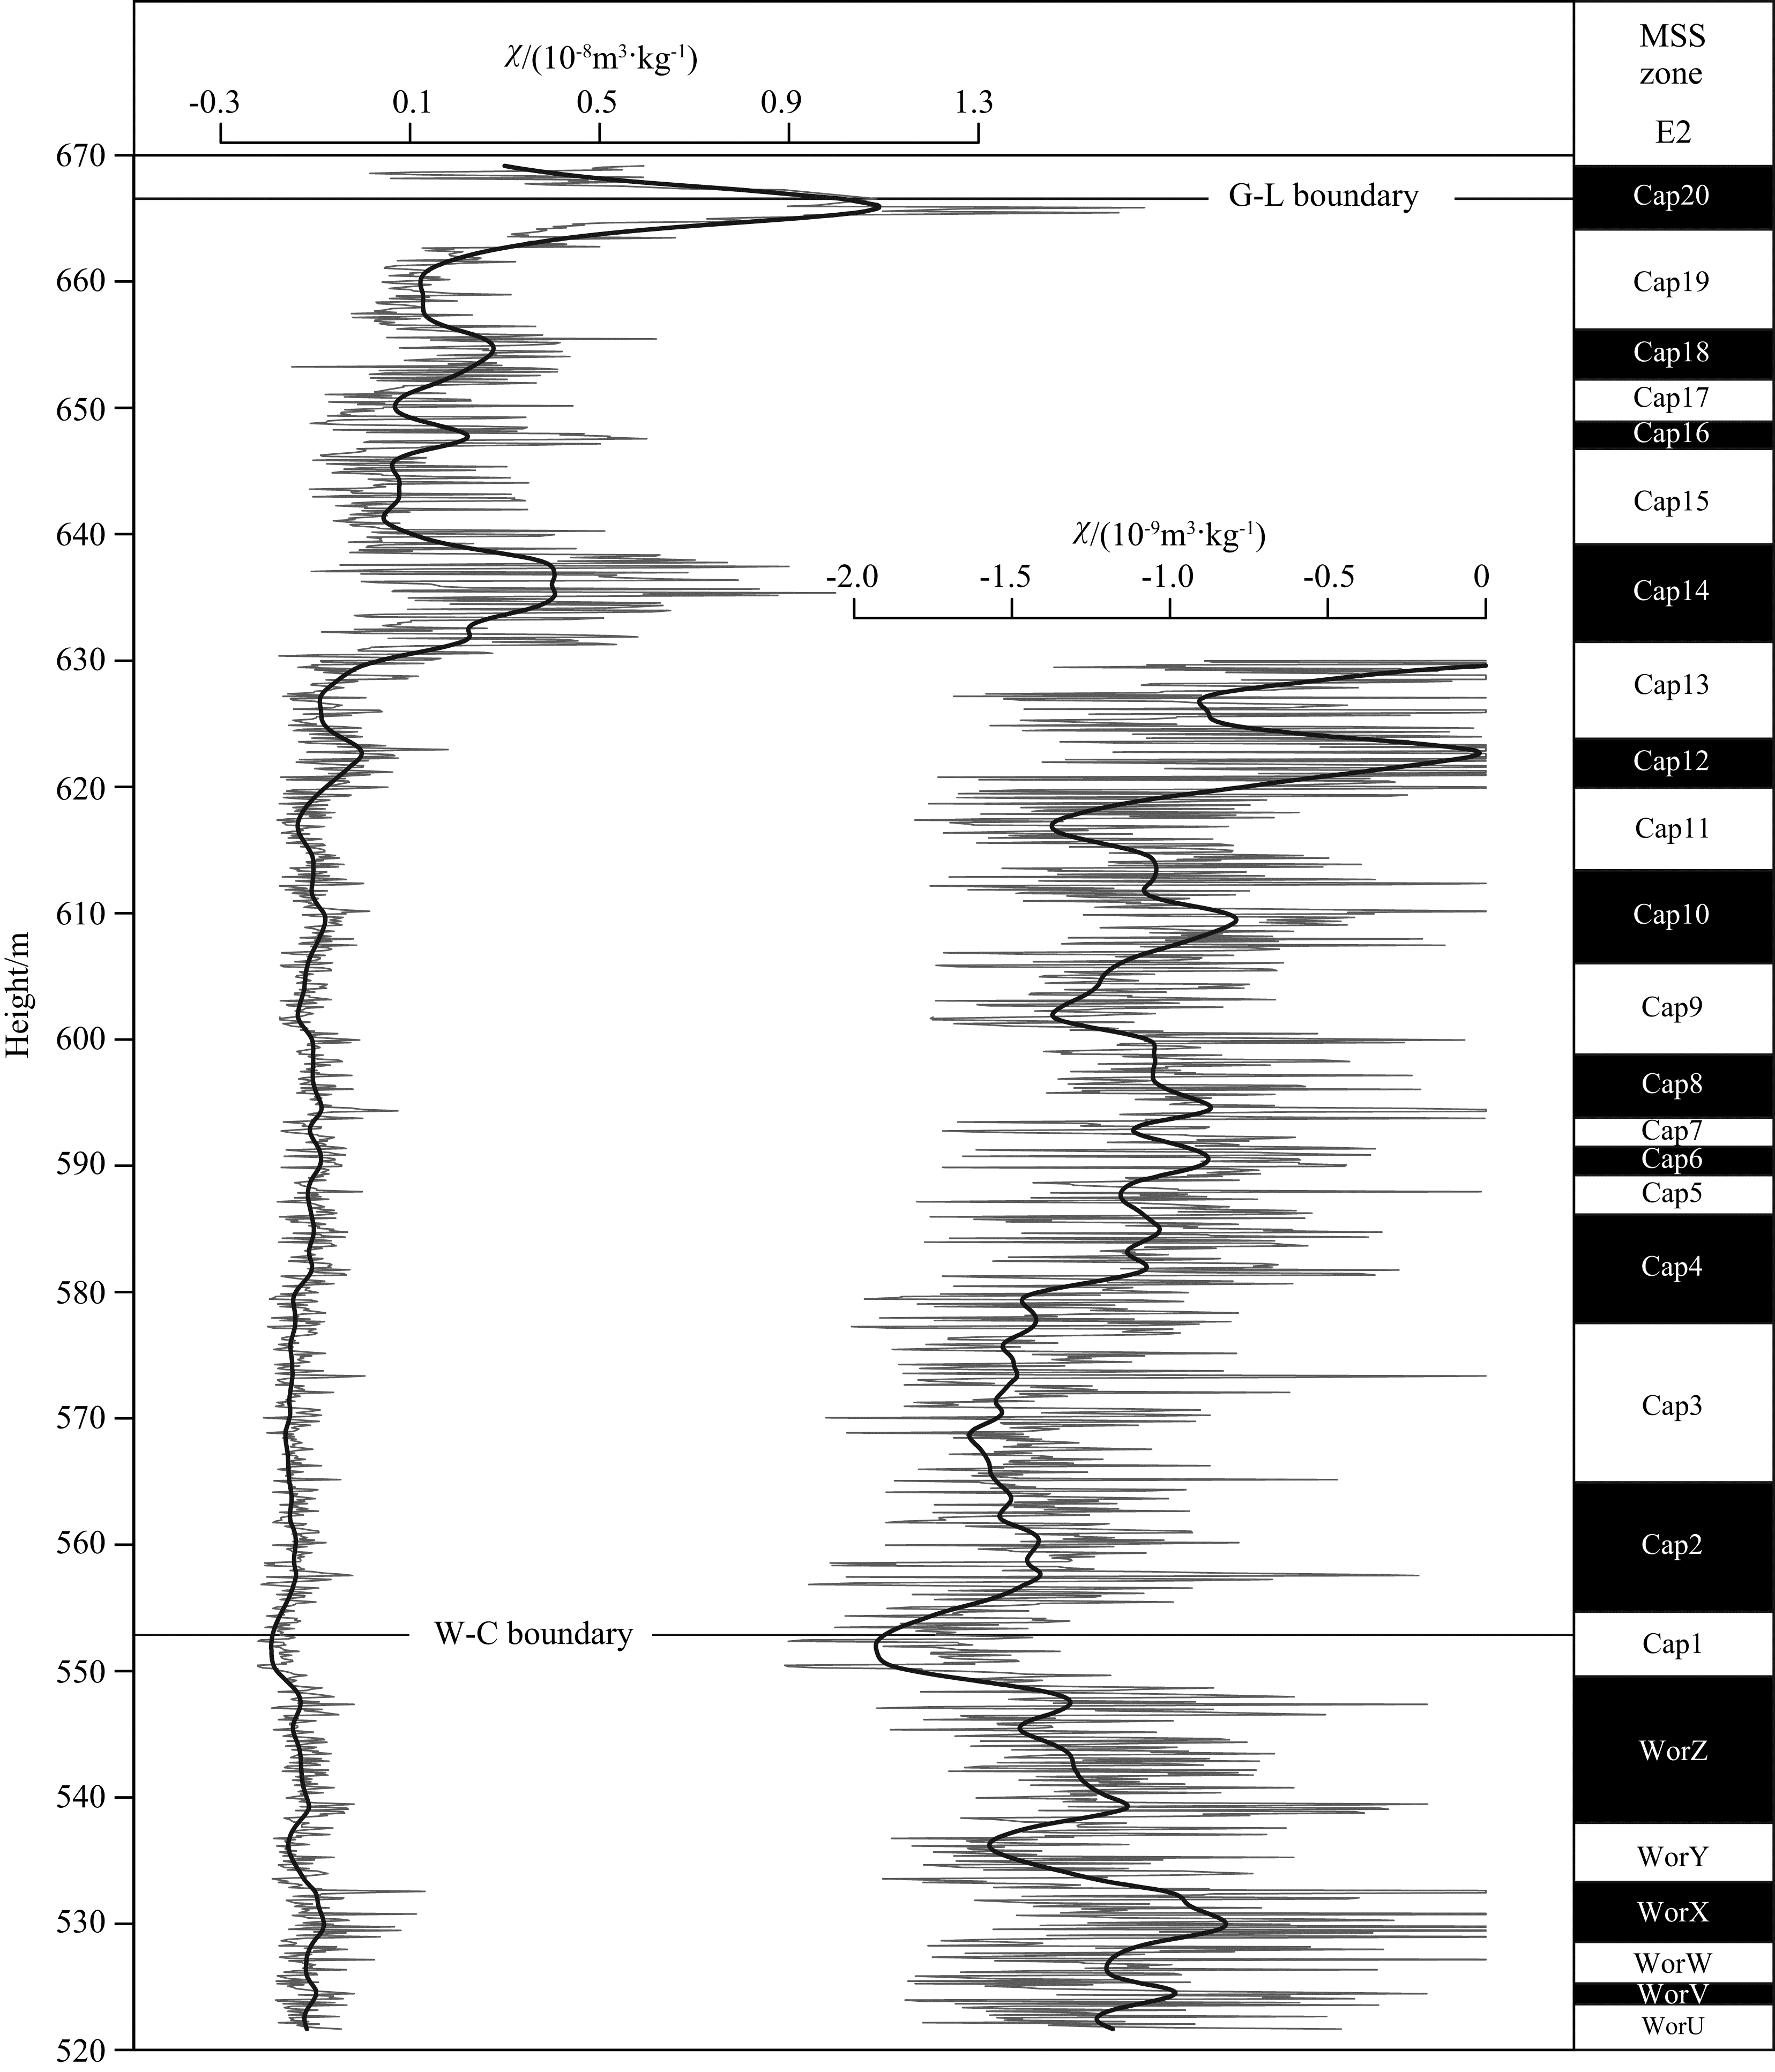 |
图 5 广西来宾铁桥剖面沃德—吴家坪阶磁化率和MSS带 虚线为原始χ数据(剔除异常点,用相邻点插值替代),实线由原始χ经样条函数拟合得出,右侧曲线是磁化率剖面中-下部(520~630 m)放大后的曲线. Fig. 5 MS data and MSS zonation for the Wordian-Wuchiapingian period at Tieqiao section, Laibin, South China Dashed lines represent raw MS data with anomalous data points removed and substituted by adjacent data points via linear interpolation. Solid lines are smoothed using splines. The close-up of the middle-lower interval (520~630 m) of MS profile is on the right side of the figure. |
代表性样品的κ-T曲线特征见图 6,所有加热 曲线均表现出相似的变化趋势.在低温段(20~200 ℃)磁化率曲线变化不大,当温度超过350 ℃时,磁化率迅速增加,在500 ℃时达到峰值,然后迅速降低,在580 ℃时降为零,显示出磁铁矿的居里温度(Dunlop and zdemir,1997).冷却曲线同样反映磁铁矿存在,冷却至室温时,磁化率比初始磁化率高出很多,表明350 ℃时发生了相转变,生成了新的强磁性磁铁矿,这些新生成的磁铁矿可能是由含铁硅酸盐矿物或粘土矿物(如伊利石)、含铁水合物、针铁矿中的 铁受热转化而成(Dunlop and zdemir,1997;Ellwood et al.,2007).
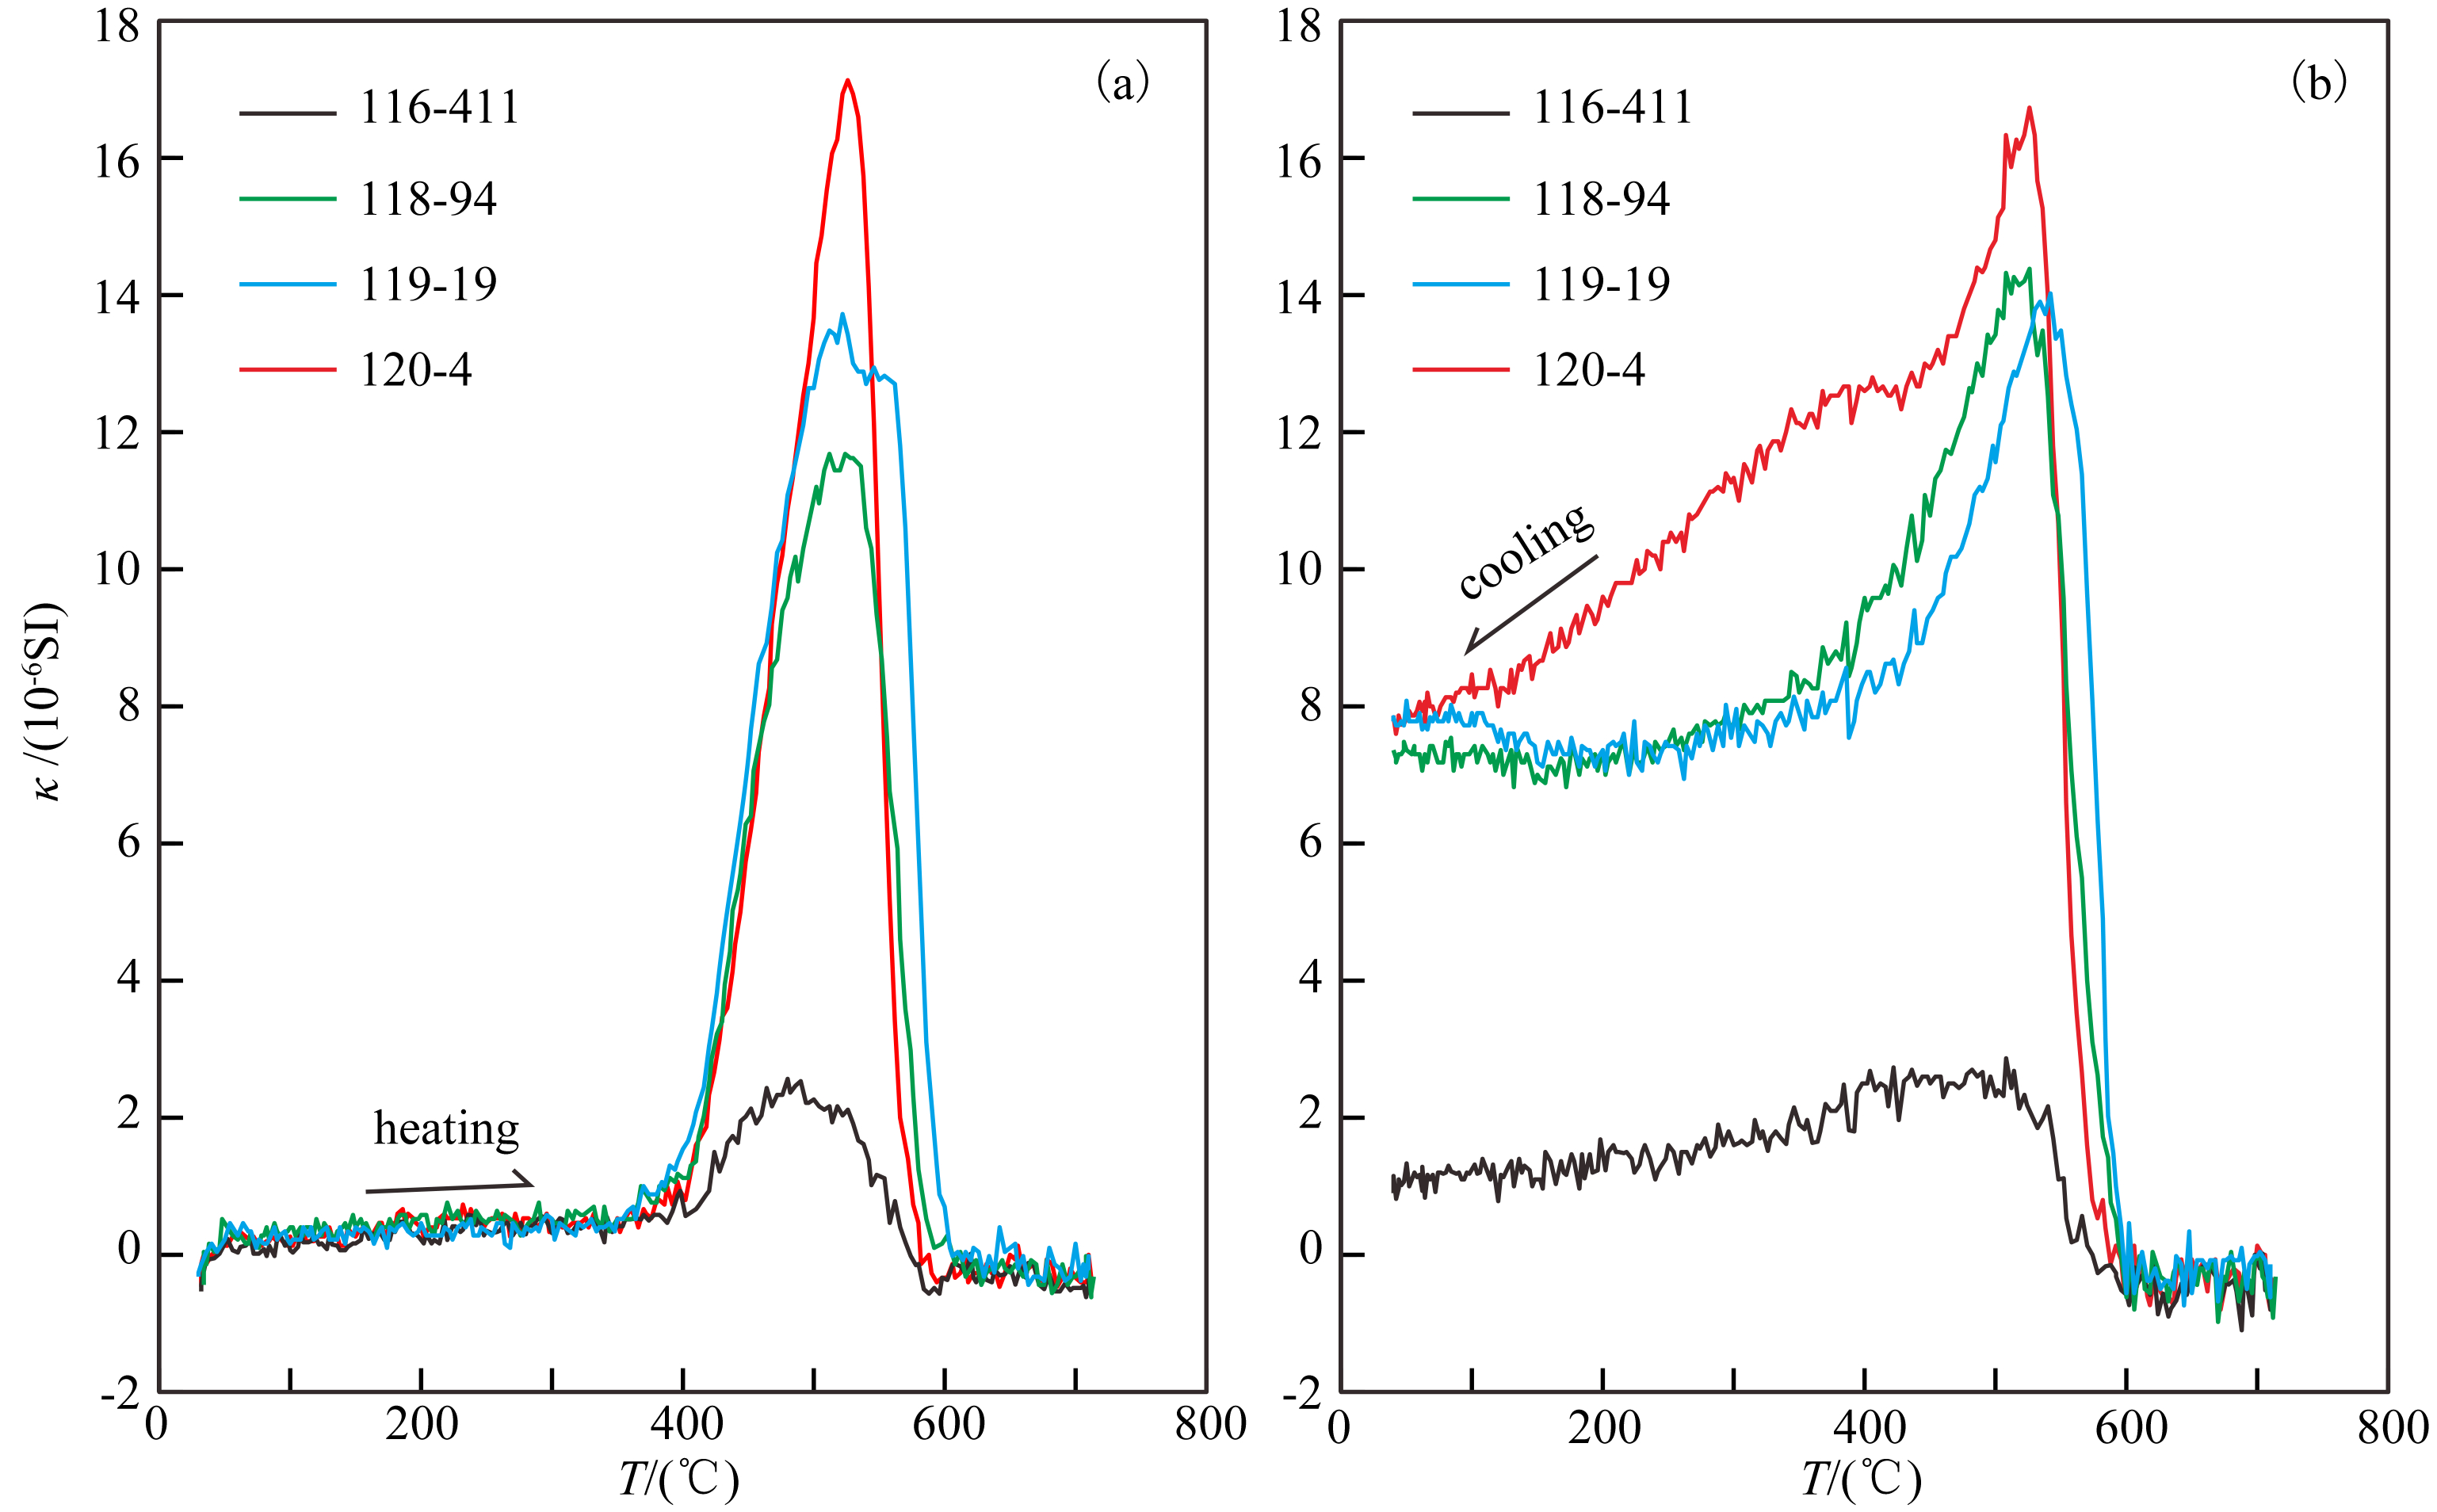 | 图 6 广西来宾铁桥剖面沃德—吴家坪阶代表性样品的κ-T曲线 Fig. 6 κ-T curves for selected samples of the Wordian-Wuchiapingian period at Tieqiao section, Laibin, South China |
原始χ经过MTM和FT分析后的功率谱结果见图 7,许多峰值具有较高的置信水平,这一结果验证了之前的假设,因为沉积速率差异、成岩作用或其他因素导致噪音存在,反映广西来宾地区中二叠世晚期磁化率受控因素的复杂性.因为米兰科维奇周期之间的比例固定,在功率谱图的峰值中,假如有六个峰值之间的比值恰好和米兰科维奇周期之间的比例一致(最理想状态,通常会缺少几个周期,或有些周期显著性较低),且置信水平较高,这几个峰值即为米兰科维奇周期.经过反复检验和比较,假设指定0.78 cycles·m-1为米兰科维奇长地轴斜率周期(O2,44.1 ka),除短地轴斜率周期(O1)外,其他所有米兰科维奇周期均可检测出来,且具有较高的置信水平,其中4个超过99%,它们分别是405 ka的 长偏心率周期(E2),位于0.08 cycles·m-1;100 ka的短偏心率周期(E1),位于0.35 cycles·m-1;20.95 ka 的长岁差周期(P2),位于1.69 cycles·m-1;17.7 ka 的短岁差周期(P1),位于1.94 cycles·m-1.根据指 定的O2周期,计算出整段沉积序列的时限为5.07 Ma,而整段沉积序列的平均沉积速率为2.91 cm·ka-1.
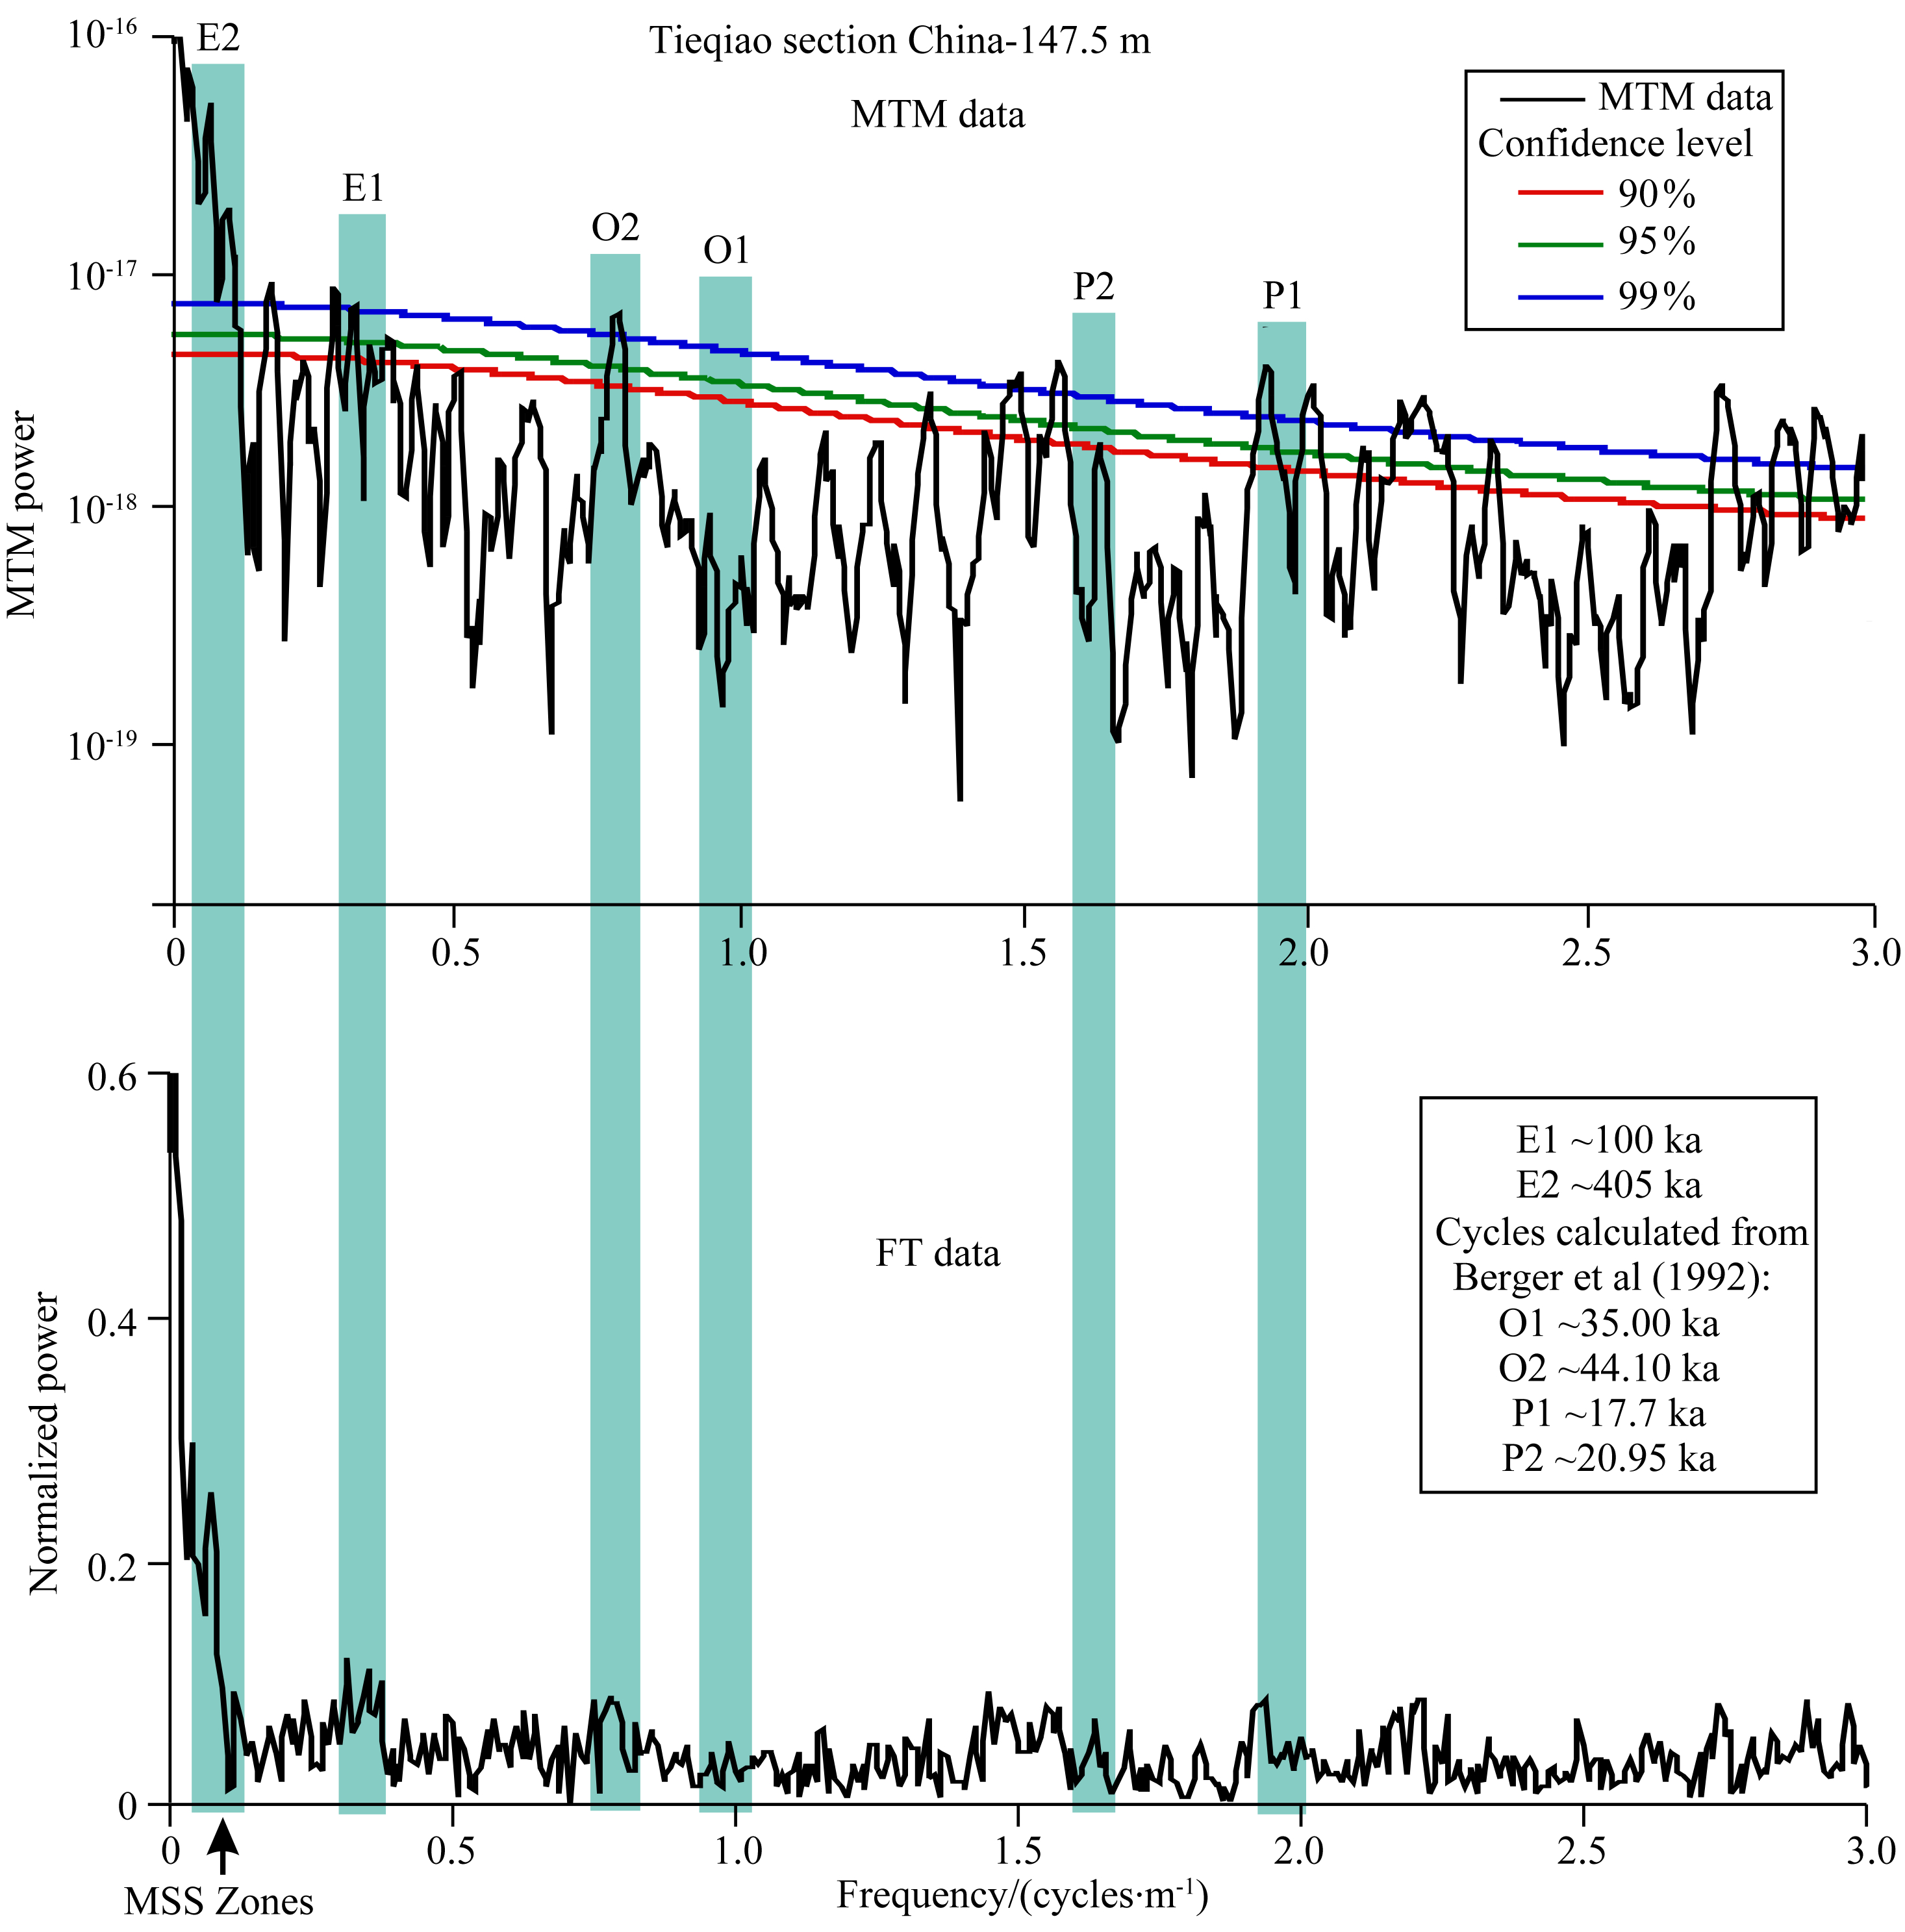 | 图 7 广西来宾铁桥剖面沃德—吴家坪阶χ数据功率谱图 Fig. 7 Analysis result of spectral power with Multi-Taper (MTM) and Fourier Transform (FT) methods for the raw (unsmoothed) MS data sets from Tieqiao section, Laibin, South China |
老地层中长偏心率周期更易保存,因此选择在χ数据中提取E2周期,以半E2周期(200ka)为单位建立MSS带.整段沉积序列的时限为5.07 Ma,使用样条函数对原始χ进行拟合(λ=5),使之符合频谱分析结果,即拟合后的Bar-Log(图 5)包含25个200 ka周期的MSS带. χ数据中的旋回代表周期性(E2周期)气候控制输入到海洋中顺磁性和亚铁磁性矿物颗粒通量,这些碎屑物质通过河流或风输入到海洋中,导致磁化率周期性变化,反映在图 5中的MSS带中.
5 讨论 5.1 磁化率(χ)铁桥剖面样品磁化率普遍较低(大部分为负 值),表明其主要由抗磁性方解石或石英组成,顺磁 性和亚铁磁性矿物含量极低,反映来宾地区在卡匹敦期较孤立,远离陆源.从全球角度来说,卡匹敦期,华南板块位于古特提斯洋中,远离联合古陆(Kasuya et al.,2012;Ziegler et al.,1997),而来宾地区处于赣湘桂盆地内部,远离扬子板块内部的华夏古陆和康滇古陆(图 1),陆源物质来源匮乏导致输入到沉积盆地中的碎屑物质较少,样品中自生方解石和石英占主导,磁化率低.
铁桥剖面G-L界线χ的变化与蓬莱滩剖面(G-L界线GSSP)的变化一致(图 8),在两个剖面中,从G-L界线之下2m到界线处,χ明显增加,在界线之下1 m处达到最大,这与中二叠世晚期的海退一致.然后χ开始减少,一致穿过界线,与来宾灰岩顶部反映的海退开始有关.在两个剖面中,界线下方χ增加,表明输入到赣湘桂盆地中的顺磁性和亚铁磁性矿物通量在G-L界线开始增加,但在界线上方又迅速降低. 在两个剖面G-L界线变化的一致性证明磁化率对环境变化指示的可靠性.
 |
图 8 广西来宾地区铁桥剖面和蓬莱滩剖面(G-L GSSP)卡匹敦—吴家坪阶界线χ对比 蓬莱滩剖面的磁化率数据和牙形石带来自于Clark (2012).带点虚线为原始数据,实线为平滑后的数据,平滑数据由JMP统计软件中的样条函数计算. Fig. 8 Theχ profile across the Capitanian-Wuchiapingian (C-W) boundary at Tieqiao section in comparision with GSSP of Guadalupian-Lopingian (G-L) at Penglaitan section, Laibin, China The MS (χ) data set and conodont zones of the G-L GSSP are modified from Clark (2012). Raw MS data are represented as dashed curves with solid circles. Solid curves are smoothed using splines (splines are calculated with JMP statistical software package by SAS Institute Inc.). |
卡匹敦阶上部(630 m之上,J.altudaensis带顶部)χ突然增加,表明输入到海洋中的陆源碎屑物质 通量增加.虽然卡匹敦期晚期的海退作用对χ突然增加有所贡献,但明显的海退始于来宾灰岩段(656.5 m)(Jin et al.,2001;Jin et al.,2006),对应于J. granti带中χ增加,晚于J.altudaensis带中χ增加,因此不能把卡匹敦晚期χ突然增加全部归因于海退.本文认为卡匹敦晚期χ突然增加与峨眉山大火成岩省喷发有关,主要原因如下:(1)峨眉山玄武岩的大规模喷发(体积0.3×10⁶~0.5×10⁶ km3,Ali et al.,2005)以及随后的风化剥蚀作 用一定会导致大量碎屑物质输入到海洋系统,同时期或后期的沉积物势必会记录这一事件;(2)详细的生物地层工作表明,峨眉山大火成岩省喷发的启动位于J. altudaensis带中,喷发规模随后在J. xuanhanensis 带中增大(Ali et al.,2002;Sun et al.,2010),这与铁桥剖面卡匹敦阶上部J. altudaensis带顶部χ增加一致(图 4);(3)在铁桥剖面和蓬莱滩剖面卡匹敦晚期地层中均发现了砂粒火山碎屑,由暗色烧渣子颗粒组成,包含微小的斜长石斑晶,这些颗粒通常具有尖锐的棱角,气泡腔被打碎形成破碎边缘,表明它们并没有经历河流的搬运和磨蚀作用,应该是风成成因(Wignall et al.,2009b),证明火山喷发带来的 碎屑物质确实进入到沉积盆地中.所有这些证据均 表明,在卡匹敦晚期峨眉山玄武岩喷发导致卡匹敦晚期χ信号增强.而且,峨眉山玄武岩喷发对整个生物界均有较大影响,例如在J. altudaensis带上部,虫 筳 类和钙藻大量灭绝(Bond et al.,2010b;Wignall et al.,2009a).如果卡匹敦阶上部χ突然增加是峨眉山大火成岩省喷发引起这一假设成立,卡匹敦阶顶部χ增加的起点即是峨眉山玄武岩喷发开始,利用文中建立的FPTS即可对峨眉山玄武岩喷发的启动时间精确定年.
5.3 浮点年代标尺(FPTS)以半E2周期(200 ka)为单位建立一个持续时间为5.07 Ma的标准参考带(St and ard Reference Zonation,SRZ)(图 9),包含25个200 ka等间距周期(WorU—Cap20).图 5中的MSS带同样是以半E2周期为单位建立,但由于沉积速率存在差异,每个MSS带并非等间距.将MSS带与SRZ进行图形对比,以SRZ气候模型为横坐标,以MSS带为纵坐标,将SRZ和MSS带中对应的每半个E2周期的顶底投影到坐标轴中,然后对这些点进行线性拟合,得到一系列最佳相关线(Lines of Correlation,LOC),这与Shaw(1964)应用在生物地层数据中的图形对比方法类似.
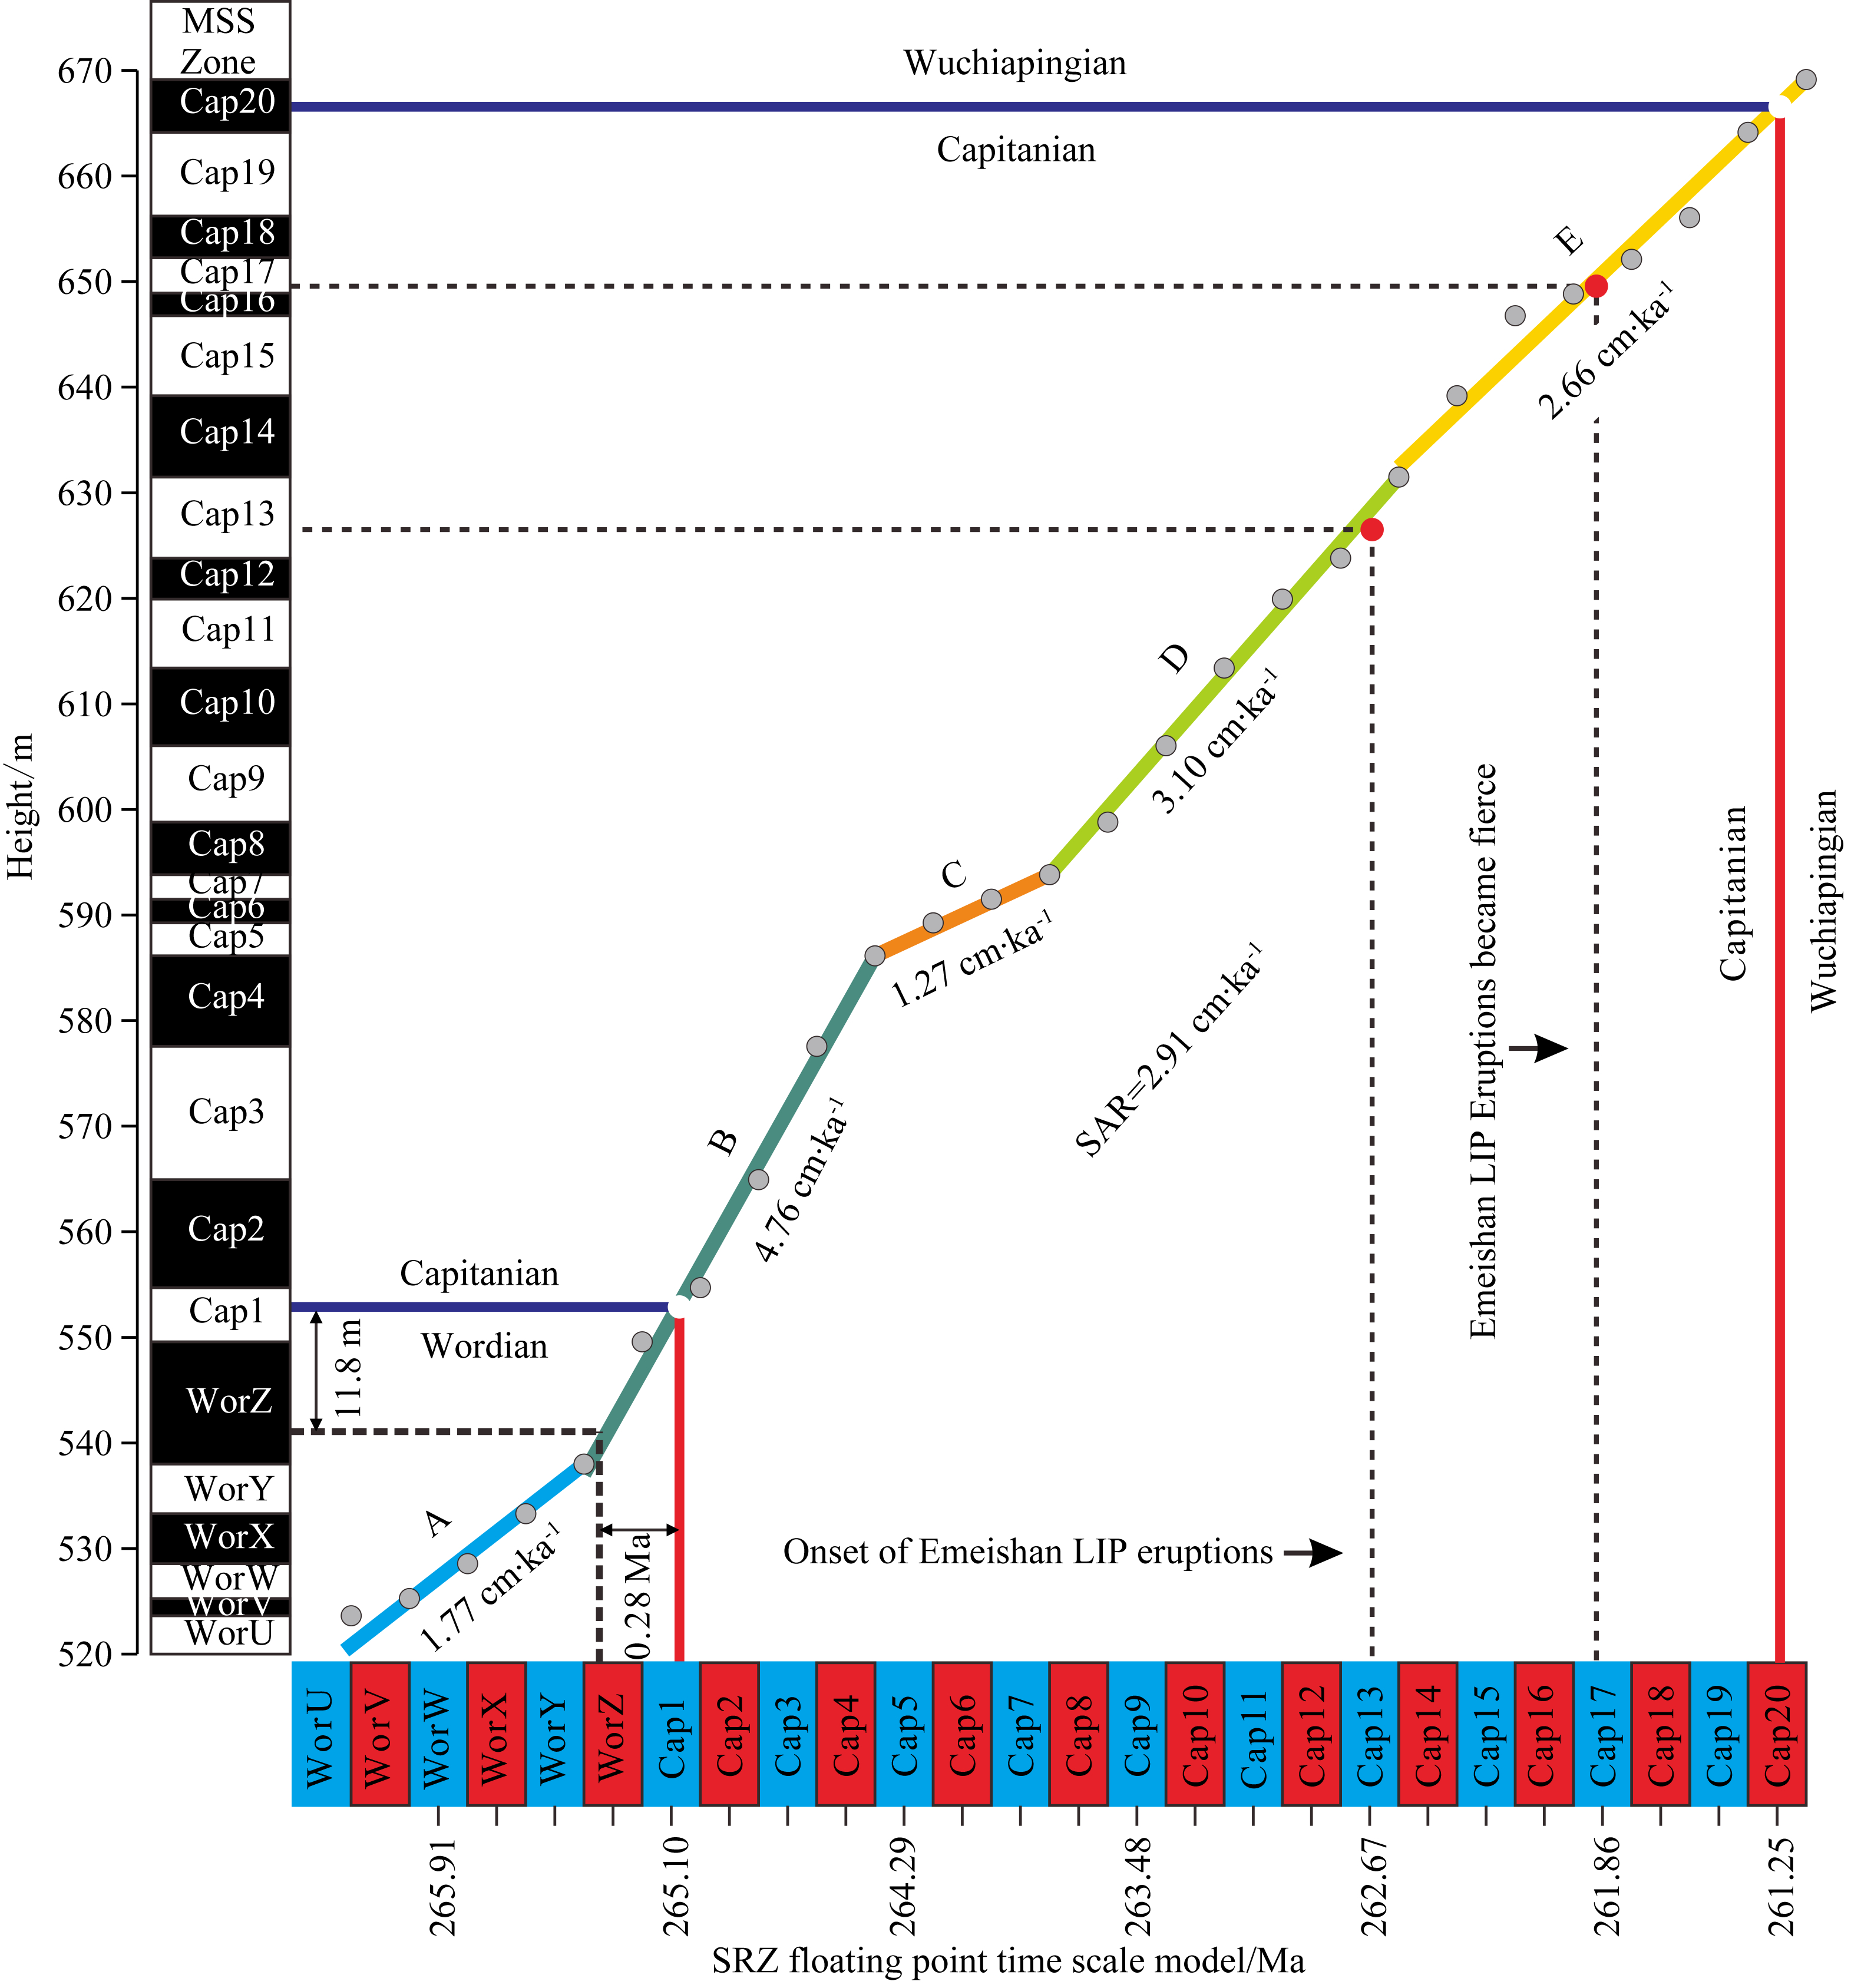 | 图 9 广西来宾铁桥剖面沃德—吴家坪阶MSS带与SRZ带的图形对比 Fig. 9 Graphic comparison of the MSS zonation from Tieqiao section to a standardized reference zonation (SRZ) model for the Wordian-Wuchiapingian period |
利用这个方法可在卡匹敦阶建立高分辨率的地质年代标尺,分辨率为200 ka.这个地质年代标尺独立于放射性同位素年龄,可用来计算生物带的时限,估算峨眉山大火成岩省喷发的启动时间.对于这个地质年代标尺绝对年龄(“锚点”)的确定,本文选择265.1 Ma(Gradstein et al.,2012)作为卡匹敦阶底界年龄.如果其他学者的后续研究赋予卡匹敦阶底界新的更为精确的绝对年龄,或在某个MSS带中获得精确的放射性同位素年龄,即可将这个新年龄标记到对应的SRZ气候模型坐标上,然后重新调整SRZ气候模型上每个刻度的绝对年龄.因此,本文建立的地质年代标尺可随时更新,是一个浮点年代标尺.
在卡匹敦阶共识别出19个200 ka 的半E2旋回,因此卡匹敦阶的时限为3.85 Ma,由于W-C底 界不确定,因此卡匹敦阶时限可能存在+0~0.28 Ma 的误差(图 9).这个时限比其他学者给出的估计值要短,例如,2004年与2008年国际地质年代表给出的参考值为5.4 Ma(Gradstein et al.,2004;Ogg et al.,2008),2012年国际地质年代表给出的参考值为5.3 Ma(Gradstein et al.,2012),但存在±0.8~1.4 Ma的误差.
铁桥剖面MSS带与SRZ带之间的图形对比,产生了五个LOC段(图 9中的A—E段),代表不同时期不同的沉积速率(SAR).这些沉积速率的差异降低了MTM和FT数据中功谱峰值的置信水平(图 7).A段(1.77 cm·ka-1)和C段(1.27 cm·ka-1)沉积速率相对最低,D段(3.10 cm·ka-1)和E段(2.66 cm·ka-1)沉积速率中等,B段(4.76 cm·ka-1)沉积速率最大.沉积速率差异在MSS带中非常明 显,Wor U—Wor Y、Cap5—Cap7非常短,沉积速率快;Wor Z—Cap 4非常长,该段沉积速率慢;而Cap 8—Cap20厚度中等,沉积速率中等(图 5).
5.4 牙形石带时限和峨眉山大火成岩省喷发的时间基于SRZ FPTS模型,估算出卡匹敦阶内各个牙形石带的时限(表 1),延限最短的C. postbitteri hongshuiensis仅仅26600年,延限最长的J. altudaensis 持续了2.3 Ma. 峨眉山玄武岩在瓜德鲁普晚期喷发,虽然前人对其开展了大量地球化学研究,但喷发启动的绝对年龄和喷发持续时间仍不确定,因为很难在喷发开始或结束时获得精确的锆石年龄(Liu and Zhu,2009),因此,精确的绝对年龄约束仍需进一步研究.生物地层对比提供一种确定喷发启动时间的折中办法,前人通过详细的生物地层对比工作将峨眉山大火成岩省喷发启动时间精确约束在有孔虫(He et al.,2003;He et al.,2006)或牙形石带(Sun et al.,2010)内,为估算峨眉山大火成岩省喷发的启动时间奠定了基础.峨眉山玄武岩喷 发始于J. altudaensis带顶部,对应于χ突然增加,将这一点投影到FPTS上,计算出喷发始于262.67 Ma,在G-L 界线之下1.42 Ma.在261.86 Ma时,即在J. xuanhanensis 带中,玄武岩喷发范围和规模增大(Sun et al.,2010).研究表明峨眉山玄武岩主阶段的喷发可能在G-L界线之下(或上)结束(Ali et al.,2002; Sun et al.,2010),基于本文建立的FPTS,计算出峨眉山玄武岩大规模喷发可能持续了1.42 Ma(图 9).
| | 表 1 铁桥剖面卡匹敦阶牙形石带时限 Table 1 Duration of conodont zones of Capitanian in Tieqiao section |
峨眉山玄武岩大规模喷发被认为是导致中二叠 世晚期生物大灭绝的直接原因(Bond et al.,2010a;Wignall et al.,2009a),即峨眉山玄武岩喷发和生物灭绝启动具有同步性,因此,峨眉山玄武岩喷发的启动时间即是中二叠世晚期生物大灭绝的开始时间,为262.67 Ma,位于G-L界线之下1.42 Ma.
6 结论通过详细的生物地层学工作,在卡匹敦阶识别出7个牙形石带,从底到顶依次为J. postserrata,J. shannoni,J. altudaensis,J. prexuanhanensis,J. xuanhanensis,J. granti和C. postbitteri hongshuiensis.
质量磁化率作为古气候替代指标,记录了广西来宾铁桥剖面中二叠世晚期沉积序列中的米兰科维奇旋回.大部分χ为负值(抗磁性),表明来宾地区在该段沉积期孤立于陆源.卡匹敦阶上部χ突然增加与峨眉山玄武岩喷发和卡匹敦晚期全球性海退有关,这些事件导致同期沉积物中的碎屑物质增加.磁化率在铁桥剖面G-L界线附近和蓬莱滩剖面(G-L界线GSSP)表现出一致的变化趋势,具可对比性.κ-T曲线测试结果表明样品中主要携磁矿物为磁铁矿.
利用MTM和FT法对原始质量磁化率数据进行频谱分析,提取出五个米兰科维奇周期,分别是位于0.08 cycles·m-1的E2周期(405 ka)、位于0.35 cycles·m-1 的E1周期(100 ka)、位于0.78 cycles·m-1的O2周期(44.1 ka)、位于1.69 cycles·m-1的P2周期(20.95 ka)和位于1.94 cycles·m-1的P1周期(17.7 ka),其中四个周期的置信水平超过99%.基于MTM和FT分析提取的E2周期(405 ka),对χ进行平滑处理,划分出25个MSS带.对比MSS带和SRZ带,对整个沉积序列建立了高分辨率(200 ka)浮点年代标尺.同时计算出卡匹敦阶的时限为3.85 Ma(可能存在+0~0.28 Ma误差),整个沉积序列(包括沃德阶上部、整个卡匹敦阶和吴家坪阶下部)的平均沉积速率为2.91 cm·ka-1. 计算出卡匹敦阶内部七个牙形石带的时限,从最短的26.6 ka到最长的2.3 Ma.另外,估算出峨眉山大火成岩省喷发的启动时间为262.67 Ma,位于G-L界线之下1.42 Ma,这也是 古-中生代之交双幕式生物大灭绝事件的启动时间.
致谢 中国地质大学(武汉)孙亚东博士在牙形石样品处理和鉴定中起到了决定性作用,实验室成员严雅娟、李傲竹、姚尧、胡宗杰等在样品采集和处理过程中提供了帮助,中国地质大学李永涛和张世红教授在实验测试时提供了帮助,两位匿名审稿人提出了宝贵意见,在此一并致谢!
| [1] | AliJ R, Thompson G M, Song X Y, et al. 2002. Emeishan Basalts (SW China) and the 'end-Guadalupian’ crisis: magnetobiostratigraphic constraints. Journal of the Geological Society, 159(1): 21-29, doi: 10.1144/0016-764901086. |
| [2] | Ali J R, Thompson G M, Zhou M F, et al. 2005. Emeishan large igneous province, SW China. Lithos, 79(3-4): 475-489, doi: 10.1016/j.lithos.2004.09.013. |
| [3] | Bond D P G, Hilton J, Wignall P B, et al. 2010a. The Middle Permian (Capitanian) mass extinction on land and in the oceans. Earth-Science Reviews, 102(1-2): 100-116. |
| [4] | Bond D P G, Wignall P B, Wang W, et al. 2010b. The mid-Capitanian (Middle Permian) mass extinction and carbon isotope record of South China. Palaeogeography, Palaeoclimatology, Palaeoecology, 292(1-2): 282-294. |
| [5] | Borradaile G J. 1988. Magnetic susceptibility, petrofabrics and strain. Tectonophysics, 156(1-2): 1-20. |
| [6] | Bowring S A, Erwin D H, Jin Y G, et al. 1998. U/Pb zircon geochronology and tempo of the End-Permian mass extinction. Science, 280 (5366): 1039-1045. |
| [7] | Burgess S D, Bowring S, Shen S Z. 2014. High-precision timeline for Earth's most severe extinction. Proceedings of the National Academy of Sciences of the United States of America, 111(9): 3316-3321. |
| [8] | Chen Z Q, George A D, Yang W R. 2009. Effects of Middle-Late Permian sea-level changes and mass extinction on the formation of the Tieqiao skeletal mound in the Laibin area, South China. Australian Journal of Earth Sciences, 56(6): 745-763. |
| [9] | Clark M A. 2012. Magnetostratigraphy susceptibility correlations for the Guadalupian-Lopingian boundary and the placement of the North American Ochoan series: Texas (USA) and South China. Baton Rouge, LA: Louisiana State University. |
| [10] | Crick R E, Ellwood B B, El Hassani A, et al. 1997. Magnetosusceptibility event and cyclostratigraphy (MSEC) of the Eifelian-Givetian GSSP and associated boundary sequences in North Africa and Europe. Episodes, 20(3): 167-175. |
| [11] | Dettinger M D, Ghil M, Strong C M, et al. 1995. Software expedites singular-spectrum analysis of noisy time series. EOS Transactions American Geophysical Union, 76(2): 12-21. |
| [12] | Dunlop D J, Özdemir Ö. 1997. Rock Magnetism: Fundamentals and Frontiers. Cambridge: Cambridge University Press. |
| [13] | Ellwood B B, Hrouda F, Wagner J J. 1988. Symposia on magnetic fabrics: introductory comments. Physics of the Earth and Planetary Interiors, 51(4): 249-252. |
| [14] | Ellwood B B, Crick R E, El Hassani A. 1999. The magneto-susceptibility event and cyclostratigraphy (MSEC) method used in geological correlation of Devonian rocks from Anti-Atlas Morocco. AAPG Bulletin, 83(7): 1119-1134. |
| [15] | Ellwood B B, Crick R E, El Hassani A, et al. 2000. Magnetosusceptibility event and cyclostratigraphy method applied to marine rocks: detrital input versus carbonate productivity. Geology, 28(12): 1135-1138. |
| [16] | Ellwood B B, Brett C E, Macdonald W D. 2007. Magnetostratigraphy susceptibility of the Upper Ordovician Kope Formation, Northern Kentucky. Palaeogeography, Palaeoclimatology, Palaeoecology, 243(1-2): 42-54. |
| [17] | Ellwood B B, Tomkin J H, El Hassani A, et al. 2011. A climate-driven model and development of a floating point time scale for the entire Middle Devonian Givetian Stage: a test using magnetostratigraphy susceptibility as a climate proxy. Palaeogeography, Palaeoclimatology, Palaeoecology, 304(1-2): 85-95. |
| [18] | Ellwood B B, Lambert L L, Tomkin J H, et al. 2012. Magnetostratigraphy susceptibility for the Guadalupian series GSSPs (Middle Permian) in Guadalupe Mountains National Park and adjacent areas in West Texas.//Jovane L, Herrero-Bervera, E, Hinnov L A, et al., eds. Magnetic Methods and the Timing of Geological Processes. Geological Society, London: Special Publications, 373, doi: 10.1144/SP373.1. |
| [19] | García-Alcalde J L, Ellwood B B, Soto F, et al. 2011. Precise timing of the Upper Taghanic Biocrisis, Geneseo Bioevent, in the Middle—Upper Givetian (Middle Devonian) boundary in Northern Spain using biostratigraphic and magnetic susceptibility data sets. Palaeogeography, Palaeoclimatology, Palaeoecology, 313-314: 26-40, doi: 10.1016/j.palaeo.2011.10.006. |
| [20] | Ghil M, Allen M R, Dettinger M D, et al. 2002. Advanced spectral methods for climatic time series. Reviews of Geophysics, 40(1): 3-1-3-41, doi: 10.1029/2001RG000092. |
| [21] | Gong Y M, Du Y S, Tong J N, et al. 2008. Cyclostratigraphy: the third milestone of stratigraphy in understanding time. Earth Science-Journal of China University of Geosciences (in Chinese), 33(4): 443-457. |
| [22] | Gradstein F M, Ogg J G, Smith A G. 2004. A Geologic Time Scale 2004. Cambridge: Cambridge University Press. |
| [23] | Gradstein F M, Ogg J G, Schmitz M, et al. 2012. The Geologic Time Scale. Boston: Elsevier. |
| [24] | Guo G, Tong J N, Zhang S H, et al. 2008. Cyclostratigraphy of the Induan (Early Triassic) in West Pingdingshan Section, Chaohu, Anhui Province. Science in China Series D: Earth Sciences, 51(1): 22-29. |
| [25] | Hays J D, Imbrie J, Shackleton N J. 1976. Variations in the Earth's orbit: pacemaker of the ice ages. Science, 194(4270): 1121-1132. |
| [26] | He B, Xu Y G, Chung S L, et al. 2003. Sedimentary evidence for a rapid, kilometer-scale crustal doming prior to the eruption of the Emeishan flood basalts. Earth and Planetary Science Letters, 213(3-4): 391-405. |
| [27] | He B, Xu Y G, Wang Y M, et al. 2006. Sedimentation and lithofacies paleogeography in southwestern China before and after the Emeishan flood volcanism: new insights into surface response to mantle plume activity. The Journal of Geology, 114(1): 117-132. |
| [28] | He B, Xu Y G, Huang X L, et al. 2007. Age and duration of the Emeishan flood volcanism, SW China: geochemistry and SHRIMP zircon U-Pb dating of silicic ignimbrites, post-volcanic Xuanwei Formation and clay tuff at the Chaotian section. Earth and Planetary Science Letters, 255(3-4): 306-323. |
| [29] | Henderson C M., Mei S L, Wardlaw B R. 2002. New conodont definitions at the Guadalupian-Lopingian boundary.//Hills L V, Henderson C M, Bamber E W Eds. Carboniferous and Permian of the World. Calgary: Canadian Society of Petroleum Geologists, Memoir 19, 725-735. |
| [30] | Huang C J, Tong J N, Hinnov L, et al. 2011. Did the great dying of life take 700 ky? evidence from global astronomical correlation of the Permian-Triassic boundary interval. Geology, 39(8): 779-782. |
| [31] | Huang C J. 2014. The current status of cyclostratigraphy and astrochronology in the Mesozoic. Earth Science Frontiers (in Chinese), 21(2): 48-66. |
| [32] | Jenkins G M, Watts D G. 1968. Spectral Analysis and Its Applications. San Francisco: Holden-Day. |
| [33] | Jiang H S, Luo G M, Lai X L. 2004. Summary of approaches for conodont separation. Geological Science and Technology Information (in Chinese), 23(4): 109-112. |
| [34] | Jin Y G, Henderson C M, Wardlaw B R, et al. 2001. Proposal for the Global Stratotype Section and Point (GSSP) for the Guadalupian-Lopingian boundary. Permophiles, 39(3): 32-42. |
| [35] | Jin Y G, Mei S L, Wang W, et al. 1998. On the Lopingian series of the Permian system. Palaeoworld, 9: 1-18. |
| [36] | Jin Y G, Shen S Z, Henderson C M, et al. 2006. The Global Stratotype Section and Point (GSSP) for the boundary between the Capitanian and Wuchiapingian Stage (Permian). Episodes, 29(4): 253-262. |
| [37] | Jovane L, Florindo F, Sprovieri M, et al. 2006. Astronomic calibration of the late Eocene/early Oligocene Massignano section (central Italy). Geochemistry, Geophysics, Geosystems, 7: Q07012, doi: 10.1029/2005GC001195. |
| [38] | Kasuya A, Isozaki Y, Igo H. 2012. Constraining paleo-latitude of a biogeographic boundary in Mid-Panthalassa: fusuline province shift on the Late Guadalupian(Permian) migrating seamount. Gondwana Research, 21(2-3): 611-623. |
| [39] | Li B, Xue W Q, Yan J X, et al. 2015. Magnetic properties of the Middle-Late Permian carbonates in South China and their environmental significances. Earth Science-Journal of China University of Geosciences (in Chinese), 40(7): 1226-1236. |
| [40] | Liu C Y, Zhu R X. 2009. Geodynamic significances of the Emeishan Basalts. Earth Science Frontiers, 16(2): 52-69. |
| [41] | Mei S L, Jin Y G, Wardlaw B R. 1998. Conodont succession of the Guadalupian-Lopingian boundary strata in Laibin of Guangxi, China and West Texas, USA. Palaeoworld, 9: 53-57. |
| [42] | Ogg J G, Ogg G, Gradstein F M. 2008. The Concise Geologic Time Scale. Cambridge: Cambridge University Press. |
| [43] | Qiu Z, Wang Q C, Zou C N, et al. 2014. Transgressive-regressive sequences on the slope of an isolated carbonate platform (Middle-Late Permian, Laibin, South China). Facies, 60(1): 327-345. |
| [44] | Sha Q A, Wu W S, Fu J M. 1990. An Integrated Investigation on the Permian System of Qin-Gui Areas, with Discussion on the Hydrocarbon Potential (in Chinese). Beijing: Science Press. |
| [45] | Shaw A B. 1964. Time in Stratigraphy. New York: McGraw-Hill. |
| [46] | Shen S Z, Wang Y, Henderson C M, et al. 2007. Biostratigraphy and lithofacies of the Permian System in the Laibin-Heshan area of Guangxi, South China. Palaeoworld, 16(1-3): 120-139. |
| [47] | Sun Y D, Lai X L, Wignall P B, et al. 2010. Dating the onset and nature of the Middle Permian Emeishan large igneous province eruptions in SW China using conodont biostratigraphy and its bearing on mantle plume uplift models. Lithos, 119(1-2): 20-33. |
| [48] | Wang Y, Jin Y G. 2000. Permian palaeogeographic evolution of the Jiangnan Basin, South China. Palaeogeography, Palaeoclimatology, Palaeoecology, 160(1-2): 35-44. |
| [49] | Weedon G P. 2003. Time-series Analysis and Cyclostratigraphy: examining Stratigraphic Records of Environmental Cycles. Cambridge: Cambridge University Press. |
| [50] | Wignall P B. 2001. Large igneous provinces and mass extinctions. Earth-Science Reviews, 53(1-2): 1-33. |
| [51] | Wignall P B, Sun Y D, Bond D P G, et al. 2009a. Volcanism, mass extinction, and carbon isotope fluctuations in the Middle Permian of China. Science, 324(5931): 1179-1182. |
| [52] | Wignall P B, Védrine S, Bond D P G, et al. 2009b. Facies analysis and sea-level change at the Guadalupian-Lopingian Global Stratotype (Laibin, South China), and its bearing on the end-Guadalupian mass extinction. Journal of the Geological Society, 166(4): 655-666. |
| [53] | Wignall P B, Bond D P G, Haas J, et al. 2012. Capitanian (Middle Permian) mass extinction and recovery in western Tethys: a fossil, facies, and δ13C study from Hungary and Hydra island (Greece). Palaios, 27(2): 78-89. |
| [54] | Wu H C, Zhang S H, Feng Q L, et al. 2011. Theoretical basis, research advancement and prospects of cyclostratigraphy. Earth Science-Journal of China University of Geosciences (in Chinese), 36(3): 409-428. |
| [55] | Wu H C, Zhang S H, Feng Q L, et al. 2012. Milankovitch and sub-Milankovitch cycles of the early Triassic Daye Formation, South China and their geochronological and paleoclimatic implications. Gondwana Research, 22(2): 748-759. |
| [56] | Wu H C, Zhang S H, Hinnov L A, et al. 2013a. Time-calibrated Milankovitch cycles for the late Permian. Nature Communications, 4: 2452, doi: 10.1038/ncomms3452. |
| [57] | Wu H C, Zhang S H, Jiang G Q, et al. 2013b. Astrochronology for the Early Cretaceous Jehol Biota in northeastern China. Palaeogeography, Palaeoclimatology, Palaeoecology, 385: 221-228, doi: 10.1016/j.palaeo.2013.05.017. |
| [58] | Wu H C, Zhang S H, Jiang G Q, et al. 2013c. Astrochronology of the Early Turonian-Early Campanian terrestrial succession in the Songliao Basin, northeastern China and its implication for long-period behavior of the Solar System. Palaeogeography, Palaeoclimatology, Palaeoecology, 385: 55-70, doi: 10.1016/j.palaeo.2012.09.004. |
| [59] | Yao Y, Yan J X, Li A Z. 2012. Sedimentary features and evolution of Mid-Permian carbonates from Laibin of Guangxi. Earth Science-Journal of China University of Geosciences (in Chinese), 37(S2): 184-194. |
| [60] | Zheng H R, Hu Z Q. 2010. Chinese pre-Mesozoic Tectonic: Atlas of Lithofacies and Paleogeography (in Chinese). Beijing: Geologic Publishing House. |
| [61] | Zhou M F, Malpas J, Song X Y, et al. 2002. A temporal link between the Emeishan large igneous province (SW China) and the end-Guadalupian mass extinction. Earth and Planetary Science Letters, 196(3-4): 113-122. |
| [62] | Ziegler A M, Hulver M L, Rowley D B. 1997. Permian world topography and climate.//Martini I P ed. Late Glacial and Postglacial Environmental Changes-Quaternary, Carboniferous-Permian, and Proterozoic. New York: Oxford University Press, 111-146. |
| [63] | 龚一鸣, 杜远生, 童金南等. 2008. 旋回地层学: 地层学解读时间的第三里程碑. 地球科学—中国地质大学学报, 33(4): 443-457. |
| [64] | 黄春菊. 2014. 旋回地层学和天文年代学及其在中生代的研究现状. 地学前缘, 21(2): 48-66. |
| [65] | 江海水, 罗根明, 赖旭龙. 2004. 牙形石的分离方法简介. 地质科技情报, 23(4): 109-112. |
| [66] | 李波,薛武强,颜佳新等. 2015. 华南中—晚二叠世之交碳酸盐岩磁学特征及环境意义. 地球科学—中国地质大学学报, 40(7): 1226-1236. |
| [67] | 沙庆安, 吴望始, 傅家谟. 1990. 黔桂地区二叠系综合研究—兼论含油气性. 北京: 科学出版社. |
| [68] | 吴怀春, 张世红, 冯庆来等. 2011. 旋回地层学理论基础, 研究进展和展望. 地球科学—中国地质大学学报, 36(3): 409-428. |
| [69] | 姚尧, 颜佳新, 李傲竹. 2012. 广西来宾中二叠世碳酸盐岩沉积特征与孤立台地演化. 地球科学—中国地质大学学报, 37(增刊2): 184-194. |
| [70] | 郑和荣, 胡宗全. 2010. 中国前中生代构造—岩相古地理图集. 北京: 地质出版社. |
 2015, Vol. 58


