2. 甘肃省地震局, 兰州 730000
2. Gansu Earthquake Administration, Lanzhou 730000, China
The GPAT employs polarities of the P-wave first-motion and the maximal amplitude with polarities. The phases used here are generalized, which are no longer limited to well-known P-waves, S-waves or surface waves. The maximal amplitudes can be adopted as long as they are clearly recorded in spite of the well-known phases. GPAT uses the correlation coefficient between observed data and synthetic data as the objective function, and sets a weight factor for the first-motion polarities and the maximal amplitudes. In this paper we select forty-nine earthquakes with epicenter distances from 5 km to 8000 km, with magnitudes from ML0.2 to MS7.0, including six far-field events in and surrounding China, twelve regional events in Lushan, Sichuan, eight local events in Yingjiang and twenty-three local events in Qiaojia, Yunnan.
The focal mechanisms of the far-field events determined with GPAT are highly consistent with those from GCMT(Global Centroid Moment Tensor). The focal mechanisms of the regional events determined with GPAT are consistent with those from other studies, and they appear to be similar to each other. For the local events in Yingjiang, the focal mechanism of the main shock is consistent with those from other studies and other events have the mechanisms fairly similar to the main shock. For the local events in Qiaojia, they all have similar strike-slip mechanisms. Moreover, the moment magnitudes from the GPAT are reliable,but the focal depths from the GPAT seem to be about 0.6 km deeper than the routinely determined depths on average.
The GPAT is proved to have a good performance in the inversion for focal mechanism,moment magnitude and focal depth.It is not only suitable for far-field data, but also for regional and local data. It is not only suitable for moderate-size events, but also for small and micro events.
对于远场地震而言,如果地震产生的位移已知,我们可以通过计算描述地震波传播路径效应的格林函数,借助于波形反演技术很容易得到其震源机制(Aki and Richards,1980; Lay and Wallace,1995). 这种波形反演技术最初适用于远场记录或较大的地震(Dziewonski et al.,1981),后经国内外同行的努力将其应用于区域地震记录或中等大小的地震(Helmberger and Engen,1980; Dreger and Helmberger,1991; Dreger and Helmberger,1993; Zhao and Helmberger,1994; Zhu and Helmberger,1996).但这种技术对于小震或微震的震源机制的求解仍无能为力.对于小震或微震的震源机制求解,P波初动符号和/或振幅信息是必不可少的资料,但究竟如何利用这些资料确定震源机制却一直没有被广泛采纳的方法(Kisslinger,1980; Snoke et al.,1984; Reasenberg and Oppenheimer,1985; Ebel and Bonjer,1990; Julian and Foulger,1996; Hardebeck and Shearer,2002,2003;许忠淮等,1983; 梁尚鸿等,1984;俞春泉等,2009).作为对已有研究工作的补充与发展,我们提出了一种反演技术——广义极性振幅技术(GPAT),并已经通过一系列数值实验检验了这种技术的可行性和抗干扰能力(严川和许力生,2014).
虽然广义极性振幅技术的提出主要是针对小震或微震震源机制的反演问题,但是它的设计原理不仅允许反演小震或微震的震源机制,也允许反演中强地震的震源机制;不仅允许使用地方和区域地震记录,也允许使用远场地震记录.为了检验这种技术的实用性,本文利用远场和区域地震记录反演了6次大震,利用区域和地方地震记录反演了2013年芦山主震(大震)及其较大余震(中小地震),利用地方记录反演了2014年盈江主震(大震)及其余震(小地震),还利用巧家台阵记录反演了23次地方震(小震或微震).
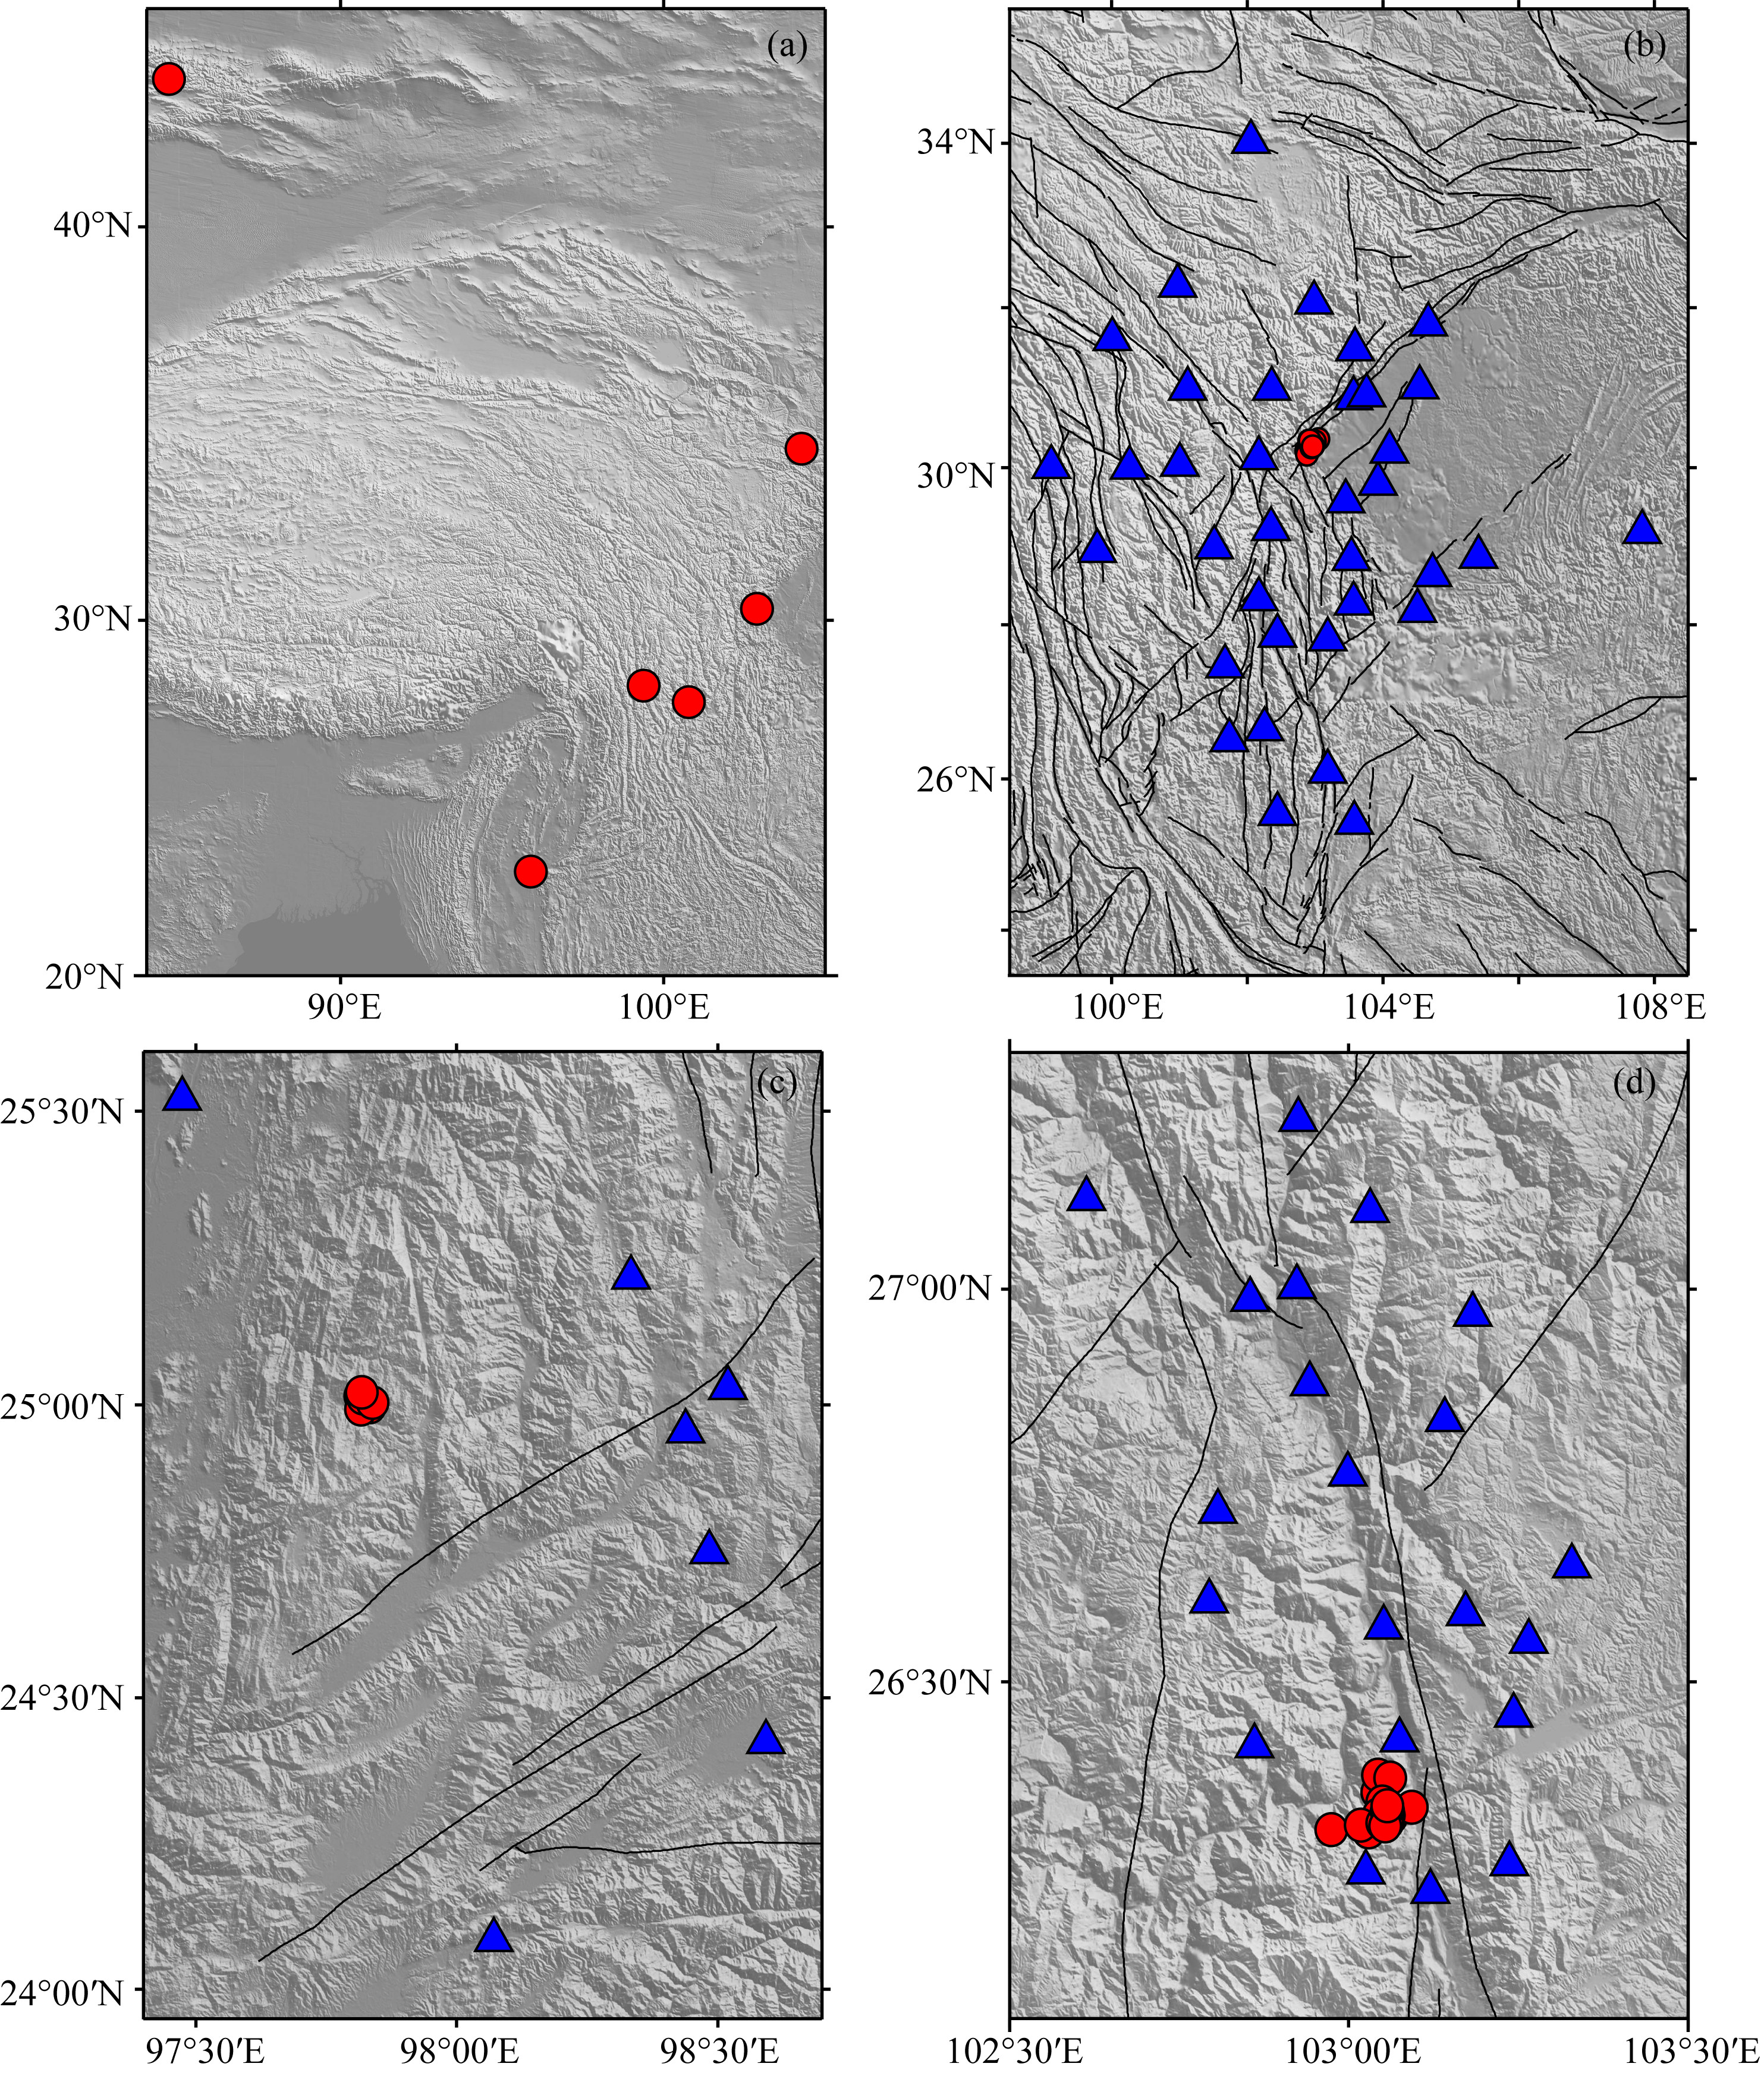
2 震例与数据筛选为了检验GPAT的实用性,我们选择的地震必须包括具有远场记录的大震、具有区域记录的中强震以及具有地方记录的小震或微震.同时需要考虑,所选地震的反演结果尽可能具有可比性.为此,挑选了近年来发生在我国大陆及周边的6次地震作为远震震例(表 1,图 1a),发生于2013年4月的芦山地震序列(芦山震群)12次地震作为区域地震震例(表 2,图 1b),发生于2014年5月的云南盈江地震序列(盈江震群)的8次地震(表 3,图 1c)以及巧家流动台阵记录到的一个地震序列(巧家震群)的23次地震作为地方震的震例(表 4,图 1d).其中表 3和表 4 中定位结果的不确定性意义已在前文(许力生等,2013a)作过介绍.远震的数据从IRIS(Incorporated Research Institutions for Seismology,美国地震学研究机构联合会)数据中心获取,反演结果可以与GCMT结果对比.芦山震群的数据从我国国家台网备份中心获取(郑秀芬等,2009;Zheng et al.,2010),部分反演结果可以和利用其他反演方法得到的结果对比(吕坚等,2013;赵博等,2013),也可以在群内地震之间进行对比.盈江震群的数据从云南地震台网数据中心获取,部分反演结果可以和其他机构利用不同反演技术得到的结果对比,同时也可以在群内地震之间进行对比.巧家震群的数据从我们布设的巧家流动地震台阵获取,反演结果只能在震群内部地震之间进行对比. 注意,在这里我们不得不借助于一个并不严谨的假设,即一个震群内部的主要事件应该具有类似的震源机制.
| | 表 1 远震事件的震源参数 Table 1 Source parameters of the teleseismic events |
 |
图 1 震中与台站分布 (a) 6次大震; (b) 芦山震群; (c) 盈江震群; (d) 巧家震群. 红色圈为地震震中,蓝色三角形为台站,黑色线为断层. Fig. 1 Distribution of the epicenters and the stations (a) The 6 large events; (b) The Lushan swarm; (c) The Yingjiang swarm; (d) The Qiaojia swarm.The red circles are the epicenters,the blue triangles are the stations,and the black lines are the faults |
| | 表 2 芦山震群的震源参数 Table 2Source parameters of the Lushan earthquake swarm |
| | 表 3 盈江震群的震源参数Table 3Source parameters of the Yingjiang earthquake swarm |
| | 表 4 巧家震群的震源参数 Table 4 Source parameters of the Qiaojia earthquake swarm |
表 1和图 1a所示远震所使用数据的震中距分布在约500 km到8000 km之间(图 2a),覆盖了部分区域距离和远场距离.在采集反演信息前,我们首先将原始记录进行采样,使其采样率降为2 sps(samples per second),然后对记录进行滤波以去除噪声的影响且保证感兴趣的震相特征不发生明显变化,所以对较小的事件(事件1、5、6),采用了0.05~0.2 Hz的滤波窗,而对较大的事件(事件2、3、4),采用了0.02~0.1 Hz的滤波窗.在进行震源机制反演时,我们采集了垂向记录的P波初动信息、直达P波最大振幅信息和直达S波 最大振幅信息.对于这些远场地震,均使用IASPEI91 全球速度模型,利用反射-折射率方法计算格林函数(Kennett,1983; Kennett and Engdahl,1991; Kennett et al.,1995).
 |
图 2地震记录的震中距覆盖范围 (a) 6次大震; (b) 芦山震群; (c) 盈江震群; (d) 巧家震群. Fig. 2 The epicentral distances of the used seismic recordings The 6 large events;(b) The Lushan swarm;(c) The Yingjiang swarm;(d) The Qiaojia swarm. |
表 2和图 1b所示的区域地震所使用数据的震中距分布在50 km至550 km之间(图 2b),覆盖了部分地方距离和区域距离.在采集反演信息前,首先将原始记录进行采样,使其采样率降为10 sps,然后对记录同样进行滤波以去除噪声的影响且保证感兴趣的 震相特征不发生明显变化,在这里采用了0.5~2 Hz 的滤波窗.在进行震源机制反演时,使用了垂向记录的P波初动信息、直达P波最大振幅信息和直达S波最大振幅信息.格林函数同样是根据IASPEI91全球速度模型,利用反射-折射率方法计算得到(Wang,1999).
表 3和图 1c所示的盈江震群所使用数据的震中距分布在约55 km至105 km之间(图 2c).考虑到地方震群的地震较小,波形记录的频率较高,所以资料的采样率和滤波频率须根据具体情况而定.设置滤波频率的原则是,消除背景噪声并保证波形主频不变.根据这组震群资料的实际情况,我们将这些事件的滤波范围设置为2~4 Hz;设置采样率的原则是,采样频率为滤波频率上限的5倍.类似地,计算格林函数时,仍然使用反射-折射率方法(Wang,1999),但是速度模型则是王椿镛等(2002)为川滇建 立的水平分层速度模型(表 5).这个模型是我们从已有的多个研究结果中挑选而来的(许力生等,2013b).
| | 表 5 根据王椿镛等(2002)建立的速度模型Table 5 Velocity model modified after Wang et al. (2002) |
表 4和图 1d所示的巧家震群所使用数据的震中距分布在约5 km至100 km之间(图 2d).巧家震群的震级更小,波形记录的频率更高.所以我们仍然采用处理盈江震群数据的技术流程,不同的地震采用不同的采样率和频率窗.同样,采用王椿镛等(2002)为川滇建立的水平分层速度模型和反射-折射率方法(Wang,1999)计算格林函数.
4 GPAT震源机制 4.1 远震表 6和图 3a展示了利用广义极性振幅技术反演的6次远震的震源机制结果(GPAT)和全球矩心矩张量结果(GCMT).仅从图 3a中的沙滩球几乎无法辨识GPAT结果与GCMT结果的差异.如果仔细比较对应参数,两种结果之间还是存在或多或少的差别.我们注意到,只有一次事件的节面I的走向相差29°,其余都在15°以内;只有一次事件的节面II的走向相差29°,其余都在10°以内;所有节面I的倾角差异都在16°以内;所有节面II的倾角差异都在10°以内;只有两次事件的节面I的滑动角相差17°,其余差别都在7°以内;只有两次事件的节面II的滑动角相差24°和22°,其余都在16°以内.虽然GCMT结果是目前国际上的权威结果,但仍不能被认为是“真理”.假如我们把GPAT结果和GCMT结果的中间值作为真理的更好近似,那么GPAT结果的偏差就更小.由此看来,GPAT利用远场资料和区域资料反演远场大震的震源机制是可行的.
| | 表 6 远震事件的GPAT与GCMT震源机制 Table 6GPAT and GCMT mechanisms of the teleseismic events |
 |
图 3 GPAT震源机制结果与其他研究结果的比较 (a) 6次大震的GPAT结果(红色)与GCMT结果(黑色),其中上方的数字为事件的编号; (b) 芦山震群的GPAT结果(红色)与赵博等(2013)的结果(紫色)以及吕坚等(2013)的结果(黑色); (c) 盈江震群的GPAT结果(红色)与其他机构对19号事件的结果(黑色)以及其他机构对20号事件的结果(紫色); (d) 巧家震群的GPAT结果(红色). Fig. 3 Comparison of the GPAT mechanisms with the other-source ones (a) The GPAT results (red) and the GCMT ones (black) of the 6 large events,where the numbers are the event codes; (b) The GPAT results (red) and the Zhao et al. (2013)′s ones (purple) as well as Lü et al. (2013)′s ones (black) of the Lushan swarm; (c) The GPAT results (red) and the results of the 19th event from other organizations (black) as well as the results of the 20th event from other organizations (purple) of the Yingjiang swarm; (d) The GPAT results (red) of the Qiaojia swarm. |
表 7和图 3b展示了芦山震群的震源机制反演结果和部分来自其他研究的结果(具体参数见附表 1和2).通过对比发现GPAT反演结果与来自其他研究的结果之间的相似性(吕坚等,2013;赵博等,2013).同时,我们注意到震群内各事件的震源机制也彼此接近.考虑到来自其他研究的结果远不及GCMT结果那样权威,我们并没有仔细计算具体参数之间的差别.
| | 表 7 芦山震群的GPAT震源机制 Table 7GPAT mechanisms of the Lushan earthquake swarm |
需要特别说明的是,我们不但利用远场记录反演了芦山主震的震源机制,还分别利用区域记录和地方记录反演了这次地震的震源机制.表 6中事件4的GPAT结果为远场资料的反演结果,表 7中的结果7和7*分别为使用区域资料和地方资料的反演结果.对于节面I而言,三种结果的走向分别为21°、22°和358°,最大差别24°;三种结果的倾角分别为56°、34°和58°,最大差别为24°;三种结果的滑动角分别为64°、86°和58°,最大差别为28°.对于节面II而言,三种结果的走向分别为242°、207°和228°,最大差别35°;三种结果的倾角分别为42°,56°和44°,最大差别为14°;三种结果的滑动角分别为123°、93°和130°,最大差别为37°.我们对同一地震使用了不同的资料,尽管反演结果之间存在差别,但三种不同资料的反演结果仍具有一致性.
综合以上分析,我们认为GAPT利用区域地震记录能够反演得到中强地震的震源机制.
4.3 地方震 4.3.1 盈江震群表 8和图 3c展示了盈江震群的震源机制参数,其中包括发生于2014年5月23日和5月30日的两次主震事件.从反演结果看,尽管这些地震的震源机制不尽相同,但它们皆以陡倾角走滑为主.
| | 表 8 盈江震群的GPAT震源机制 Table 8 GPAT mechanisms of the Yingjiang earthquake swarm |
对于盈江震群中的余震事件,我们无法为所有事件找到像GCMT那样的权威结果作比较,但从已有的研究中找到其中部分事件的震源机制(图 1c和附表 3、4).尽管他们使用的方法和资料与我们使用的方法和资料截然不同,但这些事件的震源机制彼此接近.另外,我们已经利用事件21至26成功提取了两次主震的震源时间函数(许力生等,2014),该结果表明余震和主震的震源机制的确很相似.
4.3.2 巧家震群表 9和图 3d展示了巧家震群的震源机制结果.清楚地可以看到,尽管这些地震的震源机制彼此存在差异,但它们都以走滑为主.我们无法为这些地震找到可以比照的结果,但这些事件震源机制间的相似性为求解结果的准确提供了保障.对于事件的时空分布而言,这些事件在时间上比较集中,大部分发生于2013年11月16日至23日之间,但是在空间上它们并不呈线性排列.对于事件的震级大小而言,这个震群的地震都比较小,最大的4.6级,最小的仅为0.2级,这样小的地震完全可以在局部应力场作用下发生,因此过高地渴求震源机制的一致性显然是不合理的.
| | 表 9 巧家震群的GPAT震源机制Table 9GPAT mechanisms of the Qiaojia earthquake swarm |
综合考虑盈江震群与巧家震群的反演,我们完全有理由认可GPAT利用地方地震记录反演小微地震震源机制的实用性.
需要说明的是,表 7、8和9中反演参数误差(不确定性)的意义已在前文作过介绍(严川和许力生,2014).
5 GPAT矩震级矩震级的概念诞生于对大地震的研究,是由标量地震矩的大小决定的(Kanamori,1977;Hanks and Kanamori,1979).地方震级的概念诞生于对小地震的研究,是由某个特定周期的振幅的大小决定的(陈运泰和刘瑞丰,2004).由于二者的定义不同,二者之间存在差别便不难理解.不同震级之间的关系一直以来都是一个重要的研究方向,矩震级与地方震级的关系是其中重要的组成部分(Bakun and Lindh,1977; Bakun,1984; Fletcher et al.,1984; Hanks and Boore,1984; Kim et al.,1989; Vidal and Mungúia,1991; Ben-Zion and Rice,1993; Ben-Zion and Zhu,2002; Clinton et al.,2006; Tan and Helmberger,2007).目前的研究表明,两者之间呈现分段关系,对于较大地震,二者比较一致,地震越小,二者差别越大.
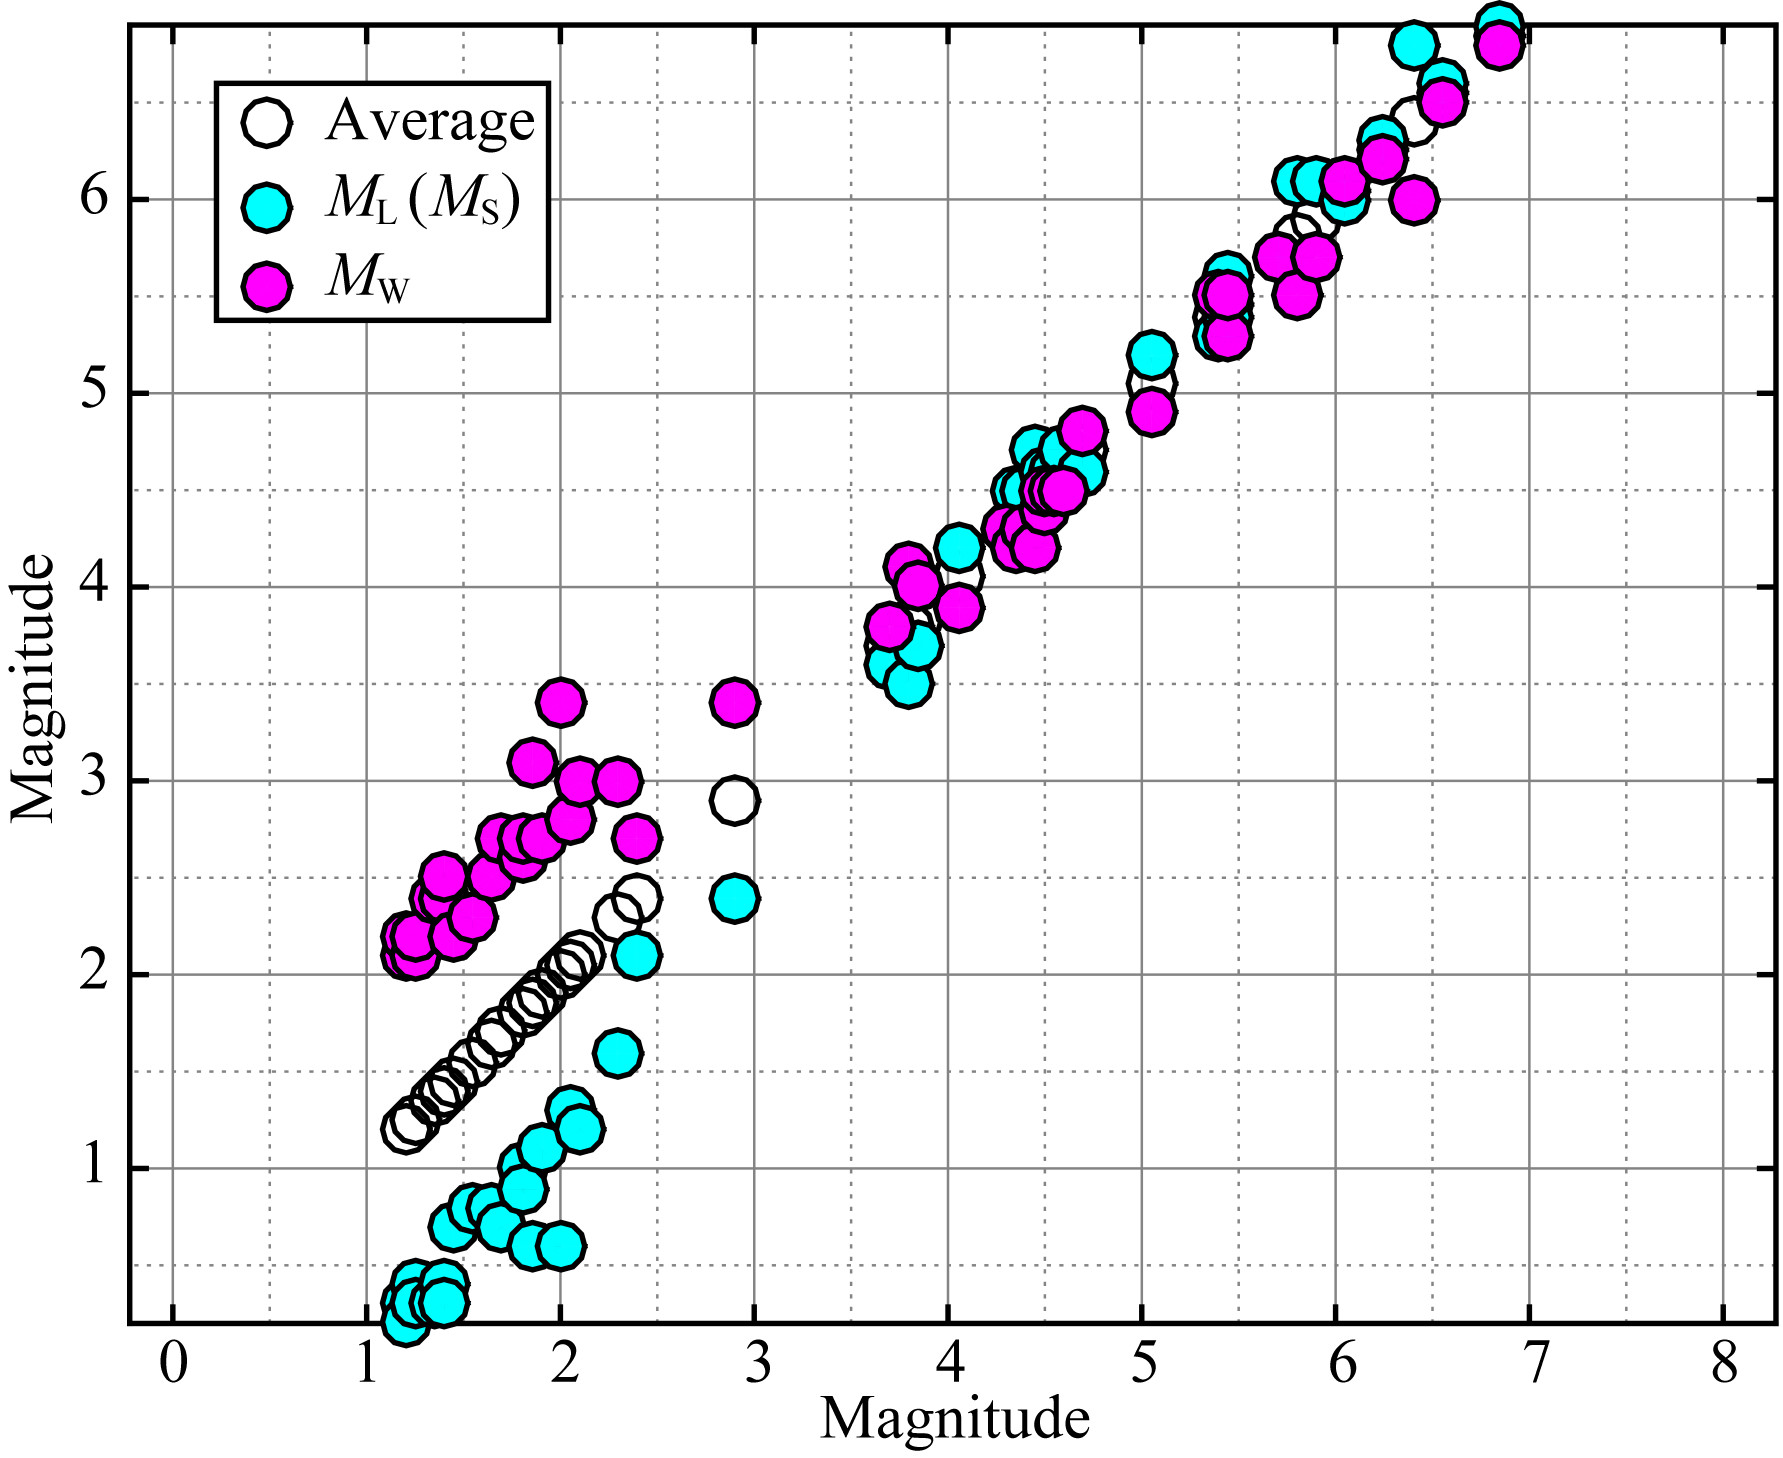
单独比较某个或某几个地震的矩震级和地方震级是无意义的,在这里我们把本文中涉及的所有地震事件的矩震级和常规定位时确定的地方震级(注意:部分较大事件实际上是面波震级)进行对比分析.在图 4中,把同一事件的两种不同震级的平均值 作为“真值”(假定为正确的震级),并依此真值从小到大的顺序对震级进行排列.可以看出,矩震级与地方震级总体上具有相同的趋势特征,但是,大于约3.5时,矩震级与地方震级一致性更好(注:没有找到那6次远震的ML震级),二者几乎重合,而小于约3.5时,矩震级与地方震级明显分裂开来,且震级越小分裂越明显,在地方震级为0时,二者的差异可达到2级.这种分段特征无疑是对已有研究结果的强力支持.
 |
图 4 矩震级MW与地方震级ML 或者MS的比较 纵轴和横轴均为事件震级,其中蓝色圈为来自常规定位的地方震级; 红色圈为来自震源机制反演的矩震级; 空心圈为二者的平均值. Fig. 4 Comparison of the moment magnitudes MW with the local magnitudes ML or MS Horizontal and vertical axes both are for magnitudes of the events.The blue circles are from the routine locating and the red ones are from the mechanism inversion, and the empty ones,the average of the above two. |
考虑到其他研究结果,尽管GPAT矩震级与常规定位时得到的地方震级不总是一致,但我们仍然有理由相信GPAT矩震级是可以信赖的.
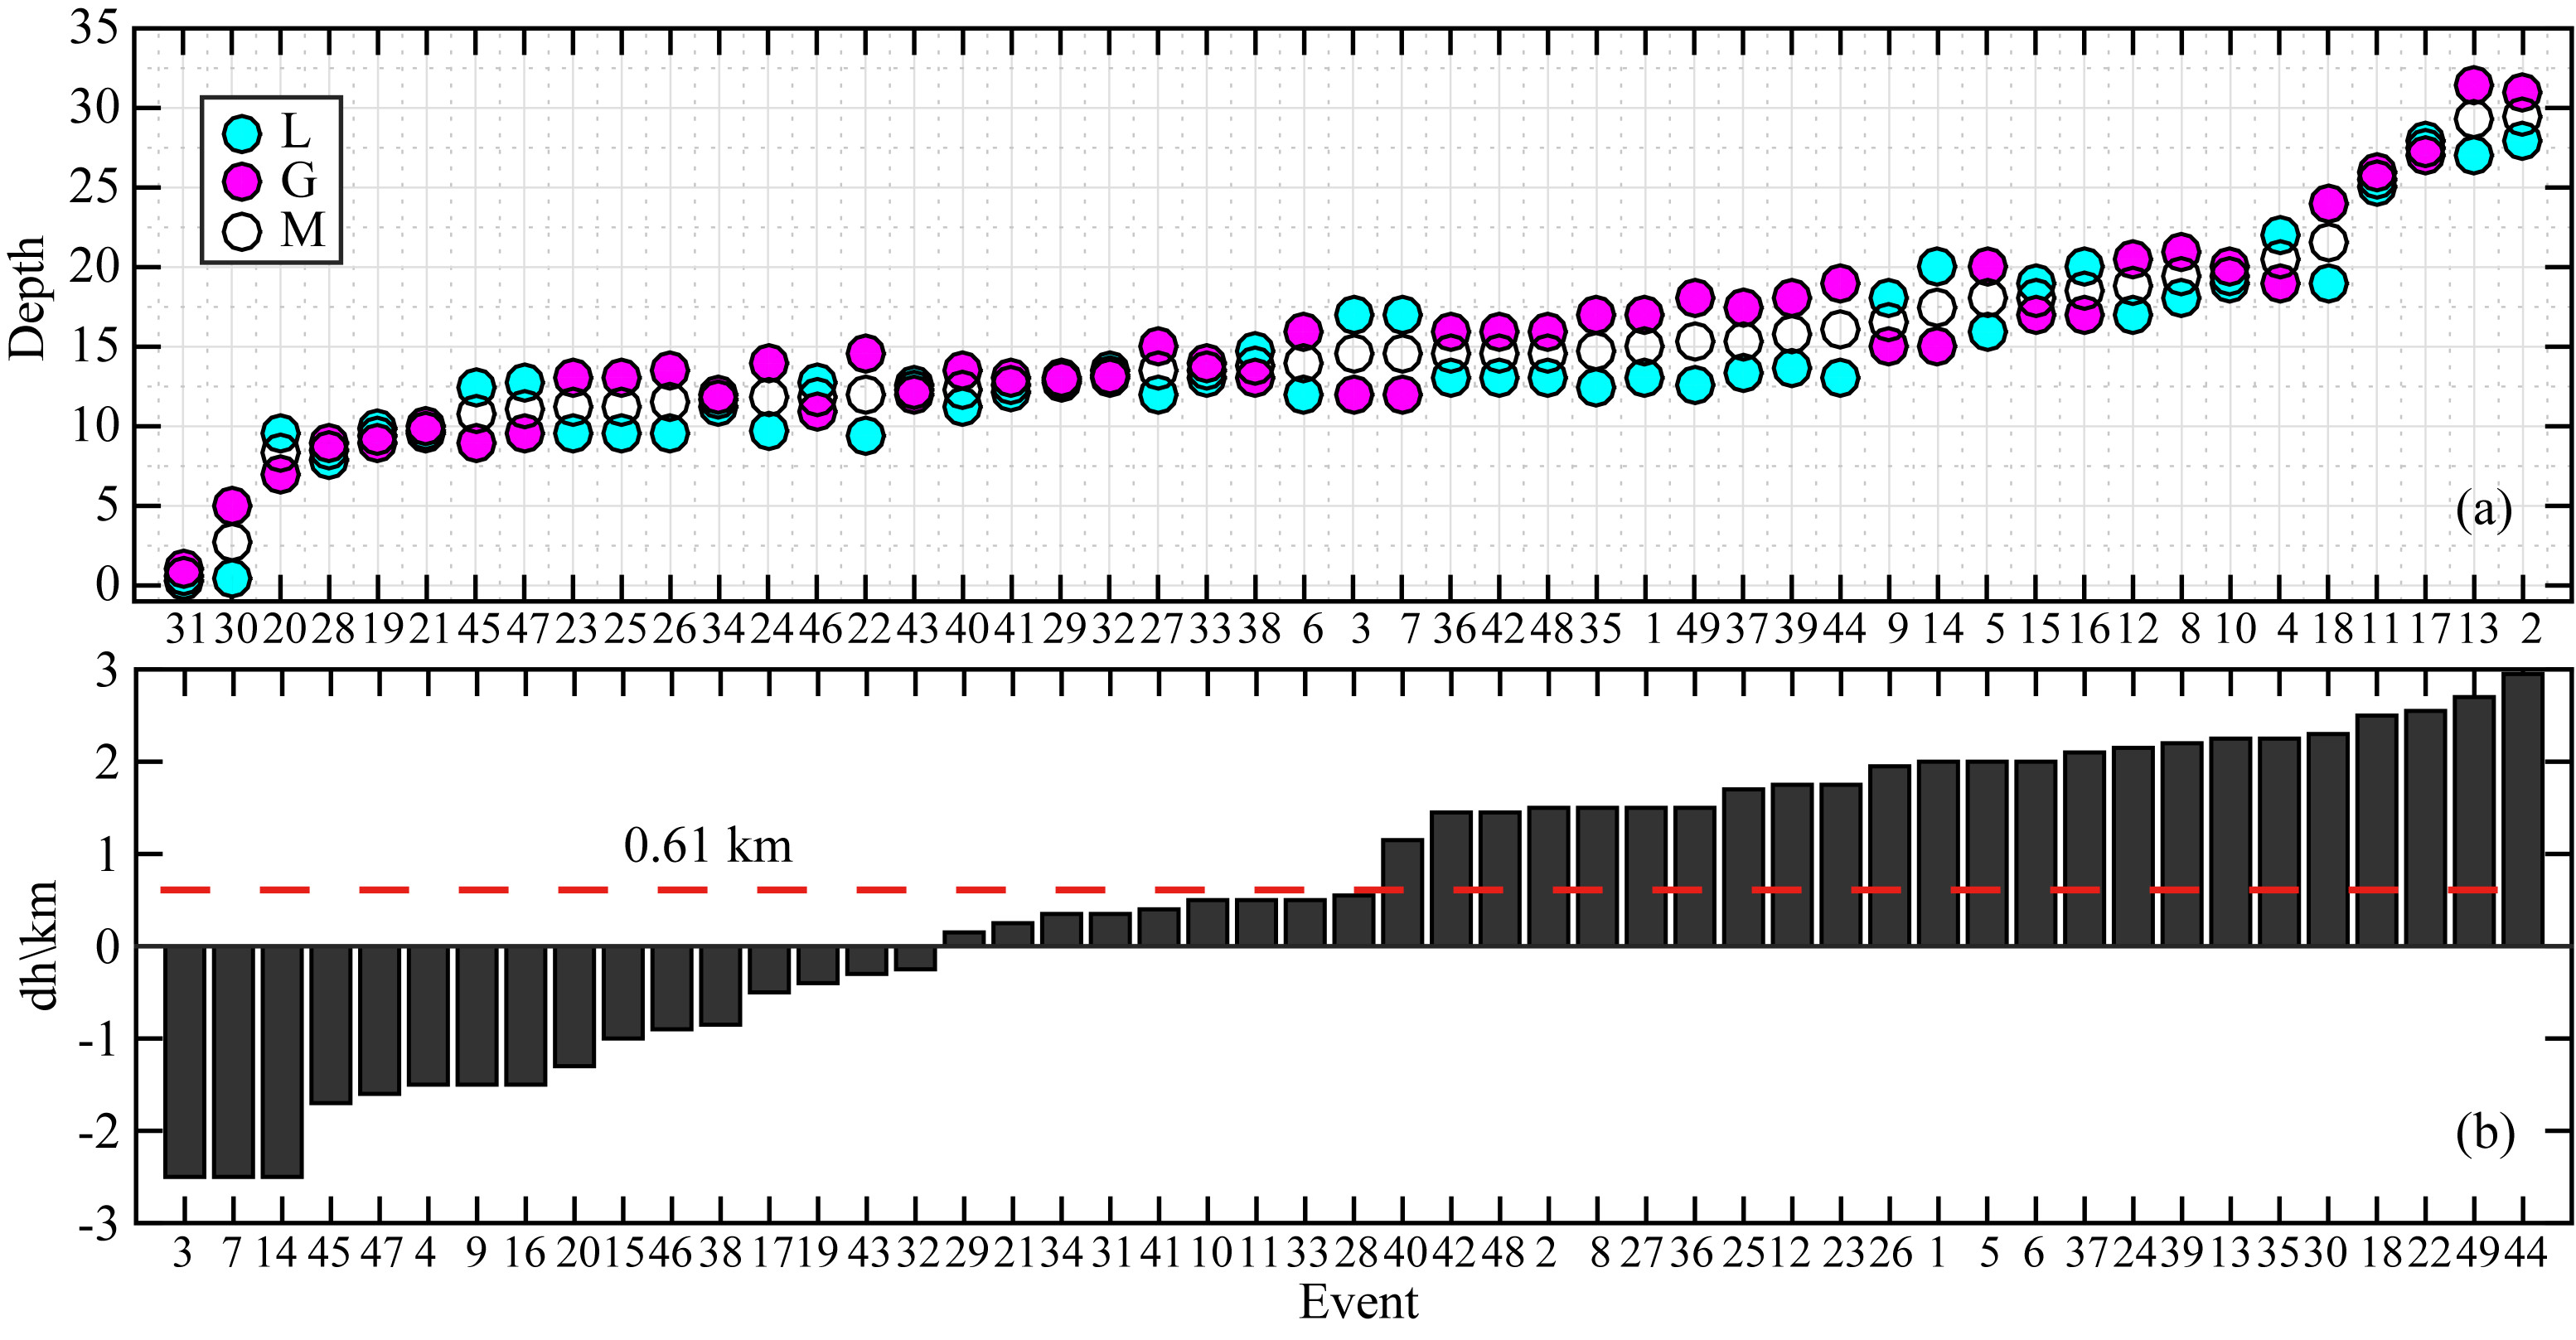
6 GPAT震源深度通过震源机制反演确定的震源深度(G深度)是否正确,用某个事件或者某几个事件同样难以得出结论.类似地,我们把所有事件的G深度与通过常规定位得到的震源深度(L深度)进行整体的比较.如图 5a,我们把同一事件的两种震源深度的平均值作为“真值”(假定为正确的震源深度),并依此真值从小到大的顺序排列.可以看出,G深度和L深度的相关性非常好,而且对于相当数量的事件,二者几乎是重合的.这说明G深度是一个具有实际意义的可用参数.为了做出定量评价,我们计算了G深度相对于真值的偏差(图 5b),最小偏差为0.15 km,最大偏差为2.95 km,平均偏差为0.61 km,其中偏差小于2 km者占约67%.而0.61 km的系统差别很可能来自起始破裂点与“矩心”之间的差别.
 |
图 5 震源深度的比较 (a)中M表示两种深度的均值. 在(a)图中蓝色圈为常规定位时得到的震源深度,红色圈为震源机制反演时得到的震源深度,空心圈为二者的平均值.在(b)图中纵坐标为GPAT深度与平均值之差,红色虚线为差的平均值.横坐标均为事件代码. Fig. 5 Comparison of the focal depths In subplot (a) the blue circles are from the routine location,the red circles,from the mechanism inversion,and the empty ones,the average of the above two;in subplot (b) the vertical axis shows the differences between the GAPT depths and the average ones,and the red dashed line shows the average value of the differences. The horizontal axes are the event codes. |
由此可见,GPAT深度与常规定位的深度具有相当好的一致性,GPAT深度能够反映震源的深度.
7 讨论与结论关于GPAT的原理和技术流程,我们已经做过系统的介绍(严川和许力生,2014);我们还利用各种数值实验阐述了GPAT的可行性和抗干扰能力(严川和许力生,2014).GPAT是为利用区域和地方地震记录反演小微地震的震源机制而提出的,但其原理允许利用所有地震记录反演所有地震的震源机制.在这项研究中,我们不但选择了利用区域和地方地震记录反演中、小、微地震的震源机制的震例,也选择了利用远场和区域地震记录反演大地震的震源机制的震例.这不单是为了说明,GPAT不仅适合于小微地震,也适合于中强地震,不仅适用于地方和区域地震记录,也适用于远场记录;更重要的是,对于中强地震,可以找到用其他方法和其他资料得到的震源机制便于和GPAT结果进行比较,而对于小微地震,难以找到强有力的佐证.
利用区域和远震记录反演大震的震源机制时,我们选择了6个MS5.7~MS7.0之间的地震.所用记录的震中距从500 km至8000 km,覆盖了部分区域到远场的距离.所用的地震的震源机制有正断层、逆断层、走滑断层以及其他类型的断层,覆盖几乎所有可能的机制.通过GPAT结果和GCMT结果的对比发现,二者基本一致,这说明GPAT能够利用区域记录和远场记录确定大震的震源机制.
利用地方和区域地震记录反演中强地震的震源机制时,我们选择了ML4.5~MS6.9之间的地震.所用记录的震中距从50 km至550 km,覆盖了部分区域距离和部分地方距离.所用的地震为2013年四川芦山地震序列的主震和较大余震(芦山震群),这些地震的震源机制以逆冲为主.经验表明,一个地震序列的较大余震与主震具有类似的震源机制(尽管并非总如此),而这个地震序列的主震和部分较大余震的震源机制已经有一些结果(吕坚等,2013;赵博等,2013).GPAT反演结果表明,芦山震群的震源机制都非常接近.无论是震群内部事件之间震源机制的相似性,还是部分事件的震源机制与其他研究结果的相似性均可表明,GPAT反演结果在合理的误差范围内是正确的.这说明GPAT能够利用区域和地方记录确定中强地震的震源机制.
利用地方地震记录反演小微地震的震源机制时,我们选择了ML0.2~MS6.1之间的地震.所用记录的震中距从5 km至105 km,覆盖了几乎整个地方距离.所用的地震一部分来自2014年云南盈江地震序列的主震和较大余震(盈江震群),另一部分来自2013年发生在云南巧家的一个地震序列(巧家震群).GPAT反演结果表明,盈江震群的事件都具有走滑机制.在震群内部事件之间的震源机制都彼此接近,主震的GPAT结果和其他机构给出的结果也较为一致(图 7).同样,巧家震群的事件也具有走滑机制.对于盈江震群和巧家震群,我们无法找到像GCMT那样令人信服的结果可以比对,但震群内部事件之间的相似性在相当程度上能够使我们相信,GPAT能够利用地方地震记录确定小微地震的震源机制.
GPAT不但反演确定震源机制,同时还反演确定矩震级和震源深度.从某一事件的反演结果,我们无从判断其正误.但所有事件的矩震级与地方震级的对比以及GPAT震源深度与常规定位深度的对比分析表明,GPAT反演得到矩震级和震源深度是可以信赖的.
由此可见,GPAT对实际地震是可用的,它能够在合理的误差范围内反演确定地震事件的震源机制、震源深度和矩震级;它不但适合于小微地震,还适合于中强地震;它不但适用于地方和区域地震记录,也适用于远场地震记录.
致谢 感谢IRIS数据中心提供远震波形数据,感谢云南省地震局提供盈江地震序列波形数据,也感谢国家地震台网中心提供芦山地震序列波形数据.
| | 附表 1 赵博等(2013)确定的芦山震群部分地震震源机制 Appendix Table 1 Focal mechanisms of some of the Lushan swarm from Zhao et al. (2013) |
| | 附表 2 吕坚等(2013)确定的芦山震群部分地震震源机制 Appendix Table 2Focal mechanisms of some of the Lushan swarm from Lü et al. (2013) |
| | 附表 3 19号地震的其他震源机制结果Appendix Table 3 Focal mechanisms of some of the Lushan swarm from Lü et al. (2013) |
| | 附表 4 20号地震的其他震源机制 Appendix Table 4 Focal mechanisms of the No.20 earthquake |
| [1] | Aki K, Richards P G. 1980. Quantitative Seismology Theory and Methods, Vol. I. W. H. San Francisco, California: Freeman and Company.Bakun W H, Lindh A G. 1977. Local magnitudes, seismic moments, and coda durations for earthquakes near Oroville, California. Bull. Seism. Soc. Am., 67(3): 615-629. |
| [2] | Bakun W H. 1984. Seismic moments, local magnitudes, and coda-duration magnitudes for earthquakes in central California. Bull. Seism. Soc. Am.74(2): 439-458. |
| [3] | Ben-Zion Y, Rice J R. 1993. Earthquake failure sequences along a cellular fault zone in a three-dimensional elastic solid containing asperity and nonasperity regions. J. Geophys. Res.98(B8): 14109-14131. |
| [4] |
Ben-Zion Y, Zhu L P. 2002. Potency-magnitude scaling relations for southern California earthquakes with 1. 0 |
| [5] | Chen Y T, Liu R F. 2004. Earthquake magnitude. Seismological and Geomagnetic Observation and Research (in Chinese), 25(6): 1-12. |
| [6] | Clinton J F, Hauksson E, Solanki K. 2006. An evaluation of the SCSN moment tensor solutions: Robustness of the Mw magnitude scale, style of faulting, and automation of the method. Bull. Seism. Soc. Am.96(5): 1689-1705. |
| [7] | Dreger D, Helmberger D. 1991. Source parameters of the Sierra Madre earthquake from regional and local body waves. Geophys. Res. Lett.18(11): 2015-2018. |
| [8] | Dreger D S, Helmberger D V. 1993. Determination of source parameters at regional distances with three-component sparse network data. J. Geophys. Res.98(B5): 8107-8125. |
| [9] | Dziewonski A M, Chou T A, Woodhouse J H. 1981. Determination of earthquake source parameters from waveform data for studies of global and regional seismicity. J. Geophys. Res.86(B4): 2825-2852. |
| [10] | Ebel J E, Bonjer K P. 1990. Moment tensor inversion of small earthquakes in southwestern Germany for the fault plane solution. Geophys. J. Int.101(1): 133-146. |
| [11] | Fletcher J, Boatwright J, Haar L, et al. 1984. Source parameters for aftershocks of the Oroville, California, earthquake. Bull. Seism. Soc. Am.74(4): 1101-1123. |
| [12] | Hanks T C, Kanamori H. 1979. A moment magnitude scale. J. Geophys. Res.84(B5): 2348-2350. |
| [13] | Hanks T C, Boore D M. 1984. Moment-magnitude relations in theory and practice. J. Geophys. Res.89(B7): 6229-6235. |
| [14] | Hardebeck J L, Shearer P M. 2002. A new method for determining first-motion focal mechanisms. Bull. Seism. Soc. Am.92(6): 2264-2276. |
| [15] | Hardebeck J L, Shearer P M. 2003. Using S/P amplitude ratios to constrain the focal mechanisms of small earthquakes. Bull. Seism. Soc. Am.93(6): 2434-2444. |
| [16] | Helmberger D V, Engen G R. 1980. Modeling the long-period body waves from shallow earthquakes at regional ranges. Bull. Seism. Soc. Am.70(5): 1699-1714. |
| [17] | Julian B R, Foulger G R. 1996. Earthquake mechanisms from linear-programming inversion of seismic-wave amplitude ratios. , Bull. Seism. Soc. Am.86(4): 972-980. |
| [18] | Kanamori H. 1977. The energy release in great earthquakes. J. Geophys. Res.82(20): 2981-2987. |
| [19] | Kennett B L N. 1983. Seismic Wave Propagation in Stratified Media. Cambridge: Cambridge University Press. |
| [20] | Kennett B L N, Engdahl E R. 1991. Traveltimes for global earthquake location and phase identification. Geophys. J. Int.105(2): 429-465. |
| [21] | Kennett B L N, Engdahl E R, Buland R. 1995. Constraints on seismic velocities in the earth from traveltimes. Geophys. J. Int.122(1): 108-124. |
| [22] | Kim W Y, Wahlström R, Uski M. 1989. Regional spectral scaling relations of source parameters for earthquakes in the Baltic Shield. Tectonophysics, 166(1-3): 151-161. |
| [23] | Kisslinger C. 1980. Evaluation of S to P amplitude rations for determining focal mechanisms from regional network observations. Bull. Seism. Soc. Am.70(4): 999-1014. |
| [24] | Lay T, Wallace T C. 1995. Modern Global Seismology. New York: Academic Press. |
| [25] | Liang S H, Li Y M, Shu P Y, et al. 1984. On the determining of source parameters of small earthquakes by using amplitude ratios of P and S from regional network observations. Chinese J. Geophys. (Acta Geophysica Sinica) (in Chinese), 27(3): 249-257. |
| [26] | Lü J, Wang X S, Su J R, et al. 2013. Hypocentral location and source mechanism of the MS7.0 Lushan earthquake sequence. Chinese J. Geophys. (in Chinese), 56(5): 1753-1763, doi: 10.6038/cjg20130533. |
| [27] | Reasenberg P A, Oppenheimer D H. 1985. FPFIT, FPPLOT and FPPAGE: Fortran computer programs for calculating and displaying earthquake fault plane solutions. U. S. Geological Survey Open-File Report 85-739, 109. |
| [28] | Snoke J A, Munsey J W, Teague A G, et al. 1984. A program for focal mechanism determination by combined use of polarity and SV-P amplitude ratio data. Journal of Earthquake Notes, 55(3): 15. |
| [29] | Tan Y, Helmberger D V. 2007. A new method for determining small earthquake source parameters using short-period P waves. Bull. Seism. Soc. Am.97(4): 1176-1195. |
| [30] | Vidal A, Mungúia L. 1991. Local magnitude and source parameters for earthquakes in the Peninsular Ranges of Baja California, Mexico. Bull. Seism. Soc. Am., 81(6): 2254-2267. |
| [31] | Wang C Y, Mooney W D, Wang X L, et al. 2002. Study on 3-D velocity structure of crust and upper mantle in Sichuan-Yunnan region, China. Acta Seismologica Sinica (in Chinese), 24(1): 1-16. |
| [32] | Wang R J. 1999. A simple orthonormalization method for stable and efficient computation of Green's functions. Bull. Seism. Soc. Am.89(3): 733-741. |
| [33] | Xu L S, Du H L, Yan C, et al. 2013a. A method for determination of earthquake hypocentroid: Time-reversal imaging technique I-Principle and numerical tests. Chinese J. Geophys. (in Chinese), 56(4): 1190-1206, doi: 10.6038/cjg20130414. |
| [34] | Xu L S, Yan C, Zhang X, et al. 2013b. A method for determination of earthquake hypocentroid: Time-reversal imaging technique—An examination based on people-made earthquake. Chinese J. Geophys. (in Chinese), 56(12): 4009-4027, doi: 10.6038/cjg20131207. |
| [35] | Xu L S, Yan C, Zhang X, et al. 2014. Rupture histories of the 2014 Yingjiang double earthquakes. Chinese J. Geophys. (in Chinese), 57(10): 3270-3284, doi: 10.6038/cjg20141015. |
| [36] | Xu Z H, Yan M, Zhao Z H. 1983. Evaluation of the direction of tectonic stress in north China from recorded data of a large number of small earthquakes. Acta Seismologica Sinica (in Chinese), 5(3): 268-279. |
| [37] | Yan C, Xu L S. 2014. An inversion technique for the mechanisms of local and regional earthquakes: generalized polarity and amplitude technique (I)—Principle and numerical tests. Chinese J. Geophys. (in Chinese), 57(8): 2555-2572, doi: 10.6038/cjg20140816. |
| [38] | Yu C Q, Tao K, Cui X F, et al. 2009. P-wave first-motion focal mechanism solutions and their quality evaluation. Chinese J. Geophys. (in Chinese), 52(5): 1402-1411, doi: 10.3969/j.issn.0001-5733.2009.05.030. |
| [39] | Zhao B, Gao Y, Huang Z B, et al. 2013. Double difference relocation, focal mechanism and stress inversion of Lushan MS7.0 earthquake sequence. Chinese J. Geophys. (in Chinese), 56(10): 3385-3395, doi: 10.6038/cjg20131014. |
| [40] | Zhao L S, Helmberger D V. 1994. Source estimation from broadband regional seismograms. Bull. Seism. Soc. Am.84(1): 91-104. |
| [41] | Zheng X F, Ouyang B, Zhang D N, et al. 2009. Technical system construction of Data Backup Centre for China Seismograph Network and the data support to researches on the Wenchuan earthquake. Chinese J. Geophys. (in Chinese), 52(5): 1412-1417, doi: 10.3969/j.issn.0001-5733.2009.05.031. |
| [42] | Zheng X F, Yao Z X, Liang J H, et al. 2010. The role played and opportunities provided by IGP DMC of China National Seismic Network in Wenchuan earthquake disaster relief and researches. Bull. Seism. Soc. Am.100(5B): 2866-2872. |
| [43] | Zhu L P, Helmberger D V. 1996. Advancement in source estimation techniques using broadband regional seismograms. Bull.Seism.Soc.Am.86(5): 1634-1641. |
| [44] | 陈运泰, 刘瑞丰. 2004. 地震的震级. 地震地磁观测与研究, 25(6): 1-12. |
| [45] | 梁尚鸿, 李幼铭, 束沛镒等. 1984. 利用区域地震台网P、S振幅比资料测定小震震源参数. 地球物理学报, 27(3): 249-257. |
| [46] | 吕坚, 王晓山, 苏金蓉等. 2013. 芦山7.0级地震序列的震源位置与震源机制解特征. 地球物理学报, 56(5): 1753-1763, doi: 10.6038/cjg20130533. |
| [47] | 王椿镛, Mooney W D, 王溪莉等. 2002. 川滇地区地壳上地幔三维速度结构研究. 地震学报, 24(1): 1-16. |
| [48] | 许力生, 杜海林, 严川等. 2013a. 一种确定震源中心的方法: 逆时成像技术(一)——原理与数值实验. 地球物理学报, 56(4): 1190-1206, doi: 10.6038/cjg20130414. |
| [49] | 许力生, 严川, 张旭等. 2013b. 一种确定震源中心的方法: 逆时成像技术(二)——基于人工地震的检验. 地球物理学报, 56(12): 4009-4027, doi: 10.6038/cjg20131207. |
| [50] | 许力生, 严川, 张旭等. 2014. 2014年盈江双震的破裂历史. 地球物理学报, 57(10): 3270-3284, doi: 10.6038/cjg20141015. |
| [51] | 许忠淮, 阎明, 赵仲和. 1983. 由多个小地震推断的华北地区构造应力场的方向. 地震学报, 5(3): 268-279. |
| [52] | 严川, 许力生. 2014. 一种地方与区域地震震源机制反演技术: 广义极性振幅技术(一)——原理与数值实验. 地球物理学报, 57(8): 2555-2572, doi: 10.6038/cjg20140816. |
| [53] | 俞春泉, 陶开, 崔效锋等. 2009. 用格点尝试法求解P波初动震源机制解及解的质量评价. 地球物理学报, 52(5): 1402-1411, doi: 10.3969/j.issn.0001-5733.2009.05.030. |
| [54] | 赵博, 高原, 黄志斌等. 2013. 四川芦山MS7.0地震余震序列双差定位、震源机制及应力场反演. 地球物理学报, 56(10): 3385-3395, doi: 10.6038/cjg20131014. |
| [55] | 郑秀芬, 欧阳飚, 张东宁等. 2009. “国家数字测震台网数据备份中心”技术系统建设及其对汶川大地震研究的数据支撑. 地球物理学报, 52(5): 1412-1417, doi: 10.3969/j.issn.0001-5733.2009.05.031. |
 2015, Vol. 58


