 2015, Vol. 58


2. 中国科学院大学, 北京 100049
2. University of Chinese Academy of Sciences, Beijing 100049, China
Gravity wave perturbations are extracted from 0.5 h×1 km density profiles. The relative density perturbations are expressed by ρ'(z)=(ρ(z)-ρ0(z))/ρ0(z), where ρ(z) is the measured atmosphere density, and ρ0(z) is the background density which is calculated by fitting the logarithmic form of whole night mean density with 4 order polynomial. The background wind data are achieved by applying a linear polynomial fitting to the NCEP-GFS wind data between 20 to 48 km altitude. Using the data extracted from the complete density perturbations structure and the background wind data, we calculate the parameters of gravity waves observed on November 11, 2013 by the gravity wave dispersion equation.
The complete density perturbation structure shows an obvious phenomenon of mountain gravity wave activity. The wave phases at same altitude remain unchanged in the whole night. The perturbation structure shows that vertical wavelength is about 5.5 km but changes with altitude. A group of over-determined equations can be established by substituting the data extracted from the complete density perturbations structure and the background wind data into the gravity wave dispersion equation. And two groups of solutions are obtained by using the least squares method to solve these over-determined equations. The wind profiles in the direction of two sets of solutions have been analyzed. A critical layer (zero wind layer) which will prevent the upward propagation of mounting waves is found in the wind profile in the direction of 37.9°(or 217.9°). Finally, the gravity waves observed on November 11, 2013 propagate in the direction of 52.4° from the north to the west, with a horizontal wavelength of 5.5 km.
Compared with inertia waves, there is no downward-propagating or upward-propagating phase in the density perturbation structure. At the same altitude, the phase remains unchanged in the whole night. Such kind of gravity wave perturbation structures have been often observed in winter. Density data obtained by Rayleigh lidar and NCEP-GFS wind data at Beijing are used to analyze a mountain wave parameters observed on November 11, 2013. By analysis, we obtain terrain-generated gravity waves propagating in the direction of 52.4° from the north to the west,with a horizontal wavelength of 5.5 km and average vertical wavelength of 6.0 km.
地形重力波是由于空气流经山脉、丘陵等地形障碍时,受地形强迫发生垂直位移而产生的波动.地形重力波对平流层大气环流、热力学结构以及化学组分有重要的影响(Alexander et al.,2011a).目前国内外已经有很多利用卫星探测数据对平流层地形 重力波的研究工作.Alexander和Teitelbaum(2007)通过分析卫星探测数据,发现2003年9月10日在南极半岛上空有一列水平波长为300 km,垂直波长为20 km的西北向传播的地形重力波.Jiang和Wu(2001)利用UARS(Upper Atmosphere Research Satellite)的MLS(Microwave Limb Sounder)数据研究了安第斯山脉的地形重力波,阐述了地形重力波与背景风场的相互作用,指出在由西风主导的背景风场下,地形重力波可以传播到50 km的高度.他们发现安第斯山脉处的地形重力波水平波长大多为110 km和400 km左右.气流流经澳大利亚和非 洲副热带地区的山脉形成的地形重力波波长和振幅较小,不易被卫星探测到.Eckermann和Wu(2012)通过改进算法提高信噪比得到了澳大利亚和非洲的副热带地区平流层地形重力波.目前,国内外尚没有利用瑞利激光雷达对地形重力波个例的研究.本文从地形重力 波色散关系出发,利用中国科学院空间科学与应用研究中心的瑞利激光雷达观测的数据以及美国国 家环境预报中心(National Centers For Environmental Prediction,NCEP)的全球预报系统(Global Forecast System,GFS)的风场数据,针对北京上空的地形重力波个例进行了研究,并分析计算了该重力波参数.
2 基本理论
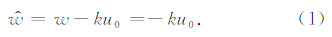
地形重力波由气流流经地形障碍(如丘陵,山脉等)而形成.地形重力波的振幅与导致其产生的地形障碍成比例.地形重力波相对于地面是静止的.地形重力波的水平固有相速度为  ,其中u0指的是与地形相垂直的背景风的分量;波的水平传播方向与水平风速方向相反,如果风速随高度变化,那波速也会随高度变化.
地形波的固有频率为:
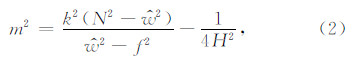
根据Fritts和Alexander(2003)的理论推导,重力波的色散关系为:
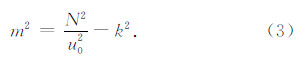
在 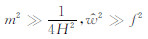 的情况下,色散关系可以简化为:
当u0=0时,m→∞,此时,垂直波速为零.我们将背景风速为零的区域称作临界层,在临界层,地形重力波将被吸收或者反射.
当  时,m为虚数,重力波将发生耗散.
中国科学院空间科学与应用研究中心(简称空间中心)于2011年建立瑞利激光雷达,以探测30~70 km高度范围内大气的温度和密度.该瑞利激光雷达的参数如表 1.
| | 表 1 空间中心瑞利激光雷达参数 Table 1 Parameters of Rayleigh lidar in National Space Science Center, CAS |
激光光束垂直进入大气,在30 km以上的高度(一般认为不存在气溶胶粒子),后向散射光主要来自于大气分子的瑞利散射,因此后向散射光子数正比于大气的密度.大气的相对密度值可以由光子信 号直接得到.以30 km高度上SABER卫星数据的大气密度为参考值,可得到大气的绝对密度(Wilson et al.,1991;Marsh et al.,1991).大气温度的反演在理想气体以及静力平衡的假设下,以最大观测高度上的SABER卫星温度数据为参考值,利用大气绝对密度得到大气的温度廓线.温度表达式为(Whiteway and Carswell,1995):
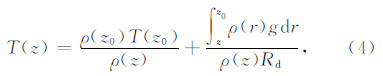
图 1为2013年11月11日观测的大气温度廓线,累积观测时长324 min,距离分辨率为1 km. 其中,细实线为2013年11月12日北京地区(40.98°N,114.10°E)的卫星温度数据.
 | 图 1 2013年11月11日瑞利激光雷达观测的大气温度以及SABER温度数据Fig. 1 Atmospheric temperature measured by Rayleigh lidar and SABER temperature on November 11, 2013 |
空间中心的瑞利激光雷达自建立开始,已有49个夜晚的观测数据,其中,最短观测时长为2 h,最长连续观测时长为11 h,累积观测时长300多个小时.
重力波波动通过瑞利雷达的密度数据来计算.密度扰动的表达式为: 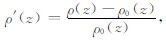 其中ρ(z)为观测到的大气密度,ρ0(z)为背景密度(Hertzog et al.,2001; Li et al.,2010; Sivakumar et al.,2006).在背景密度的计算中,考虑到密度随高度指数递减,因而首先对整晚的平均密度廓线取自然对数再进行4次多项式拟合,进而得到无扰动的背景密度曲线(Gao et al.,1998).
以2013年11月11日的观测数据为例,研究北京上空平流层的重力波活动.2013年11月11日的连续观测时长为324 min,用于计算重力波扰动的密度数据分辨率为0.5 h×1 km.表 2给出了四个特征高度上半小时积分的大气密度测量误差.
| | 表 2 密度测量误差 Table 2 Uncertainty of the density measurement |
图 2为当晚的密度扰动图.
从图 2中可以看到明显的重力波波动,并且在50 km以下相同高度上的相位基本保持不变,这符合地形重力波的特征.该重力波在不同的高度上的垂直波长不同,这是由于风速随高度变化引起的.通过测量波峰与波峰之间以及波谷与波谷之间的距离可以得到不同高度上的垂直波长.表 3给出了测量得到的几个高度上的垂直波长.
 | 图 2 2013年11月11日半小时分辨率的相对密度扰动Fig. 2 Half-hour relative density perturbation on November 11, 2013 |
浮力频率 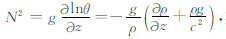 其中
其中  为声速,γ为定压热容与定容热容之比.根据浮力频率的计算公式,利用当晚的观测的温度和密度数据,可以计算得到浮力频率随高度变化廓线,如图 3所示.
 | 图 3 浮力频率Fig. 3 Buoyancy frequency |
背景风速会影响地形重力波的垂直波长,对重力波的传播起到关键作用(Eckermann,1995;Collins et al.,1996;陈操,2010).在分析计算地形重力波参数时,需要知道当天的背景风速.我们利用 NCEP GFS分析资料给出的北京地区(40°N,116°E)2013年11月11日的风速来计算背景风速.GFS分析资料在2013年11月11日有0时、6时、12时、18时(UT时)4个时刻的风场数据.由于我们的观测时间为16时到21时,因而采用18时的风场数据,在 20~48 km高度范围内做线性拟合,作为背景风速. 图 4和图 5分别为当天20~48 km高度范围内的风速拟合得到的纬向风和径向风结果.
 | 图 4 NCEP-GFS 风场数据与拟合的风场数据:纬向风Fig. 4 NCEP-GFS wind data and the fitted result:zonal wind |
 | 图 5 NCEP-GFS 风场数据与拟合的风场数据:径向风Fig. 5 NCEP-GFS wind data and the fitted result:meridional wind |
根据密度的扰动图,可以大致测出不同高度上的垂直波长.我们将不同高度上的各个参数汇总见表 3所示.
| | 表 3 不同高度上的测量参数 Table 3 Parameters at different heights |
将 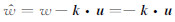 代入到色散关系式并考虑到
  可得:
可得:

在表中任选两个高度上的数据,并假设波的传 播方向角为θ(以正北的风向为0°),即可得到方程组:
解上述方程组可得到重力波的传播方向θ和水平波数k以及水平波长λ=2π/k.对于每两个不同高度上的数据,可以得到两组解.表 4给出了传播方向θ和水平波长λ的平均值、标准差以及方差.
我们还可以采用最小二乘法来求解上述超定方程.
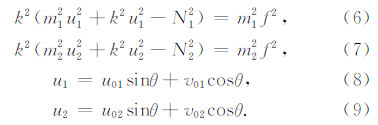
表 3中,任意高度上一组数据代入(5)式,并结合(8)、(9)式可以得到一个包含两个未知数(k,θ)的非线性方程.求解这样一个非线性方程组难度较大.为了方便计算,将任意两个高度上的数据代入(6)—(9)式,经化简后可得到一个只包含一个未知数(θ)的方程.由6个不同高度上的数据可以得到一个由15个方程组成的方程组.然后再根据最小二乘原理,求使得该方程组平方和最小的解θ.进而再求得另一个未知数(k)的解.最终得到了两组极小值解:

与表 4的结果相比较,用最小二乘法得到的结果在表 4给出结果的误差范围以内.两种方法得到的结果一致性较好.我们以最小二乘法得到的结果为准,对两组解进行分析.
| | 表 4 解的平均值、标准差和方差 Table 4 Mean value, standard deviation and variance of the solutions |
为了检验这两组解的正确性,下面分别给出在θ1、θ2方向上风速随高度的变化曲线.
由图 6可知,θ1方向上的风速在低空存在零风层(临界层),这将阻碍地形重力波向上传播,因此,观测到的地形重力波的传播方向不可能是θ1.而在θ2方向上,从地面到48 km高度范围内的风速都为正,这使地形波的向上传播到达上平流层成为可能,考虑到水平波数k的方向和水平风速方向相反,且θ2方向上风速方向为正,所以k的方向为θ2的反方向(即307.6°).因此,观测到的地形重力波的传播 方向为307.6°(即北偏西52.4°),水平波长为5.5 km.
 | 图 6 θ1和θ2方向上的风速Fig. 6 The wind profiles in θ1 and θ2 |
本文分析研究了一列由中国科学院空间科学与应用研究中心瑞利激光雷达观测到的北京上空的地形重力波,这是国内外首次由瑞利激光雷达观测到地形重力波的案例.在整晚的密度扰动结构图中可以看到明显的重力波波动.该波动在不同高度上具有不同的垂直波长,且相位在同一高度上保持不变.结合NCEP-GFS风场数据,我们分析计算出了地形重力波基本参数,如波长、传播方向等参数.证明2013年11月11日在北京上空存在一列传播方向为北偏西52.4°,水平波长为5.5 km,平均垂直波长约为6.0 km的地形重力波.
致谢 背景风场数据获取自美国国家环境预报中心(NCEP)的全球预报系统(GFS)网站.| [1] | Alexander M J, Teitelbaum H. 2007. Observation and analysis of a large amplitude mountain wave event over the Antarctic peninsula. J. Geophys. Res.,112(D21),doi: 10.1029/2006JD008368. |
| [2] | Alexander S P, Klekociuk A R, Pitts M C, et al. 2011a. The effect of orographic gravity waves on Antarctic polar stratospheric cloud occurrence and composition. Journal of Geophysical Research: Atmospheres, 116(D6): D06109. |
| [3] | Alexander S P, Klekociuk A R, Murphy D J. 2011b. Rayleigh lidar observations of gravity wave activity in the winter upper stratosphere and lower mesosphere above Davis, Antarctica (69°S, 78°E). J. Geophys. Res., 116(D13),doi: 10.1029/2010JD015164. |
| [4] | Chen C. 2010. The preliminary studies on the gravity waves of mid-atmosphere through Rayleigh lidar techniques (in Chinese). Wuhan: University of Science and Technology of China. |
| [5] | Collins R L, Tao X, Gardner C S. 1996. Gravity wave activity in the upper mesosphere over Urbana, Illinois: lidar observations and analysis of gravity wave propagation models. Journal of Atmospheric & Terrestrial Physics, 58(16): 1905-1926. |
| [6] | Eckermann S D. 1995. Effect of background winds on vertical wavenumber spectra of atmospheric gravity waves. J. Geophys. Res., 100(D7): 14097-14112. |
| [7] | Eckermann S D, Wu D L. 2012. Satellite detection of orographic gravity-wave activity in the winter subtropical stratosphere over Australia and Africa. Geophysical Research Letters,39(21),doi: 10.1029/2012GL053791. |
| [8] | Fritts D C, Alexander M J. 2003. Gravity wave dynamics and effects in the middle atmosphere. Reviews of Geophysics,41(1),doi: 10.1029/2001RG000106. |
| [9] | Gao X, Meriwether J W, Wickwar V B, et al. 1998. Rayleigh lidar measurements of the temporal frequency and vertical wavenumber spectra in the mesosphere over the Rocky Mountain region. J. Geophys. Res., 103(D6): 6405-6416. |
| [10] | Hertzog A, Souprayen C, Hauchecorne A. 2001. Measurements of gravity wave activity in the lower stratosphere by Doppler lidar. Journal of Geophysical Research: Atmospheres, 106(D8): 7879-7890. |
| [11] | Jiang J H, Wu D L. 2001. UARS MLS observations of gravity waves associated with the Arctic winter stratospheric vortex. Geophysical Research Letters, 28(3): 527-530. |
| [12] | Li T, Leblanc T, McDermid I S, et al. 2010. Seasonal and interannual variability of gravity wave activity revealed by long-term lidar observations over Mauna Loa Observatory, Hawaii. Journal of Geophysical Research: Atmospheres, 115(D13): D13103. |
| [13] | Marsh A K P, Mitchell N J, Thomas L. 1991. Lidar studies of stratospheric gravity-wave spectra. Planetary & Space Science, 39(11): 1541-1548. |
| [14] | Sivakumar V, Rao P B, Bencherif H. 2006. Lidar observations of middle atmospheric gravity wave activity over a low-latitude site (Gadanki, 13.5°N, 79.2°E). Annales Geophysicae, 24(3): 823-834. |
| [15] | Whiteway J A, Carswell A I. 1995. Lidar observations of gravity wave activity in the upper stratosphere over Toronto. Journal of Geophysical Research: Atmospheres, 100(D7): 14113-14124. |
| [16] | Wilson R, Chanin M L, Hauchecorne A. 1991. Gravity waves in the middle atmosphere observed by Rayleigh lidar 1. Case studies. J. Geophys. Res., 96(D3): 5153-5167. |
| [17] | 陈操. 2010. 中层大气重力波的瑞利激光雷达初步研究[硕士论文]. 武汉: 中国科学技术大学. |