In the magnetotail, on Oct 26 2002 the Cluster crosses southward the central current sheet in a distance of 19 RE to Earth. The current sheet flapping case associated by high speed ions flow was observed by Cluster on Oct 26 2002. This flapping case periodic is very good. The FFT analyses show the period of the current sheet flapping is about 2 min, the amplitude is about 20 nT. The velocity values changed periodically. The X component of ions velocity reaches 400 km·s-1. The Z component of ion velocity is up to 600 km·s-1. The energy range from 50~100 keV electrons and 10 keV ions flux is enhanced during the spacecrafts across current sheet center. When the spacecrafts move to the current sheet boundary, the energy of ions and electrons flux is decreasing. The current density is also flapping periodically. The velocity vector distribution show the particles motion is not a single direction. Base on the velocity and current vector analyses, the local particles motion is vortex motion.
This current sheet flapping is highly cyclical event and lasts for about 10 minutes. Through the particle and current density characters analyses, the high speed flows is local particles velocity. The present result indicated that the high speed ion flow is local particles motion, not come from far away magnetail. This result show the current sheet flapping may be induced by a self-circulation process not the BBF compressed the magnetosphere.
电流片是把磁尾南北尾瓣分开的很薄的区域,电流片的结构和其中发生的物理过程对于理解磁尾能量释放和粒子加速具有重要作用.自从1965年电流片首次被发现(Ness,1965)以来,科学家们对电流片的结构、形状以及与磁尾动力学过程的关系做了大量的研究.人们发现磁尾电流片经常在南北方向上运动,并将其称之为电流片拍动(Speiser and Ness,1967;Lui et al.,1978).电流片拍动伴随着磁场的振荡,极性的变化(即磁场Bx分量正负号的改变),以及等离子体的运动(Sergeev et al.,1998),电流片的拍动还常常伴随着地磁场扰动.1976年Toichi和Miyazaki发现电流片拍动出现在亚暴的初相,并认为磁尾电流片的拍动可能是由于行星际的阿尔芬波进入磁尾导致的.统计研究表明电流片的拍动和亚暴起始具有一定的相关性(Sergeev et al.,1998).但是Geotail(Sergeev et al.,2006)的观测显示地球磁场平静时期也观测到电流片拍动,所以电流片拍动和亚暴活动不是一一对应的关系,电流片的拍动期间还常常观测到快速离子流(Erkaev et al.,2008).
拍动电流片的结构是非常复杂和多变的.电流片的厚度接近离子回旋半径,大约是从400 km到一个RE(地球半径)(Runov et al.,2003a).近年来,人们利用欧空局Cluster四颗卫星多点探测数据对磁尾电流片拍动做了进一步深入研究,发现电流片拍动可能是磁尾大尺度的波动,周期从30 s到几分钟,幅度从几个nT到几十个nT(Zhang et al.,2005,Runov et al.,2003b,2005; Sergeev et al.,2003).电流片拍动的时间尺度可以从几分钟持续到几个小时(Duan et al.,2013).磁尾电流片的拍动波常常从磁尾等离子体片中心向晨昏两侧传播(Sergeev et al,2004),波的传播速度约为每秒几十公里.如果拍动过程中有高速流,传播速度可达到200 km·s-1. 目前磁层物理学家们已提出多种物理机制来解释电流片拍动现象,Sergeev等2006年的统计研究显示电流片拍动有可能是由等离子体片中地向离子高速流触发的.这些地向离子高速流是由磁尾重联产生,其速度远大于等离子体片等离子 体对流速度,持续时间约为20 min(Cao et al.,2006). 随后THEMIS卫星(Gabrieles et al.,2008)观测到一个拍动波与等离子体片爆发性整体流(bursty bulk flow: BBF)相关性很好的电流片拍动事例.在这个电流片拍动过程中,拍动与等离子体流的Vz分量密切相关.但后来观测中发现电流片拍动和地向高速粒子流有时也不是一一对应,即有时也不是同时观测到.Rong等(2011)的统计研究也显示电流片的拍动是磁尾大尺度的磁场内禀振荡,同时也认为粒子流的Z分量对电流片的拍动具有重要的作用.还有可能是行星际磁场的扰动或者增强的太阳风引起的电流片拍动(Shen et al.,2008).最近Wei等(2015)又发现电流片拍动可能是由电流片中非绝热离子触发的新机制. 本文采用Cluster磁场探测和等离子体探测数据,分析电流片的拍动特征(拍动的周期和持续的时间),以及等离子体高速流的特征,并讨论磁尾电流片拍动特征与高速流的关系.
本文所使用的磁场数据来自于Cluster卫星的磁强计FGM(Flux Gate Magnetometer)(Balogh et al.,2001),等离子体流场数据来自于CIS(Cluster Ion Spectrometry Experiment)(Rème et al.,2001),电子数据来自于PEACE(Plasma Electron and Current Experiment),能量粒子数据来自于RAPID(Imaging Particle Spectrometer).本文所采用的坐标系是GSE(地心太阳黄道系)坐标系.
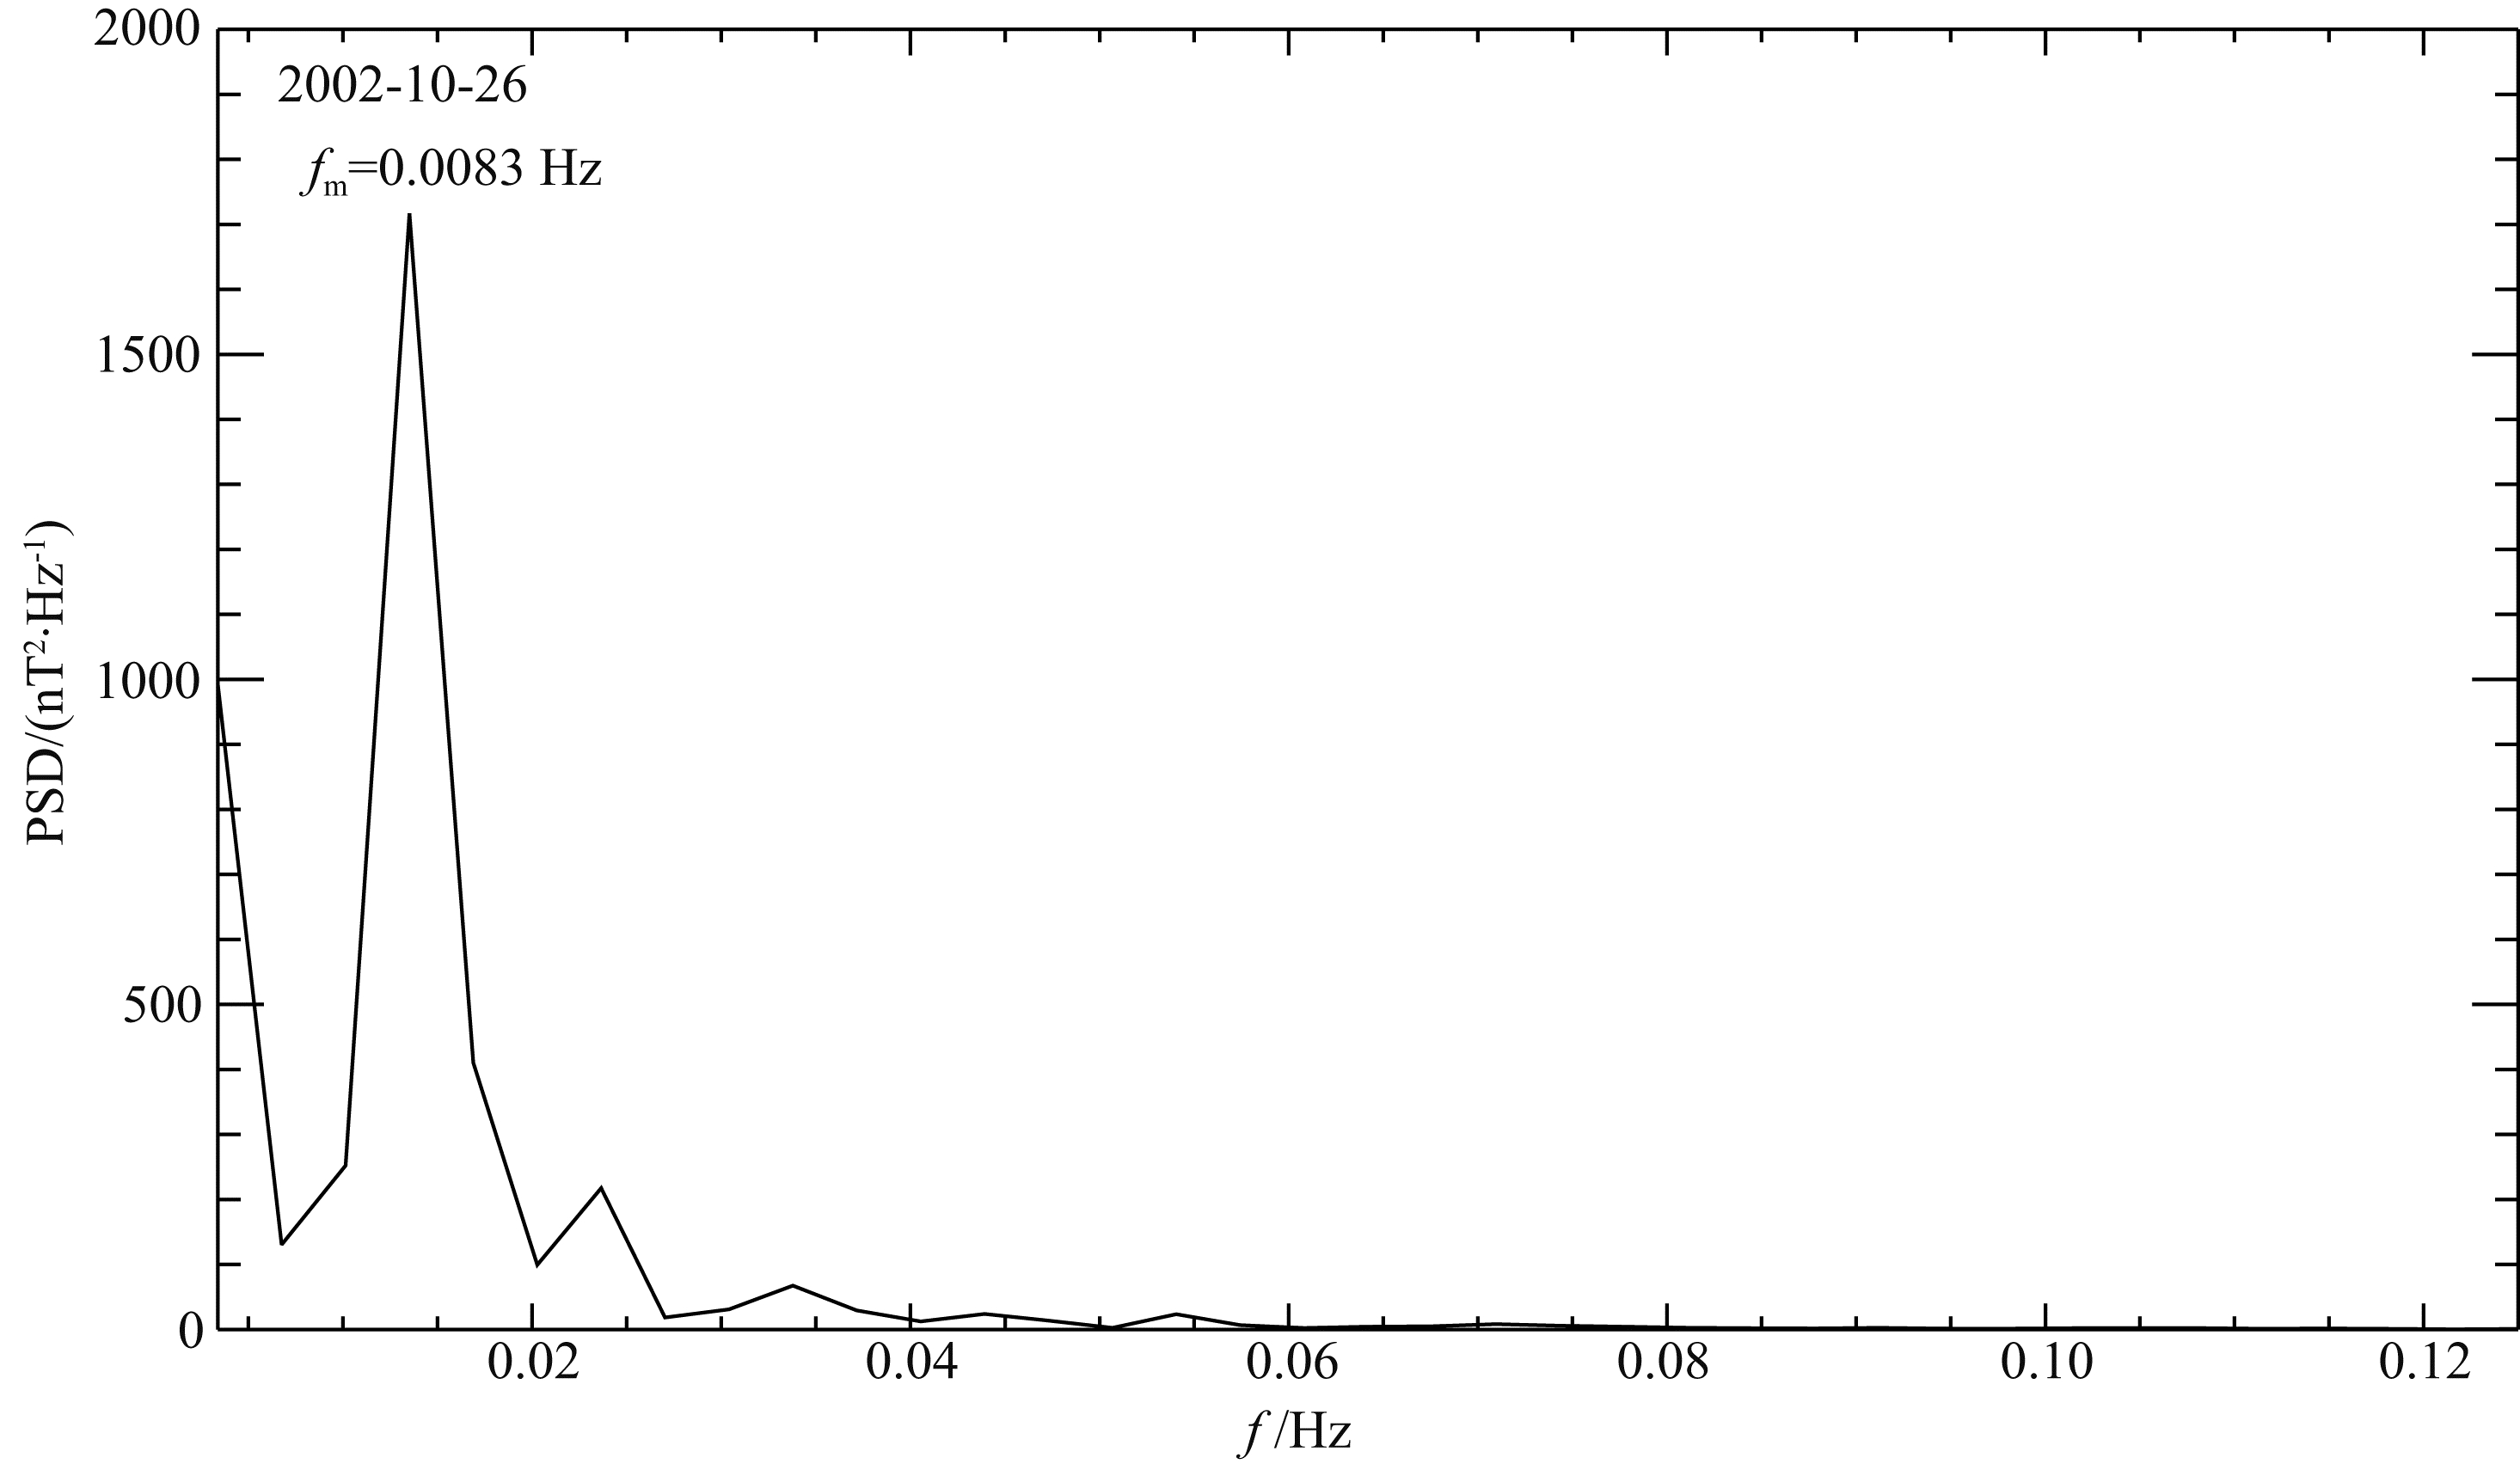
2 电流片拍动事件分析 2.1 2002年10月26日拍动事件基本特征2002年10月26日09 ∶ 15—09 ∶ 30UT期间,Cluster卫星多次穿越电流片.图 1给出了09 ∶ 15—09 ∶ 30UT期间Cluster卫星探测到的磁场和等离子体数据.在图 1中,从上到下分别是总磁场B,磁场分量Bx,By,Bz,等离子体流速分量Vx,Vy,Vz,等离子体密度n,等离子体β值.其中黑色,红色,绿色,蓝色线分别代表C1,C2,C3和C4探测到的数 据.在这期间Cluster大致处于(11.3,11.4,0.52)RE位置.图 1i显示卫星观测到的β值几乎都大于0.1.所以Cluster卫星在此期间基本上处于等离子体片中.从图 1a中可以看出在09 ∶ 24—09 ∶ 30UT期间C1和C2的总磁场呈现出周期性波动,波动的幅度超过了20 nT,周期大约为2 min.C3和C4在09 ∶ 20—09 ∶ 30UT也观测到总磁场波动.C3和C4观测到的有规律的总磁场波动出现的时间一致,但是C1看到的总磁场波动明显滞后,几乎是在C3和C4看到的总磁场波动结束后才观测到.图 1b给出了Cluster观测到的磁场X分量,C1,C2,C3和C4的磁场X分量的振荡非常强烈,并且多次极性相反,拍动的幅度达到20 nT,这个分量的振荡特征与总磁场的振荡特征一致,说明振荡主要是在磁场的X方向上.图 1c给出了磁场Y值,磁场Y分量也同样有规律地波动,波动周期与X分量几乎相同.磁场的X和Y分量波动的相位刚好差半个周期.图 1d给出了磁场Z值,磁场Z值的波动幅度不及磁场X、Y分量,磁场Z分量的周期与X、Y分量一致,相位差了大约1/4.图 1e给出了等离子体流速X分量,从图中可以看出,在电流片拍动期间,存在着等离子体高速流,其速度X分量也呈现出类似的周期性变化,粒子流的最大速度可以达到400 km·s-1.电流片拍动期间,粒子流的Y分量周期性不明显(见图 1f),但是离子流速度Z分量大约和X分量大小相当,周期也和X分量的变化周期一致,但相位差了半个周期(见图 1g).图 1h给出了等离子体数密度,可以看出在观测到拍动之前,数密度都大于0.2 cm-3.图 1g给出了等离子体β值,在电流片拍动出现之前,β值都大于1.这些结果表明Cluster是处于等离子体片中.以上分析发现电流片是非常有规律地拍动,拍动周期约2 min.为了更好地看出拍动波的特征,图 2给出了C3磁场随频率变化的功率谱密度PSD(Power Spectrum Density),做傅立叶分析选取的时间段是09 ∶ 20—09 ∶ 35. 从图中可以看出功率谱最强的时候波的频率是0.0083 Hz,周期是120 s,和图 1中磁场拍动的周期一致.
 | 图 1 2002年10月26日09 ∶ 15—09 ∶ 30UT,Cluster观测到的随着时间变化的磁场和等离子体特征,黑色,红色,绿色和蓝色线分别代表C1,C2,C3和C4观测到的数据.从上到下分别是总磁场,磁场X分量,Y分量,Z分量,速度X,Y,Z分量,等离子 体密度及等离子体β值Fig. 1 Shows the magnetic field and plasma characteristics during the period of 09 ∶ 15—09 ∶ 30UT on 26 Oct 2002 observed by Cluster. Black, red, green and blue lines show the data observed by C1,C2,C3 and C4 respectively. From top to bottom penals show the X, Y and Z component of magnetic field, X, Y and Z component of plasma velocity, plasma density and plasma β |
 | 图 2 C3磁场的快速傅里叶变化Fig. 2 Shows the Fast Fourier transform of magnetic field data observed by C3 |
需要指出的是,在这次电流片拍动事件前,Cluster卫星观测到了一次磁场重联事件.从图 1中可以看出,在电流片拍动事件前的09 ∶ 18UT,Cluster观测到了很强的尾向离子流和南向磁场.这个事件在Eastwood等(Eastwood et al.,2010)的文章中分析过.本文就不详细讨论该重联事件.
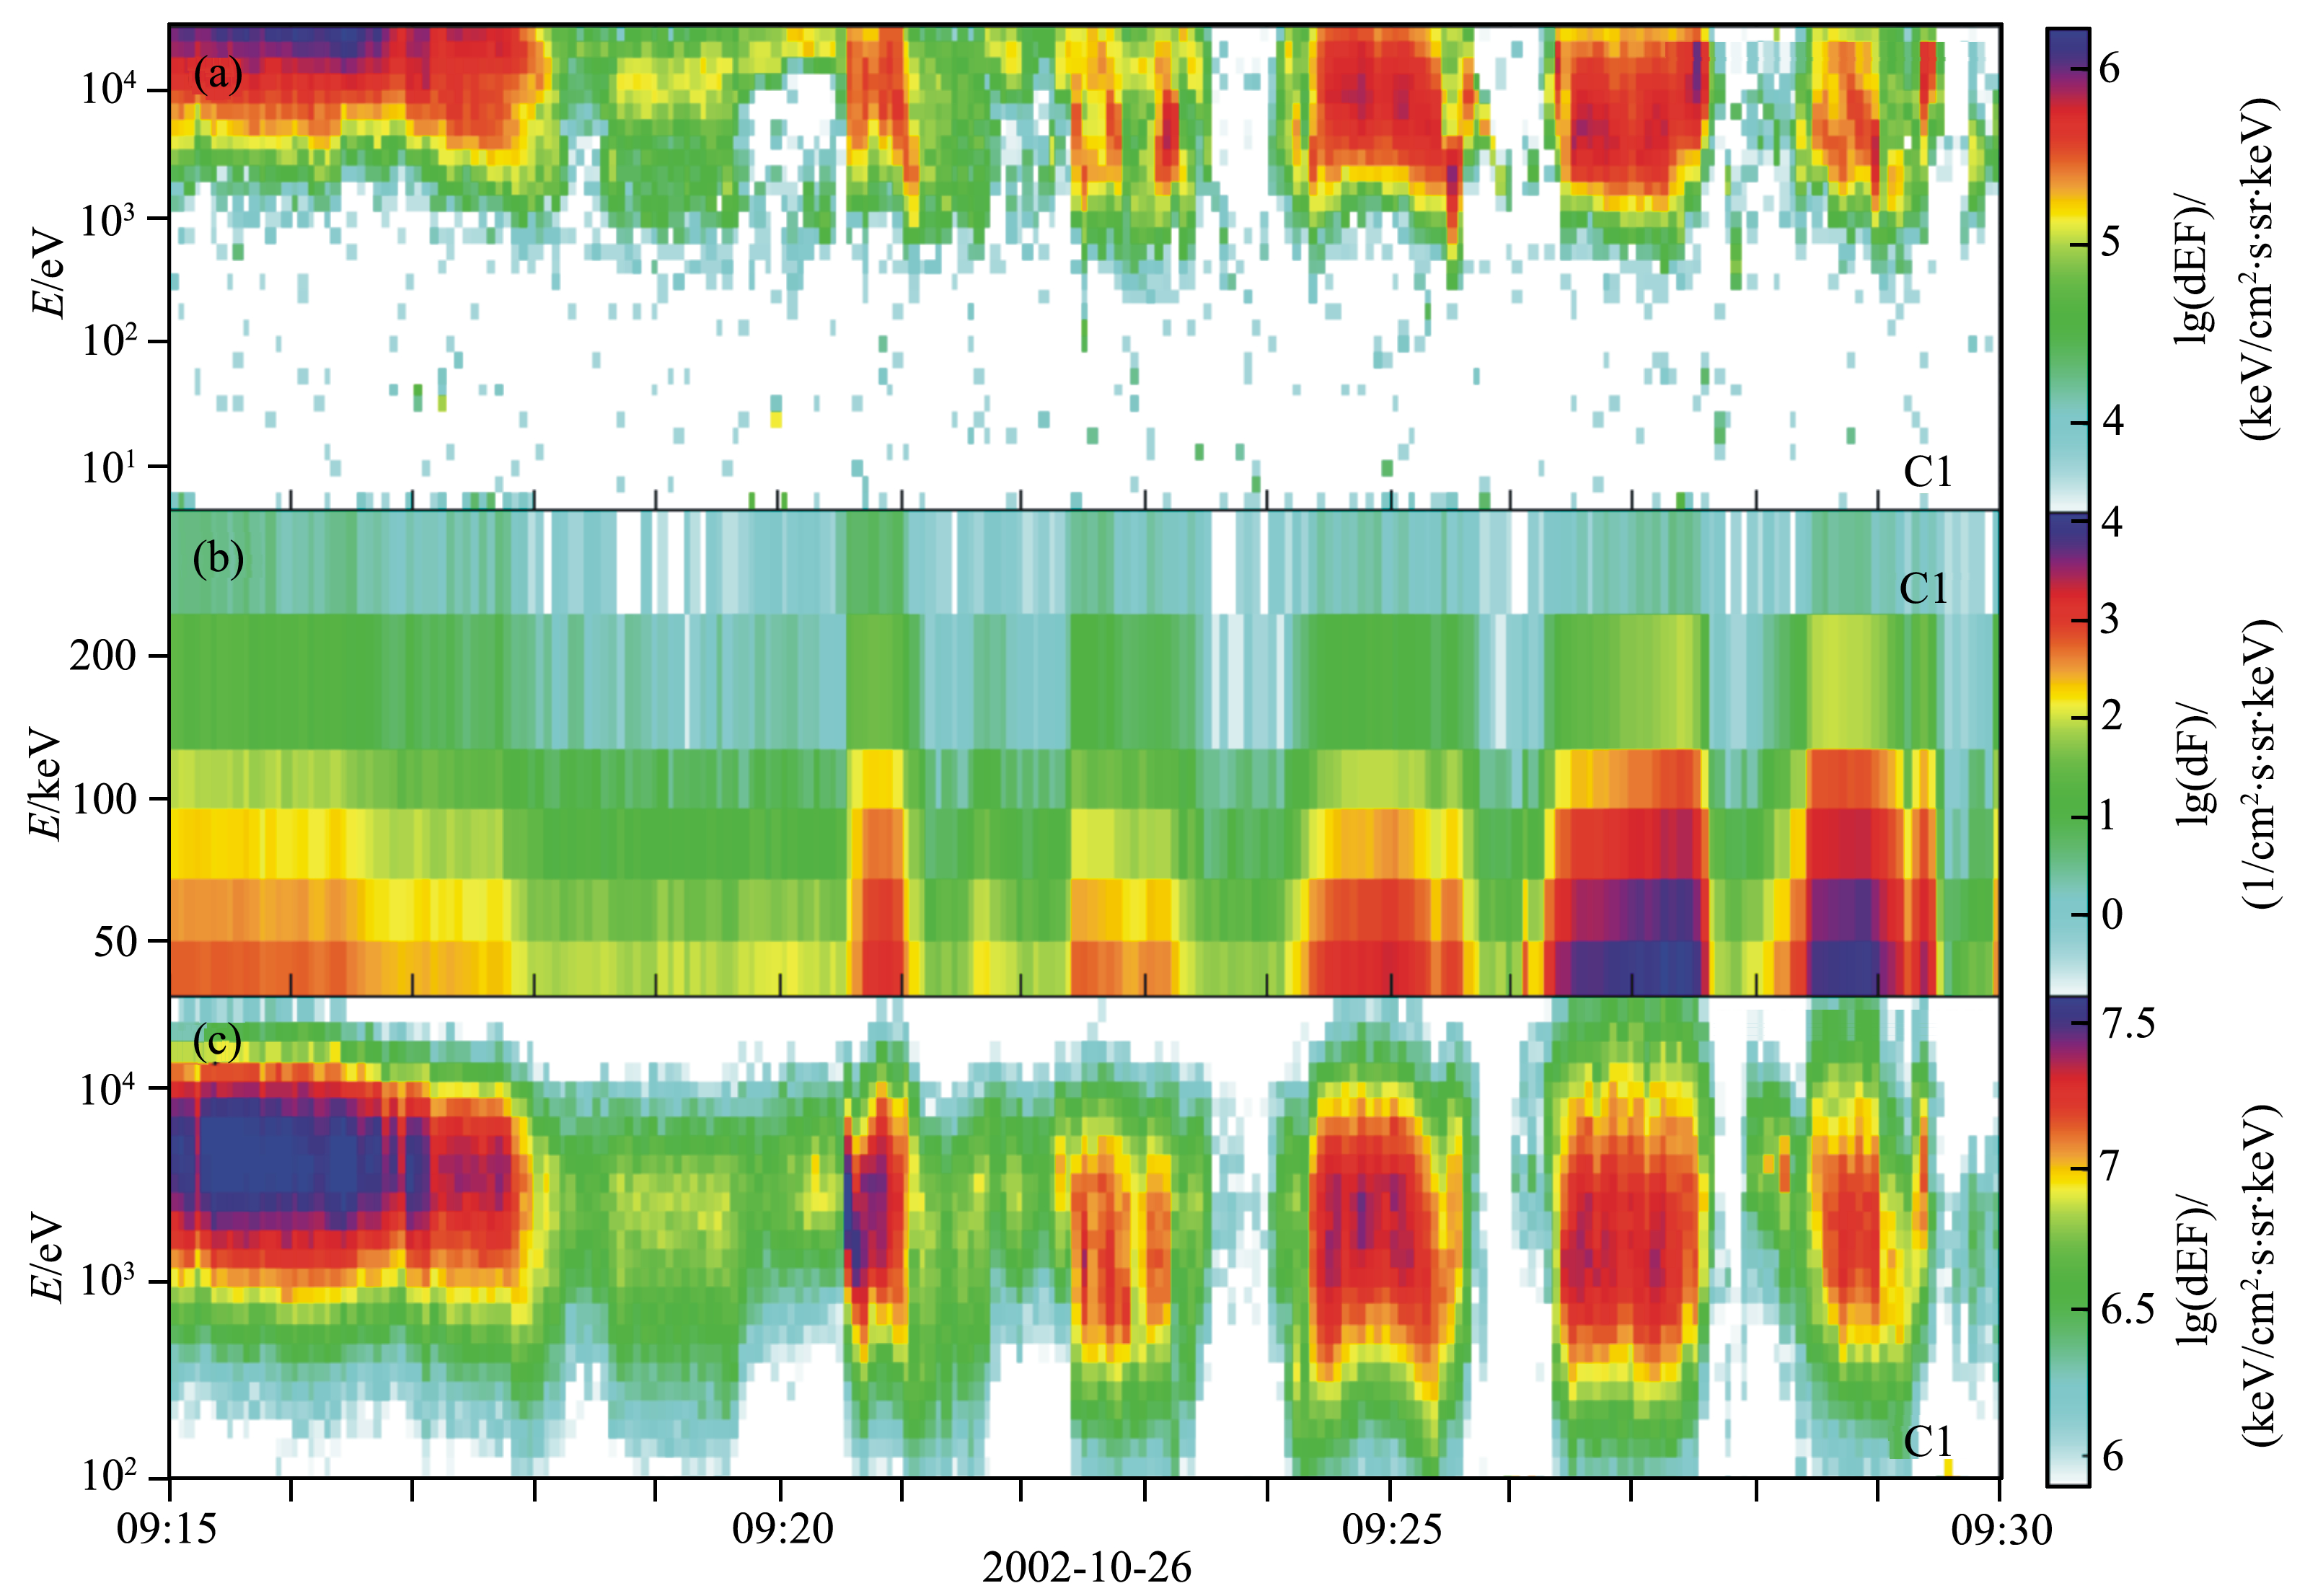
2.2 电流片拍动期间电子和离子能量通量特征图 3a给出了该事件中C1(CIS-HIA仪器)观测到的能量离子通量,可以看出能量约为10 keV的热离子的通量随着电流片拍动,呈现出周期性的变化.它在卫星穿越等离子体片中心(Bx≈0)时增 强,当卫星远离等离子体片中心时离子减弱.图 3b 给出了C1探测能量电子通量分布,能量为50~100 keV 的电子也和热离子一样,随着电流片拍动周期而周期性地增强和减弱,电子通量在卫星穿越等离子体片中心时通量增强,卫星到达等离子体边界时通量减弱.图 3c给出了C1(PEACE仪器)探测到的低能电子通量,从图中可以看到3 keV的低能电子通量与能量电子通量一样具有周期性的增强和减弱. 电子通量在卫星穿越等离子体片中心时增强,卫星到达等离子体边界时通量减弱,以上观测表明,在电流片拍动过程中,从低能的热粒子(离子和电子)到中高能的能量电子都呈现出相似的周期性变化.电子和离子的通量周期性变化与电流片拍动有着密不可分的关系.
 | 图 3 离子和电子的能量通量图 (a) CIS测到的离子通量; (b)RAPID测到的高能电子通量; (c) PEACE测到的低能电子通量.Fig. 3 The ions and electron energy flux Penal (a) shows ion flux by CIS of C1, penal (b) shows the high energy electron flux by RAPID of C1, penal (c) shows the low energy electron flux by PEACE of C1. |
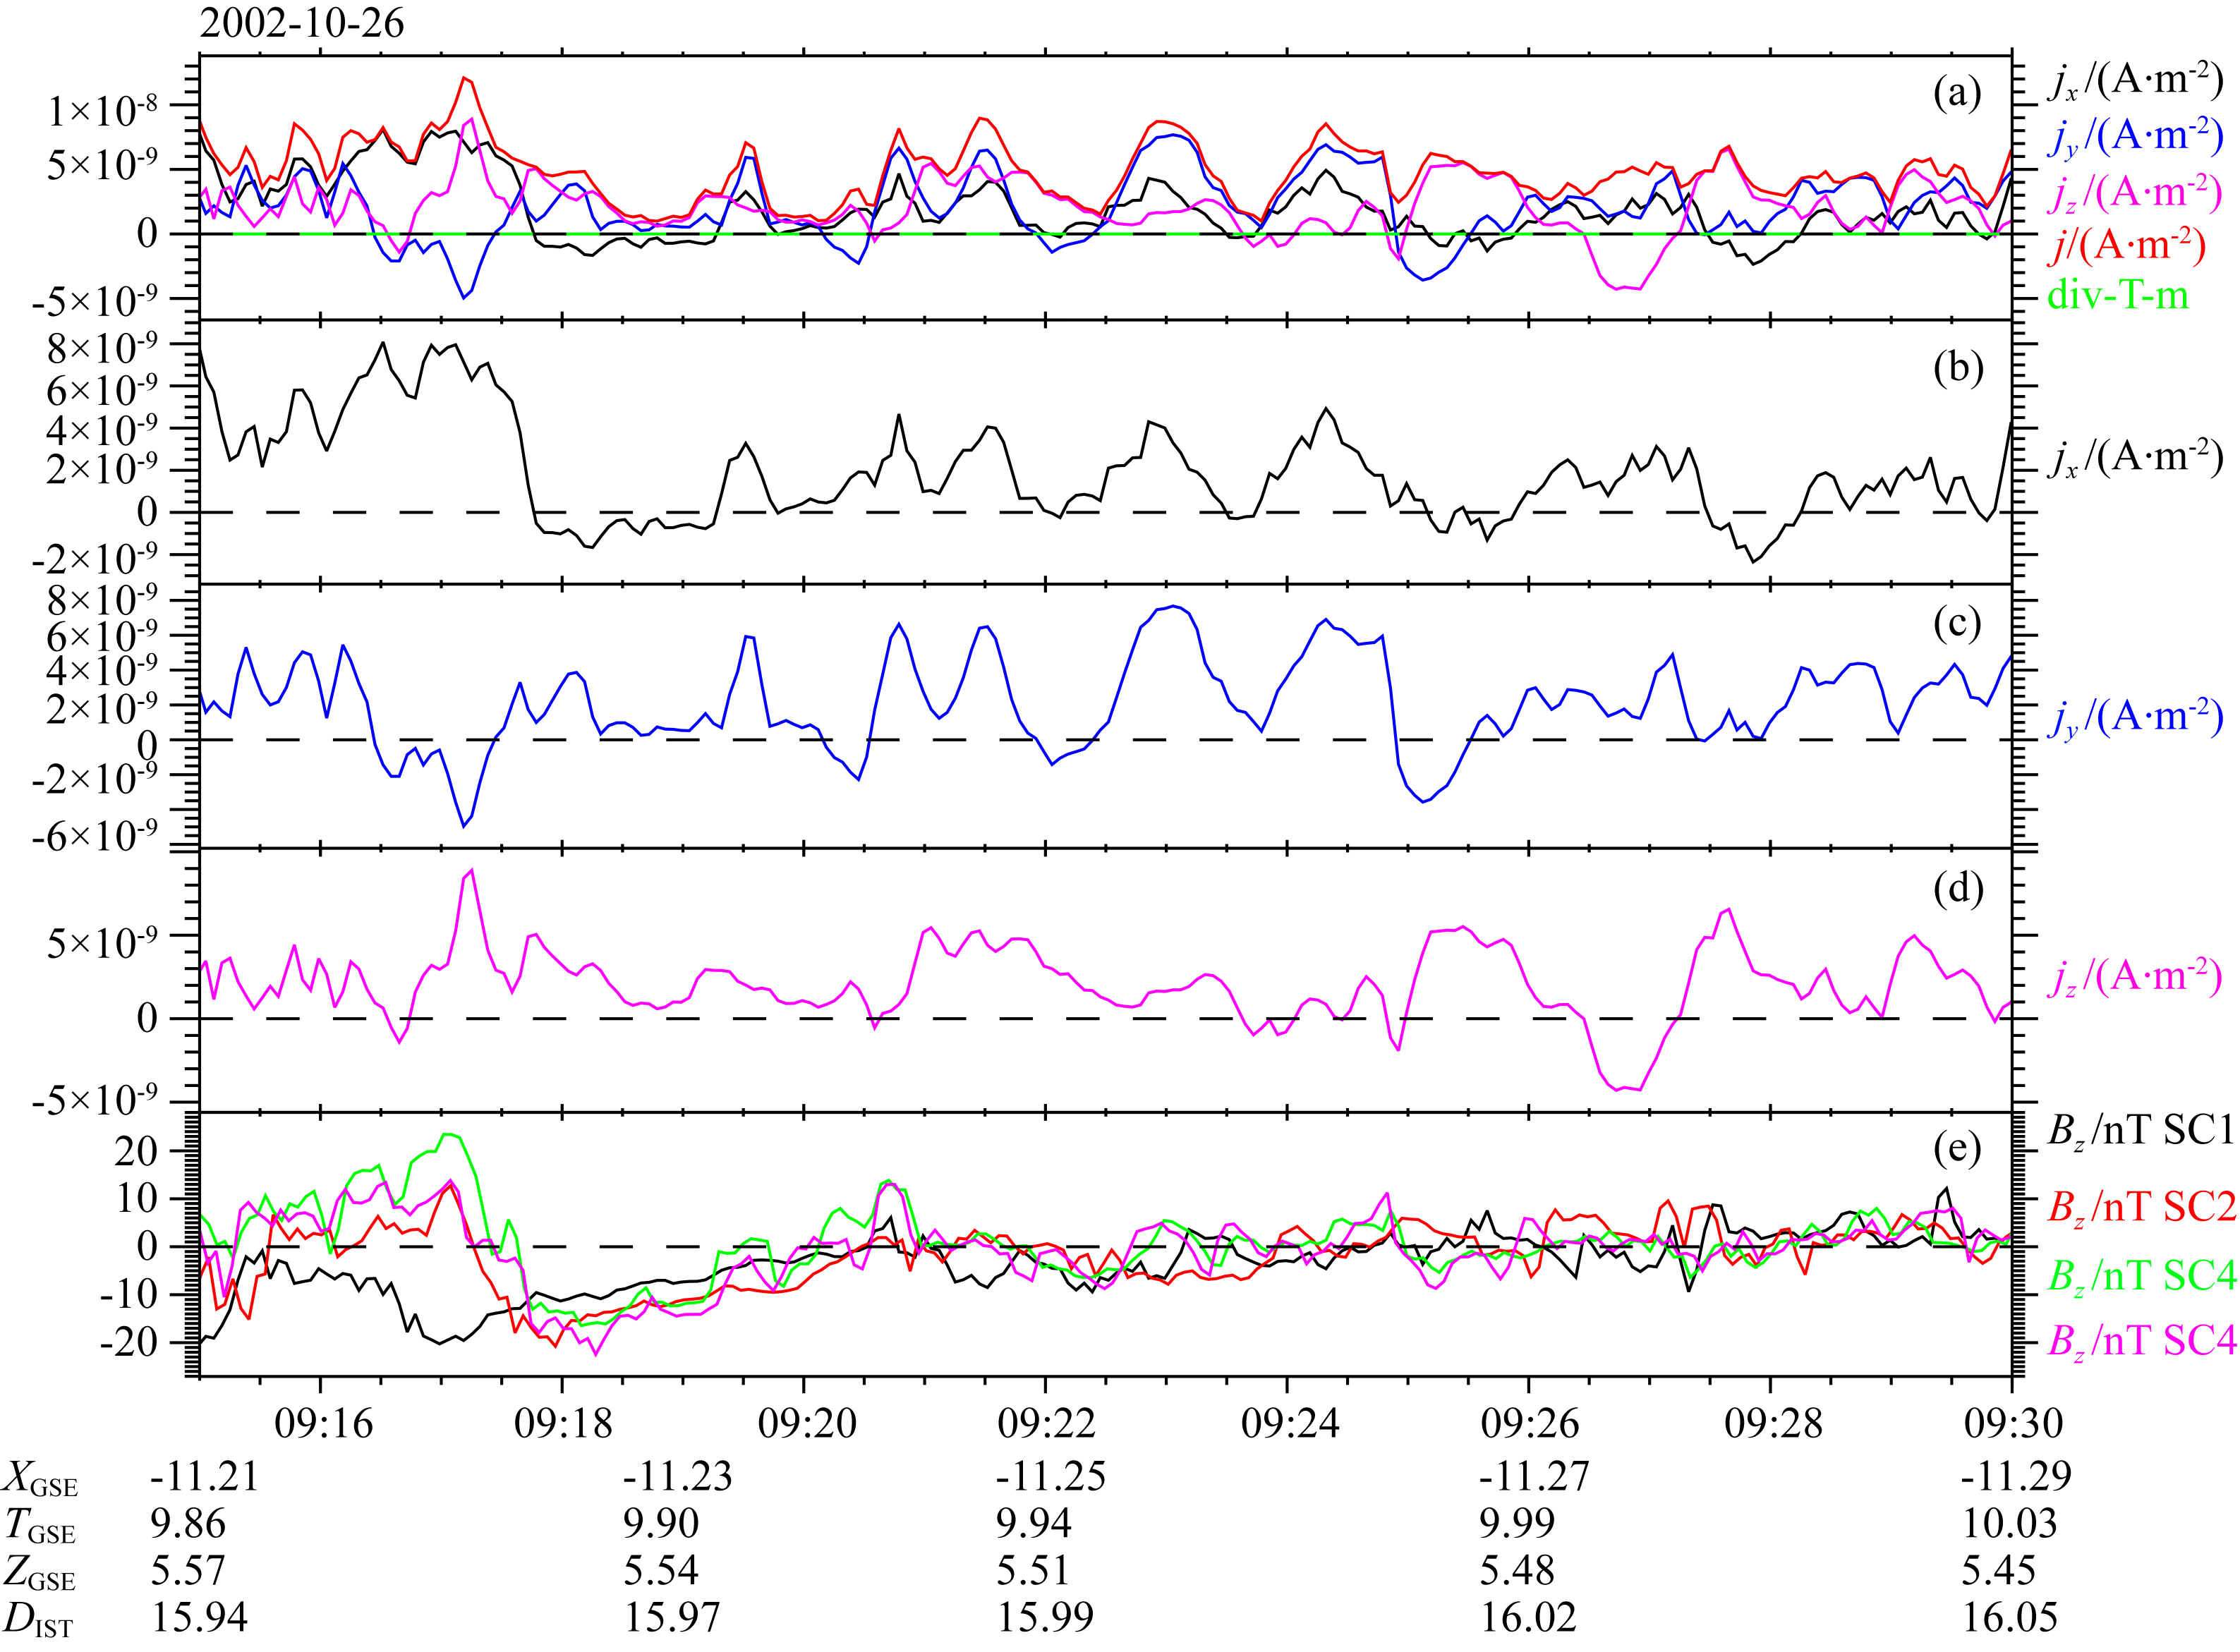
图 4给出了电流片拍动期间,利用Cluster 4颗卫星磁场数据计算的电流密度及其三个分量.电流密度的计算方法可参阅Callat et al.(2005).从图 4a可以看出电流密度在09 ∶ 21 ∶ 30的时候开始呈现出周期振荡,相位与磁场振荡差半个周期.图 4b和4c的电流密度X和Y分量都具有相同的特征,从图 4c和4e我们可以发现,电流密度的Y分量与C3和C4磁场的振荡吻合的非常好,相位差半个周期.而在C1的电流密度振荡明显滞后.电流密度的Z分量没有观测到有规则波的特征.电流密度的波动特征与磁场的波动特征吻合非常好,这说明电流密度的波动与磁场的波动有着密切联系.在本文分析的电流片拍动期间电流密度的特征与Rong等(2010)报道的电流片拍动事例中电流密度特征很不一样.Rong等分析的事例中电流密度的的波动主要发生在Z方向.但在我们的事例中,电流密度波动方向主要发生在X和Y方向.
 | 图 4 电流密度特征 (a) 总电流密度及各个分量的电流密度值; (b),(c),(d)分别给出了电流密度的X,Y,Z分量; (e) 给出了C1,C2,C3,C4观测到的磁场X分量.Fig. 4 Show the current density characteristics Penal (a) shows the total current density and every component of current density. Penal (b), (c) and (d) shows the X ,Y and Z component of current density. Penal (e) shows the magnetic field. |
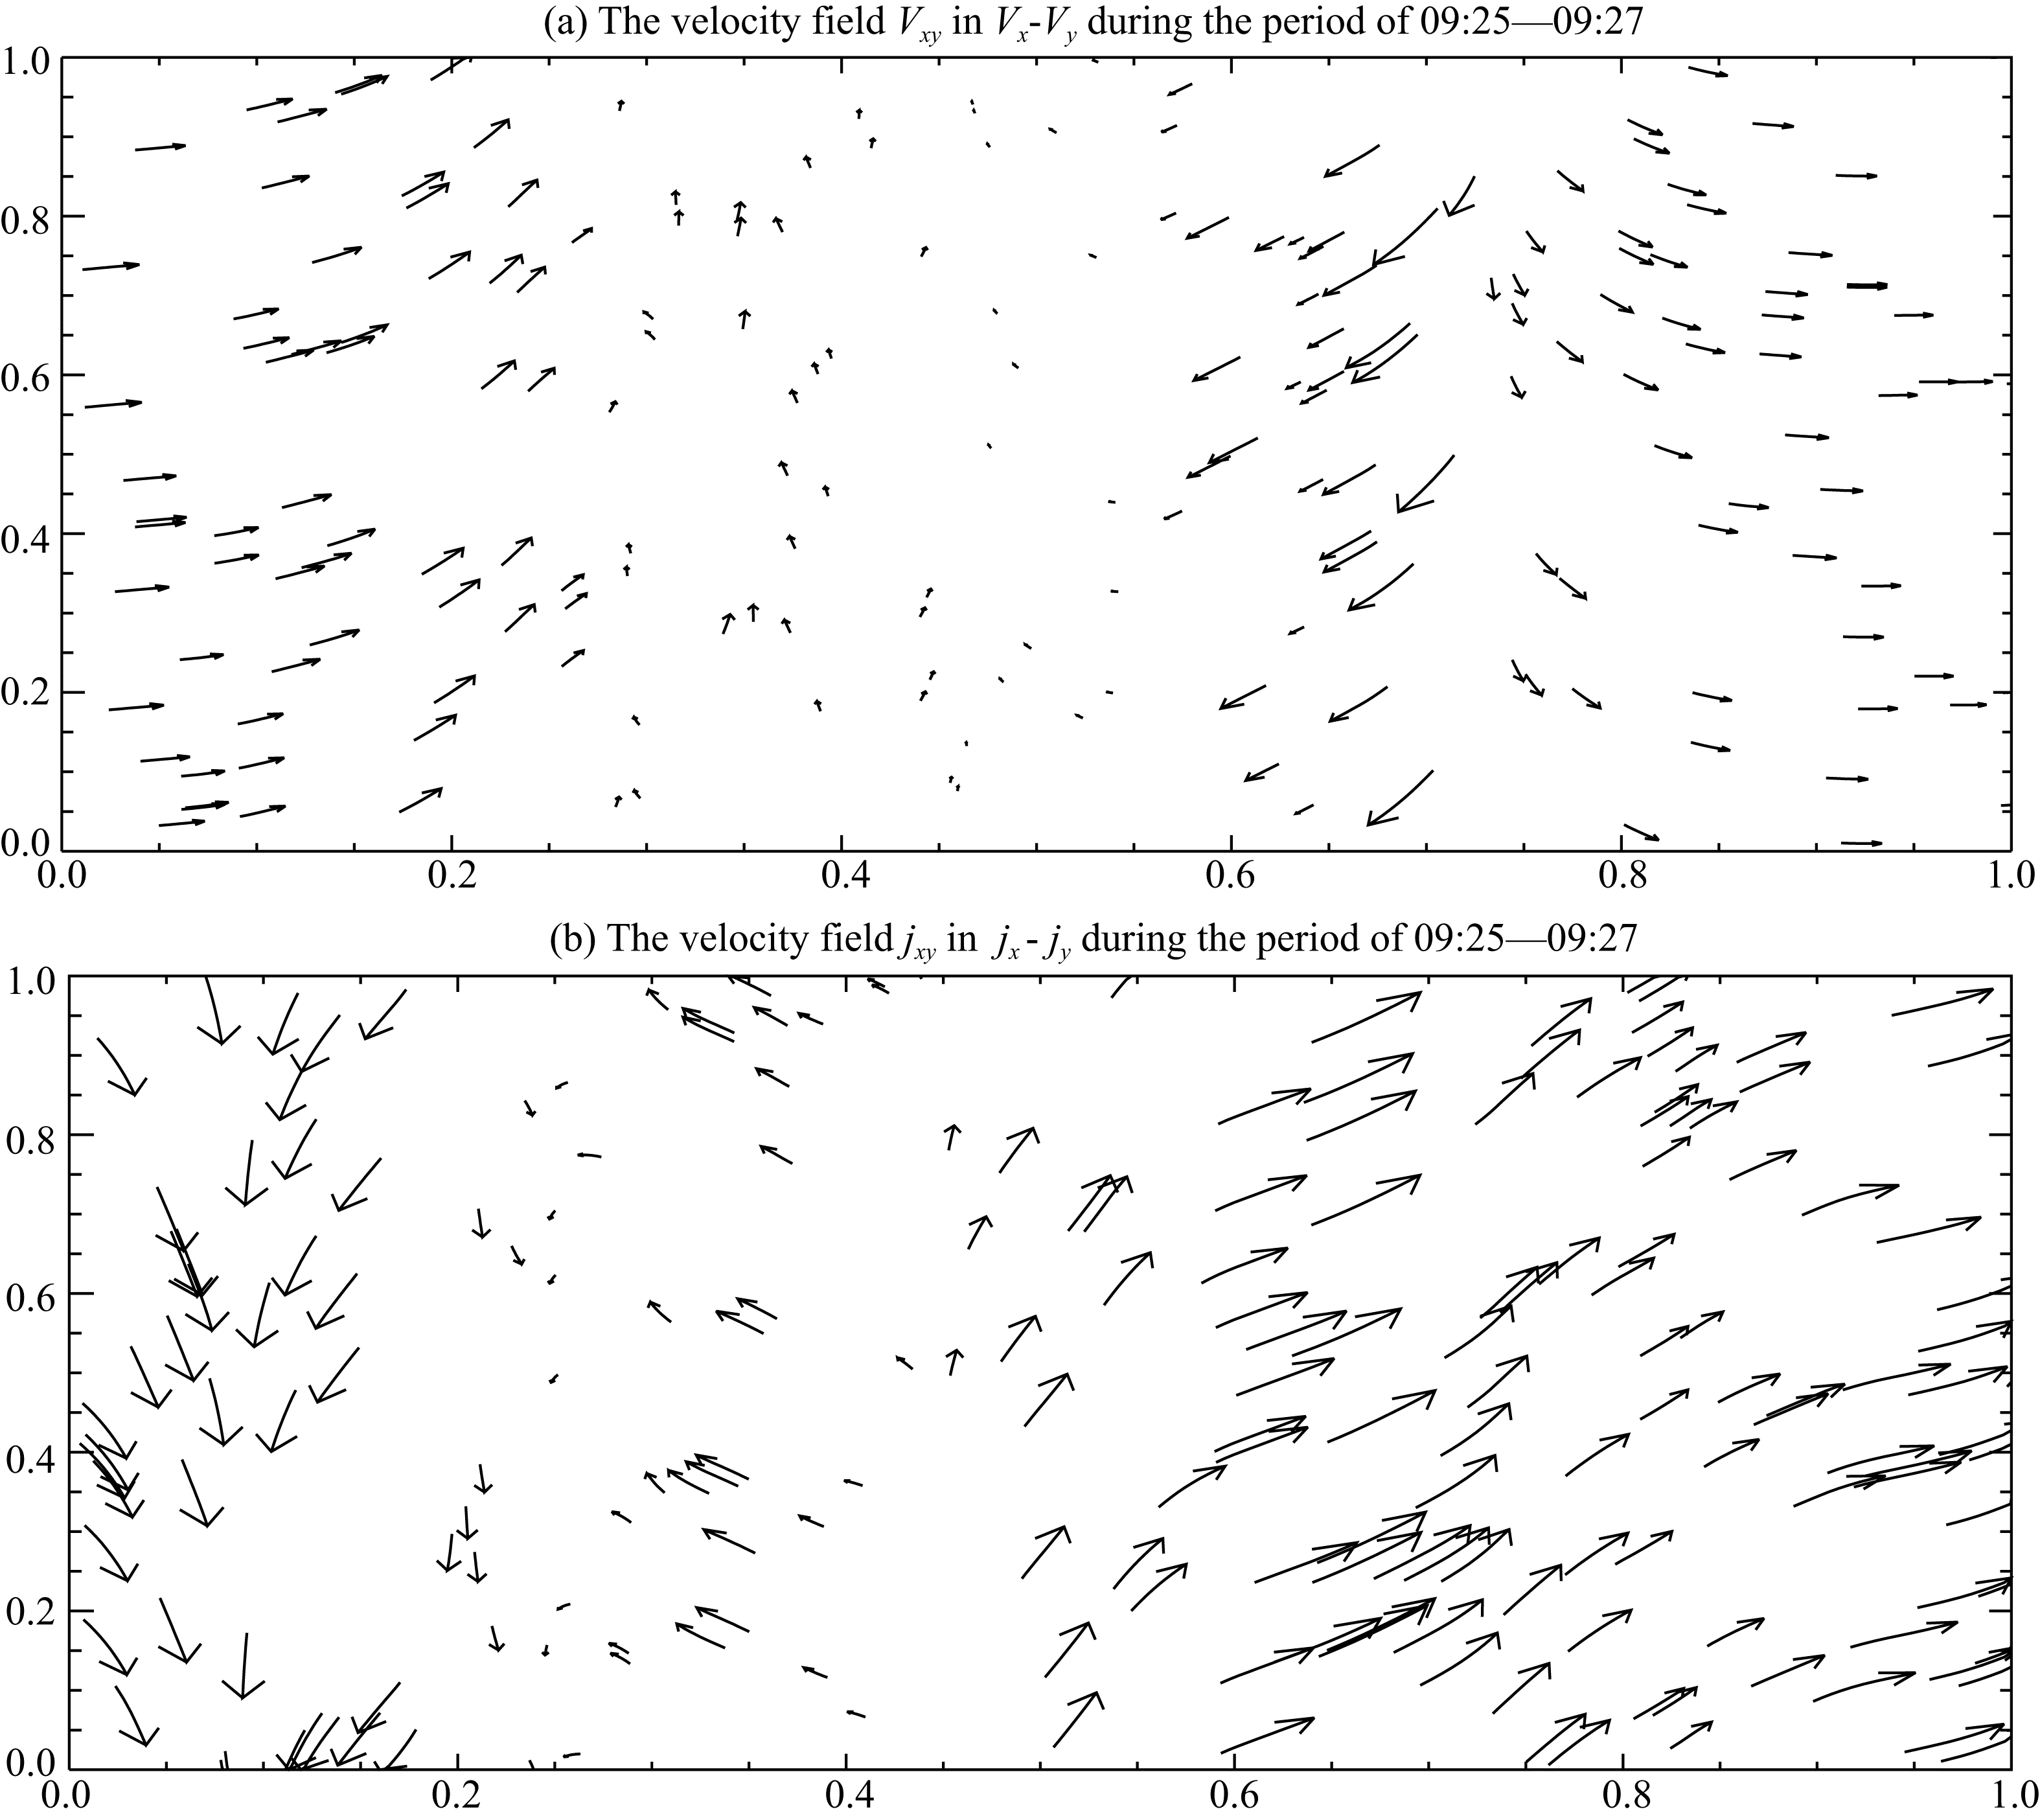
图 5a给出了09 ∶ 17—09 ∶ 19UT 期间C1探测到的在GSE X-Y平面上离子流速度矢量分布,这个时间段也是重联发生的时间段,图中可以看出,离子基本是朝一个方向运动的.图 5b给出了同一时间段GSE X-Y平面上电流密度的矢量分布,从图中可以看到电流密度的方向也基本是一个方向.图 6a给出了C1观测到的在一个拍动周期内的GSE X-Y平面上离子流速度矢量分布,选取的时间是电流片拍动的时间段09 ∶ 25—09 ∶ 27UT,图中可以看到速度矢量有涡旋的趋势,明显与图 5a中的速度矢量分布 不一样.同样,图 6b中电流矢量分布也有涡旋的趋势.
 | 图 5 (a)粒子速度矢量在X,Y平面的分布图,时间约为一个拍动周期;(b)电流矢量在X,Y平面的分布图,选取的时间段是 09 ∶ 16—09 ∶ 17UTFig. 5 (a) shows the distribution of x and y velocity vector in X and Y plane during in 09 ∶ 16—09 ∶ 17UT. Panal (b) shows the distribution of x and y current density in X and Y plane during one period 09 ∶ 16—09 ∶ 17UT |
 | 图 6 (a)粒子速度矢量在X,Y平面的分布图,时间约为一个拍动周期;(b)电流矢量在X,Y平面的分布图,选取的时间段是 09 ∶ 25—09 ∶ 27UTFig. 6 (a) shows the distribution of x and y velocity vector in X and Y plane during in 09 ∶ 25—09 ∶ 27UT. Penal (b) shows the distribution of x and y current density in X and Y plane during one period 09 ∶ 25—09 ∶ 27UT |
以上研究结果表明,在这个事件中等离子体的特征是与电流片的拍动密不可分的.在这个电流片拍动事件中,C1处于电流片的边缘位置,C3和C4离电流片的中心比较近,所以C3和C4先观测到了拍动波,C1后观测到拍动波,最后C1,C3和C4同时观测到拍动结束.在该次拍动事件中能量离子和电子的通量都具有周期性的增强和减弱的特征,并且是在磁场X分量最大(离电流片中心较远)的时候电子和离子通量最弱,而在磁场X分量最小(离电流片中心最近)的时候通量增强.从离子流的速度矢量分布特征和电流密度的矢量分布特征可以看出,此次有规律的电流片拍动不是远处传来的高速离子流引起的拍动,而是电流片内部的粒子运动引起的.
3 结论与讨论电流片拍动在磁尾常常被观测到,拍动波的周期从30 s到几分钟都有,拍动的幅度从几个nT 到几十个nT.以往的卫星观测显示电流片拍动与等离子体片中的高速流关系密切,因此一些科学家认为是间歇性的高速流压缩地球磁场,引起了磁场的振荡.并产生了电流片拍动.本文详细分析了2002年10月26日Cluster卫星观测到的一个电流片拍动事件.在该事件中,电流片拍动周期大约2 min,磁场波动的幅度约20 nT,这和以前的观测是相符的.这次事件中还观测到了较大的离子流速,其中最大速度高达600 km·s-1.电流片拍动周期内流速分量有明显的周期性变化,并伴随着方向的改变.能量电子和离子的通量也周期性地增强和减弱.电流密度的X和Y分量也具有周期性的振荡,并且拍动振荡周期与磁场波动的周期是一致的.通过对离子流速矢量和电流密度矢量的分析,发现在电流片拍动期间,粒子运动具有涡旋的特征,根据这些特征我们可以推断,该事件中电流片的拍动不是由磁尾等离子体片高速流触发的,这和现有的电流片拍动机制都不太吻合.因此,电流片的拍动产生机制和表现形式是非常复杂的,完全弄清这个问题还有待未来积累更多的卫星观测.
| [1] | Balogh A, Carr C M, Acuña M H, et al. 2001. The cluster magnetic field investigation: Overview of on-flight performance and initial results. Ann. Geophys,. 19(12): 1207-1217. |
| [2] | Cao J B, Ma Y D, Parks G, et al. 2006,Joint observations by Cluster satellites of bursty bulk flows in the magnetotail. Journal of Geophysical Research, 111(A4)(2006), A04206,doi:10.1029/2005JA011322. |
| [3] | Duan A Y, Cao J B, Ma Y D, et al. 2013. Cluster observations of large-scale southward movement and dawnward-duskward flapping of Earth's magnetotail current sheet. Science in China (E), 56(1):194-204. |
| [4] | Eastwood J P, Phan T D, Oieroset M, et al. 2010. Average properties of the magnetic reconnection ion diffusion region in the Earth's magnetotail: The 2001—2005 Cluster observations and comparison with simulations. J. Geophys. Res,. 115: A0825,doi: 10.1029/2009JA014962. |
| [5] | Gabrieles C, Aangelopoulos V, Runove A, et al. 2008. Propagation characteristics of plasma sheet oscillations during a small storm. Geophys. Res. Lett,. 35: L02102.DOI: 10.1029/2008GL033664. |
| [6] | Lui A T Y, Meng C I, Akasofu S I. 1978. Wavy nature of the magnetotail neutral sheet. Geophys. Res.Lett,. 5(4): 279-282. |
| [7] | Ness N F. 1965. The Earth's magnetic tail. J. Geophys. Res,. 70(13): 2989-3005. |
| [8] | Rème H, Aoustin C, Bosqued J M, et al. 2001. First multispacecraft ion measurements in and near the Earth's magnetosphere with the identical Cluster ion spectrometry (CIS) experiment. Ann.Geophys,. 19(10-12): 1303-1354. |
| [9] | Rong Z J, Shen C, Petrukovich A A, et al. 2010. The analytic properties of the flapping current sheet in the magntotail. Planet.Space Sci,. 58(10): 1215-1229. |
| [10] | Rong Z J, Wan W X, Shen C, et al. 2011. Statistical survey on the magnetic structure in magnetotail current sheets. J. Geophys.Res,. 116, A09218 doi: 10. 1029/2011JA016489 |
| [11] | Runov A, Nakamura R, Baumjohann W, et al. 2003a. Cluster observation of a bifurcated current sheet. Geophys. Res. Lett,. 30(2): 1036, doi: 10.1029/2002GL016136. |
| [12] | Runov A R, Nakamura W, Baumjohann W, et al. 2003b. Current sheet structure near magnetic X-line observed by Cluster. Geophys. Res.Lett,. 30: 1579, doi: 10. 1029/2002GL016730 |
| [13] | Runov A, Sergeev V A, Baumjohann W, et al. 2005. Electric current and magnetic field geometry in flapping magnetotail current sheets. Ann.Geophys,. 23(4): 1391-1403. |
| [14] | Sergeev V A, Angelopoulos V, Carlson C, et al. 1998. Current sheet measurements within a flapping plasma sheet. J. Geophys.Res,. 103(A5): 9177-9188. |
| [15] | Sergeev V A, Runov A, Baumjohann W, et al. 2003. Current sheet flapping motion and structure observed by Cluster. Geophys. Res. Lett,. 30: 1327, doi: 10.1029/2002GL016500. |
| [16] | Sergeev V A, Runov A, Baumjohann W, et al. 2004. Orientation and propagation of current sheet oscillations. Geophys. Res. Lett,. 31: L05807, doi: 10. 1029/2003GL019346 |
| [17] | Sergeev V A, Sormakov D A, Apatenkov S V, et al. 2006. Survey of large-amplitude flapping motions in the midtail current sheet. Ann.Geophys,. 24: 2015-2024. |
| [18] | Speiser T W, Ness N F. 1967. The neutral sheet in the geomagnetic tail: its motion, equivalent currents, and field-line reconnection through it. J. Geophys.Res,. 72(1): 131-141. |
| [19] | Wei X H, Cai C L, Cao J B, 2015. Flapping motions of the magnetotail current sheet excited by nonadiabatic ions. Geophys. Res. Lett,. 42, 4731-4735,doi:10.1002/2015GL064459. |
| [20] | Zhang T L, Nakamura R, Volwerk M, et al. 2005. Double Star/Cluster observation of neutral sheet oscillations on 5 August 2004. Ann.Geophys,. 23(8): 2909-2914. |
 2015, Vol. 58

