2. 中国科学院大学, 北京 100049;
3. 中国地震局地震预测研究所, 北京 100036
2. University of Chinese Academy of Sciences, Beijing 100049, China;
3. Institute of Earthquake Science, China Earthquake Administration, Beijing 100036, China
很多学者研究发现,在一些大地震前存在电离层扰动现象,其中包括电磁场异常、等离子体温度、密度变化等(Gokhberg et al., 1982; Larkina et al., 1983;Pulinets et al., 2005;Parrot et al., 2006;Zhao et al., 2008;Liu et al., 2000;Zhang et al., 2012,2014;泽仁志玛等,2012).受观测技术的影响,在这些参量中,由电离层垂测仪观测的F2层临界频率(foF2)和峰值高度(NmF2),及地面GPS 接收机反演得到TEC备受科学家的关注(Liu et al., 2001;Hayakawa and Molchanov, 2002;Chen et al., 2004; Liperovskaya et al., 2006).现有结果表明,由于在全球实现了致密和连续观测,GPS TEC可以有效用于开展临震电离层扰动现象的监测和研究.
随着研究的不断深入,科学家们除开展个例研究外,也开始基于GPS TEC进行大量震例的统计分析(Liu et al., 2000,2001;Dautermann et al., 2007).Liu等(2009)分析发现,17个M>6.3地震前3—5天震中上空的TEC 出现明显的降低现象.通过分析2002—2010年全球736个M≥6.0地震,Le等(2011)得出震级越大、震源深度越浅、时间越靠近地震,定义的PE就越大.Kon等(2011)通过研究1998—2010年M≥6.0以上日本地震发现,震中1000 km范围内震前1—5天TEC明显的正异常现象.
在地震电离层耦合机理研究方面,学者们认为 震中附近的电磁辐射可以通过电磁途径(Molchanov et al., 1995;Pulinets et al., 2000;Sorokin et al., 2005;Takeuchi et al., 2006)(例如电磁波、静电场)、 声学途径(例如声重波)(Shalimov and Gokhberg, 1998;Molchanov et al., 2004;Otsuka et al., 2006)、化学途径(例如氡气溢出)(King et al., 1993;Utkin and Yurkov, 1998)传播到电离层.近期,学者们更倾向于应用静电场的理论来解释震前的这些电离层扰动现象(Zhao et al., 2008;Kuo et al., 2011).如果静电场在地震电离层耦合机理方面占主导因素的话,在 E × B 的作用下,电离层高度的等离子体将发生漂移,这样临震电离层扰动特征与强度将在相对震中的各个方向上存在差异.据此,由地震引起的电离层扰动不仅有时序上的特征也应具有空间变化特征.本文将基于GPS TEC数据对中国大陆MS≥6.0地震开展临震电离层扰动研究,在关注时序变化的基础上更关注其空间的变化特征.
2 数据介绍本研究主要对中国大陆1998年11月1日—2010年12月31日MS≥6.0级地震(http://www.csndmc.ac.cn/newweb/data.htm,正式地震目录)进行分析,首先对地震进行筛选:Le等(2011)研究表明震源深度越浅电离层异常越明显,因此本文对深度大于100 km的地震暂不分析;研究发现电离层除有临震异常外,也存在震后扰动,因此剔除1次地震其后15天内与之距离小于10°的地震.经这样筛选后,最后剩下39个MS≥6.0级的地震,地震目录如表 1.
用GPS的观测数据绘制全球/局域电离层地图可追溯到1992年,JPL(Jet Populsion Laboratry,美国喷气动力实验室)的Wilson等(1992)和Mannucci等(1998)采用8阶的球谐函数方法率先绘制了全球电离层地图.JPL全球电离层图是JPL根据IGS及其他组织150个左右的GPS台站每隔2 h得到的垂直TEC值,分辨率为2.5°(纬度)×5°(经度).其中,计算垂直TEC时应用了太阳-地磁参考模型,球形网格上采用了双三次样条拟合的方法,同时,为解决来自网格内仪器误差和随机参数造成垂直TEC的同时性,还应用了卡尔曼滤波法.本研究围绕中国大陆附近的地震,从网站-ftp://cddis.gsfc.nasa.gov/pub/gps/products/ionex-上 下载1998年9月1日—2010年12月31日GPS TEC 数据,并建立数据与地震事件的关联,以开展震例分析.
|
|
表 1 1998年11月1日—2010年12月31日中国大陆MS≥6.0地震目录(UT时) Table 1 MS≥6.0 earthquakes that occurred in China main l and from November 1st,1998 to December 31st,2010 |
3 分析结果
在提取异常时,需要给出一定的背景和阈值,本研究将参照Liu等(2009)分析方法来设定阈值,异常下限LB=M-1.5(M-LQ),异常上限UB=M+1.5(UQ-M),其中M为前15天中值,LQ和UQ分别为前15天的上下四分位数,这样落入LB和UB范围内的数值概率为65%.
为分析临震TEC在震中不同方位的变化特征,针对39次地震提取震中上空及其东、南、西、北共5个方格内的TEC时序数据,每天每2 h的数据均按上述方法提取扰动,并统计所有地震正负异常个数.为观察电离层扰动的时序特征,绘制了5个格子内震前15天到地震当天的时序曲线图(图 1).与Liu等(2009)研究结果类似,图中反映出震前3—5天负异常高于正异常,但5个方位上变化不大,造成这种现象的原因可能是,临震异常范围要偏离震中更远些,而不仅局限于震中5°~10°范围内;临震异常的扰动可能不会细化到小时量级.
鉴于此我们将观测范围扩大,以正负异常差异较明显的3—5天作为一个整体分析,按上述异常分析方法,累加震中±10°范围内的每个格子内震前3—5天每2 h正负个数,图 2、图 3分布为正、负异常累加图,其中a图每个柱形为各经度上9个纬度网格内数值的累加,b图为每个网格内震前3—5天每2 h全部数值累加的空间分布图,c图每个柱形为各纬度上5个经度网格内数值的累加.对于正异常,其南侧的异常个数高于北侧,图 2b显示最大值并不位于震中上空,而是向南、东南方向偏移,图 2a表明经度方向上的极值位于震中西侧5°,图 2c表明震中纬度的数值最低,向南北方向逐渐递增,极值可能还要在更远的位置上.对于负异常,图 3b显示仍是南、西南方向高于北侧,图 3c显示由震中纬度向北侧有逐渐衰减的趋势,南侧峰值位于5°~7.5°;经度上,由震中向西逐渐递增,向东逐渐递减.
为进一步分析不同空间尺度上临震TEC随时间的变化特征,首先绘制震前0—15天每日正负异常24 h累加震中±10°范围内的空间分布图(图 4、图 5).图 4显示正异常主要出现在震前14天震中西南方向,其他日较平静.图 5中负异常则出现在震前5天,范围较大,震中西南、正南和东南均有分布,并且西南方向扰动强度大于东南方向.
其次,将空间范围扩大,绘制震前0—15天每日正负异常24 h累加震中附近±20°范围内的空间分布图(图 6、图 7).震前14日的正异常仍继续向西南方向发展,纬度上大致在南12.5°处截止,经度上大致在西15°截止.震前10天,震中西南方向也出现了高值区,最南端到17.5°.此外,在震前14天、13天、12天和10天震中北侧也出现了高值.负异常仍是主要出现在震前5天,其扰动范围向东南方向继续扩大,纬度大致截止在南15°,经度上有向东侧增强的趋势.
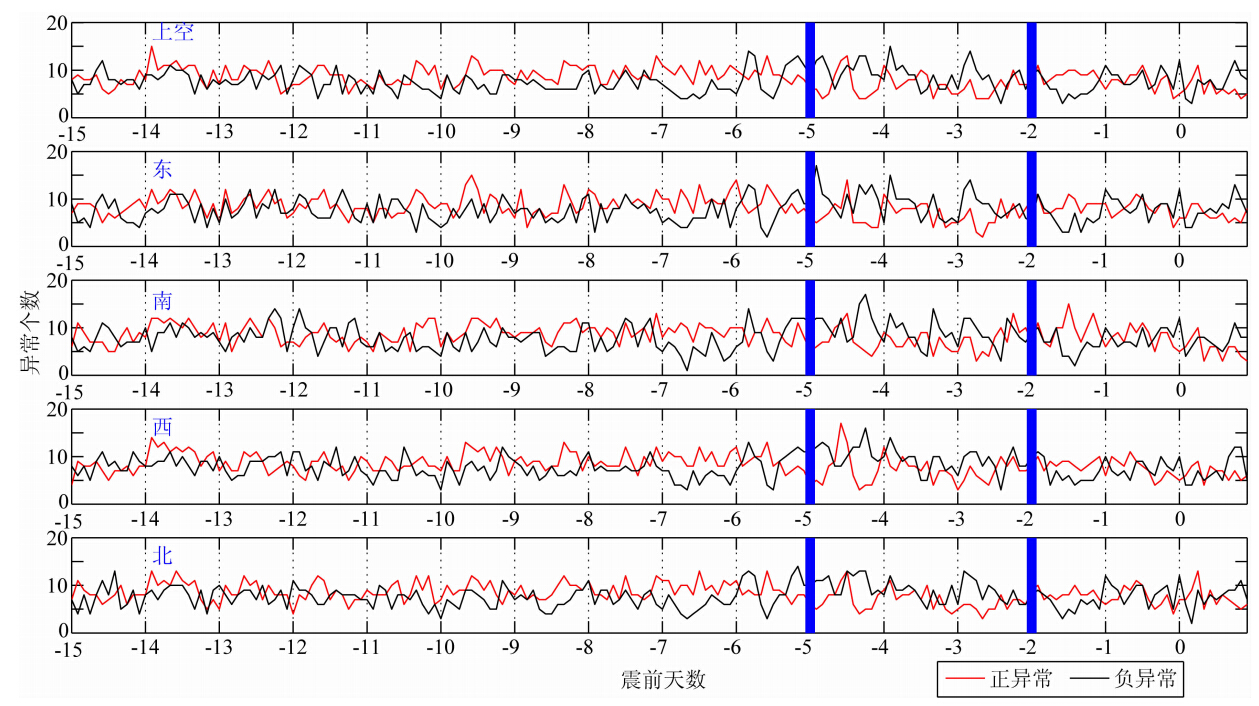 | 图 1 震前15天-地震当天各方位正负异常时序分析图Fig. 1 Time series of positive and negative abnormities in each directions 15 days before earthquakes |
 | 图 2 临震3—5天正异常个数累计图(a)各经度上每个纬度网格内数值;(b)震中±10°范围内每个网格全部数值的累加值;(c)各纬度上每个经度网格内数值的和Fig. 2 Sum of positive abnormities from 3 to 5 days prior to earthquakes(a)Sum of latitude data from west to east;(b)Sum of each grid from 3 to 5 days around ±10° region;(c)Sum of longitude data from north to south. |
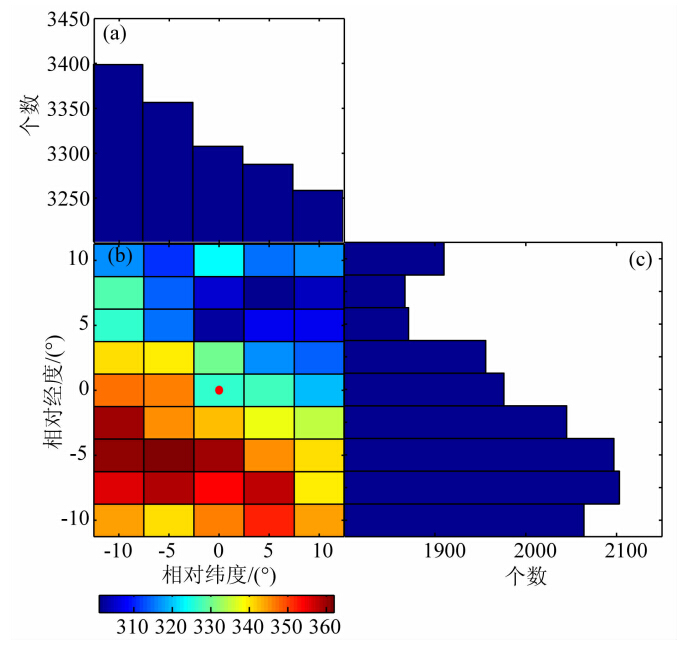 | 图 3 临震3—5天负异常个数累计图(各子图说明同图 2)Fig. 3 Sum of negative abnormities from 3 to 5 days prior to earthquakes(subgraph description same as Fig. 2) |
最后,将分析范围继续扩大,绘制震中±30°范围内正负异常分布图(图 8、图 9).与±20°空间分布图比较,震前14天、13天、12天和10天北侧扰动范围加大,并且异常个数增加,同时震前1天北侧也出现高值区.由于本研究分析的39个地震平均纬度为32.36°N,再向北推20°~30°会进入高纬扰动区,因此,本研究认为这些远离震中出现在北侧的异常与电离层高纬极区扰动等因素有关.此外,震前10天西南方向扰动继续向西扩展,并且趋势增强,这种远离震中且有增强趋势的扰动可能与地震的关系不大.负异常还是围绕在震前5天,但向东侧扩展,并且强度加大.学者们研究发现(Henderson et al., 2005;Sagawa et al., 2005),赤道异常在非洲西部、亚洲东南部、太平洋中部和美国南部会有增强现象,Wan等(2008)通过分析JPL TEC数据,也发现了这种4波结构现象,本研究认为远离震中发生在中国东南部的扰动可能与4波结构有关,而并非地震异常.
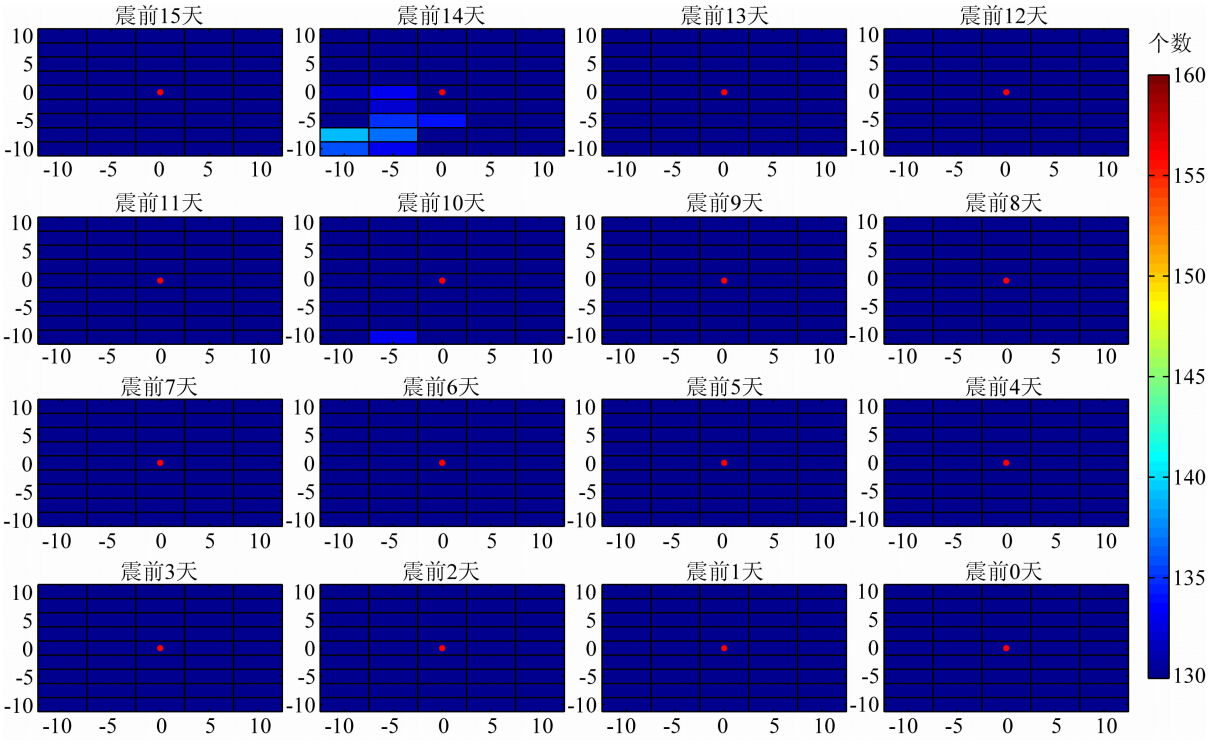 | 图 4 震前0—15天震中附近±10°范围正异常空间分布图横、纵坐标为相对震中的经、纬度,下同.Fig. 4 ±10° spatial distribution of positive abnormities from 0 to 15 days prior to earthquakes |
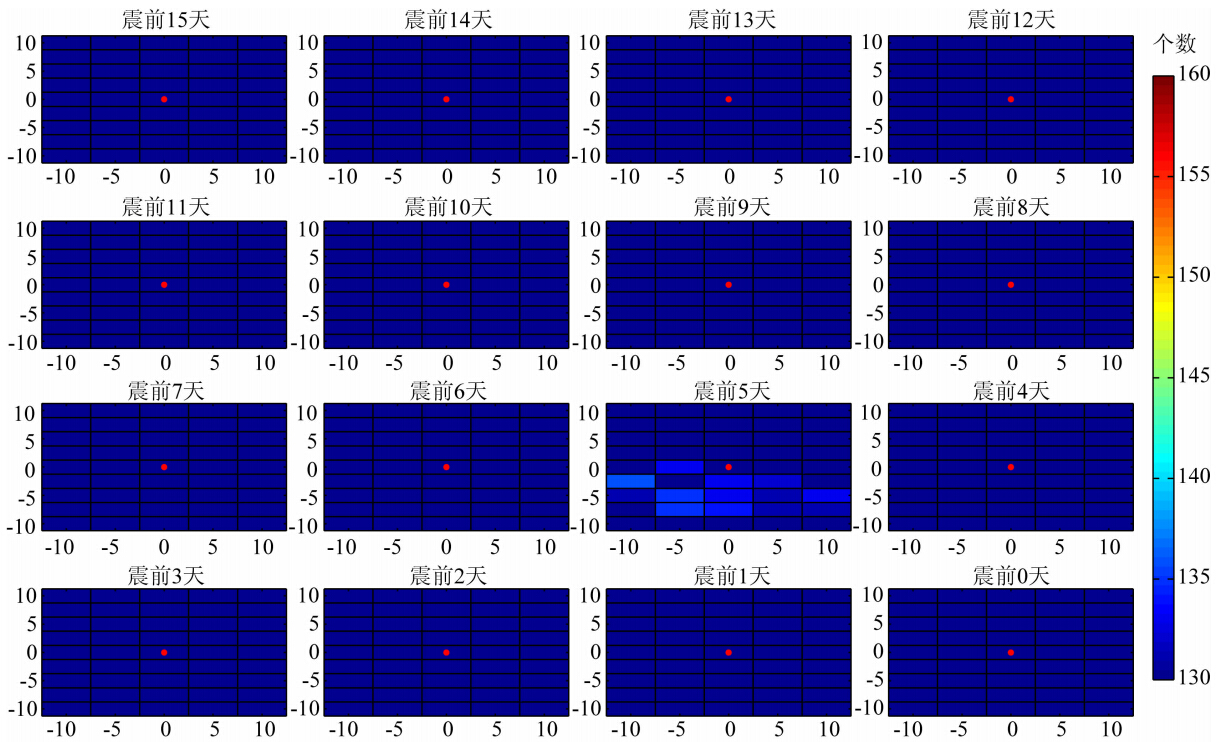 | 图 5 震前0—15天震中附近±10°范围负异常空间分布图Fig. 1 ±10° spatial distribution of negative abnormities from 0 to 15 days prior to earthquakes |
本文应用Liu等(2009)提出的异常提取方法对中国39次MS≥6.0级以上震例进行了临震电离层时间和空间变化的分析,得到以下结论:
(1)震中上空及周围的东、南、西、北4个方向震前15天到地震当天时序变化趋势较相似,5个方向 都观测到了震前3—5天负异常稍高于正异常的现象;
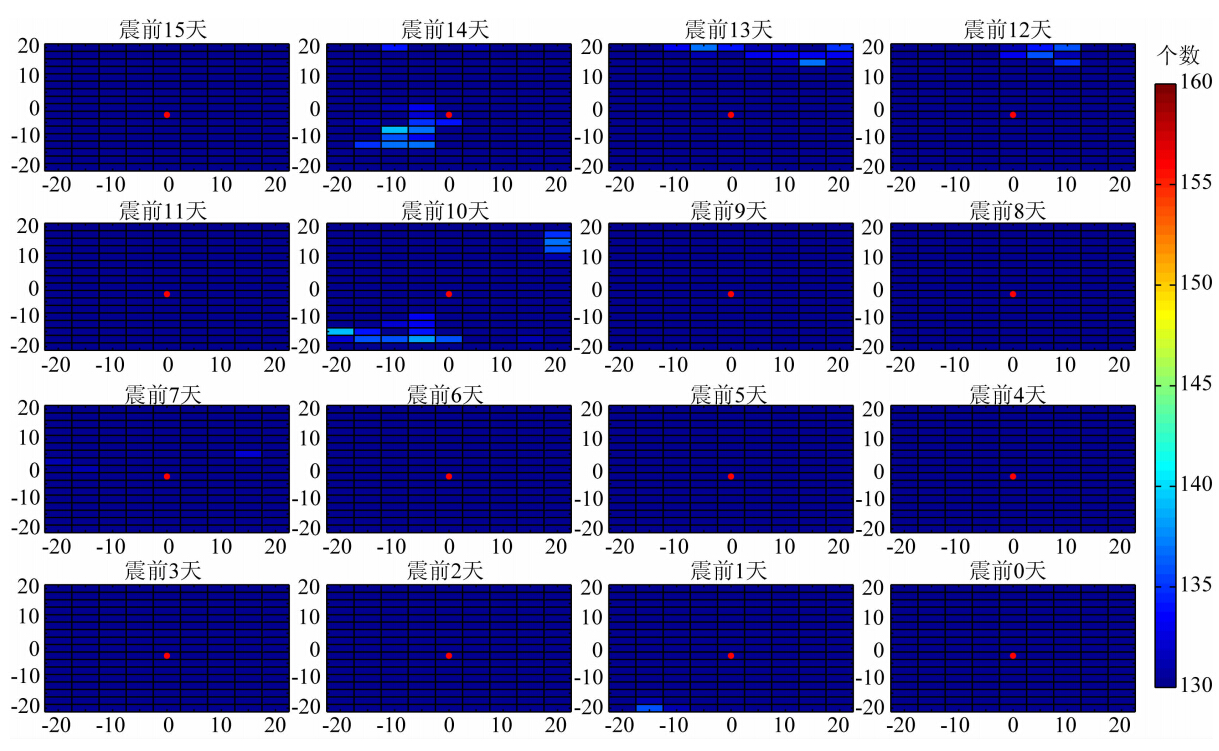 | 图 6 震前0—15天震中附近±20°范围正异常空间分布图Fig. 6 ±20° spatial distribution of positive abnormities from 0 to 15 days prior to earthquakes |
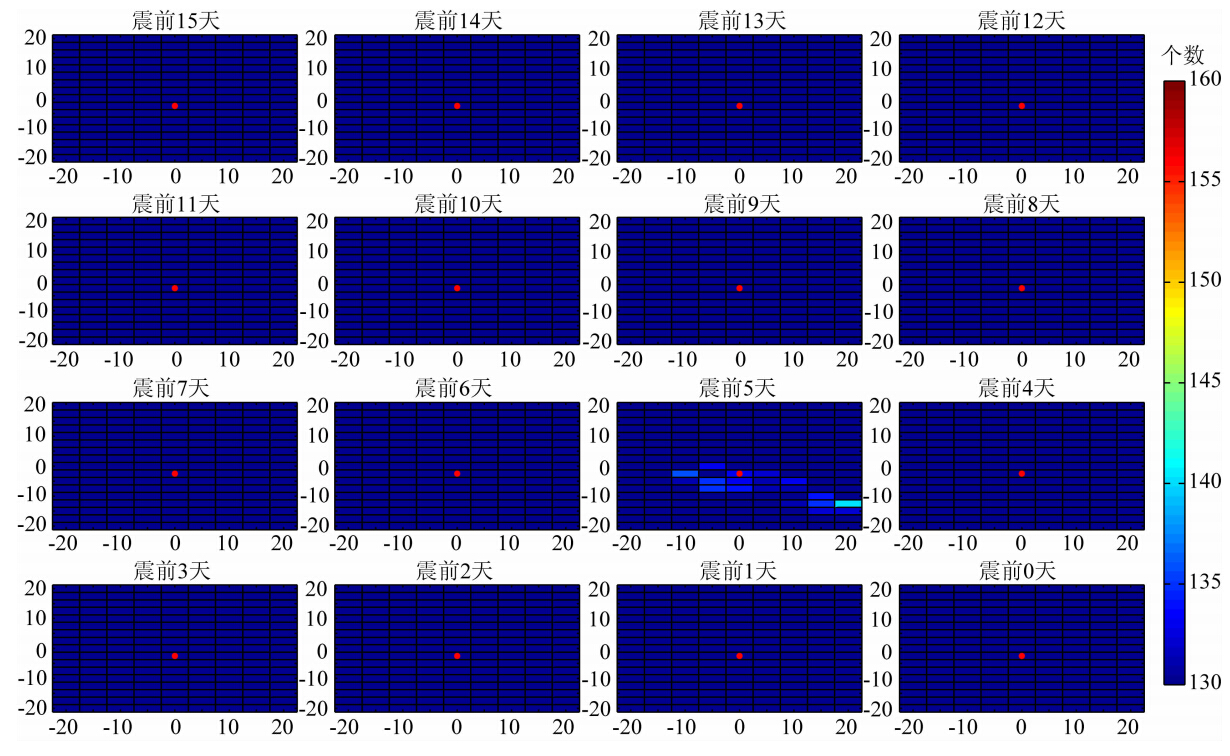 | 图 7 震前0—15天震中附近±20°范围负异常空间分布图Fig. 7 ±20° spatial distribution of negative abnormities from 0 to 15 days prior to earthquakes |
(2)将研究区域扩大为震中±10°,并将正负异常差异较大的3—5天作为整体进行分析,研究结果表明无论是正异常还是负异常均是震中南侧高于北侧,并且正异常在东南方向明显,负异常在西南方向明显,二者具有东西不对称性;
(3)按震中±10°、±20°、±30°不同空间尺度分析震前0—15天TEC变化,研究表明临震电离层异常最明显区域并不位于震中的正上空,而是向磁赤 道方向偏移,临震电离层异常空间影响尺度大约为±15°左右,空间分布中显示的离震中较远的北侧异常应于高纬扰动有关,离震中较远的东侧异常应与电离层的4波结构有关.其中,正异常在震前14天、10天震中西南方向出现不同程度的高值区,负异常在震前5天震中东南方向较明显.
 | 图 8震前0—15天震中附近±30°范围正异常空间分布图Fig. 8 ±30° spatial distribution of positive abnormities from 0 to 15 days prior to earthquakes |
 | 图 9 震前0—15天震中附近±30°范围负异常空间分布图Fig. 9 ±30° spatial distribution of negative abnormities from 0 to 15 days prior to earthquakes |
根据Takeuchi等(2006)研究表明,地震孕育过程中由于岩石应力积累,如果地震断层带的岩石为P型半导体,则在地表形成一组带正电的空穴,从而在大气中形成垂直向上的静电场,使电离层底部聚集带负电的电子,电离层中产生垂直向下的扰动电场.如果是N型半导体,则刚好相反,电离层中产生垂直向上的电场.Kuo等(2011)研究认为,断层带附近的垂直电场会引起大气中的电流,在 电离层底部(85 km)电流将转化为向外的水平电场.
按照上述电场理论,扰动应发生在震中的正上空附近,但为何我们观测到的临震电离层扰动都会向磁赤道方向偏移呢?孕震区产生的附加电场叠加到电离层是在最底部,此处电子密度较低对TEC的贡献不大,但随着附加电场沿磁力线映射到F2层峰值高度后,会对该处的TEC造成变化.因此如果临震震中附近形成异常电场,按照电场的地震-电离层耦合机制扰动会偏向磁赤道.
此外,V = E × B / B 2,B 为地球磁场,其方向从南至北,因此电子向什么方向运动,完全取决于扰动电场 E 的方向.在电离层中,如果为向上的电场,电子将向西运动,使得西南方向的电子密度增加,本研究中震前14天、10天正异常就是位于西南方向.如果为向下的电场,电子将向东运动,使得东南方向的电子密度增加,震中±10°范围内3—5天累加的正异常位于东南方向,欧阳新艳等(2008)利用法国DEMETER卫星观测普洱地震前电离层电子密度也是在东南方向有所升高.无论向西还是向东运动,电子都会向一侧聚集,另一侧减少,从而形成正负异常的东西不对称现象,正如3—5天的累加结果,正异常在东南方向明显,而负异常在西南方向明显.电离层中,如果为向东的水平电场,电子将向上运动,电离寿命变长,使得震中正南方向电子密度有所增加.如果为向西的电场,电子将向下运动,电离寿命变短,使得南侧电子密度有所降低.图 1的时序图中5个方位的扰动趋势较相似,我们将各个方向震前 0—15天每2 h数据全部累加(图 10),可以看出 无论是正异常还是负异常震中正南方向的值都高于其他4个方向,这说明39个地震前电离层中也有水平电场存在.
因此,不同方向的扰动电场,会在震中南、东南、西南方向形成不同的正负异常现象.不同区域的地震、不同类型的地震其孕震机理可能不同,同一个地震不同时期起主导作用的电场方向也有可能不同,从而在孕震区上空电离层中产生不同方向的扰动电场,因此怎样的孕震过程、何种的地震电离层耦合机理占主导作用等问题仍需要更多的观测、更多的地震事件进行不断的深入研究.
 | 图 10震中上空、东、南、西、北各方向正负异常个数统计图Fig. 10 Statistical numbers of positive and negative abnormities above the epicenter and eastern,southern, western and northern directions to the epicenter |
致谢作者衷心感谢JPL提供的全球GPS TEC数 据,同样感谢中国地震台网中心提供的中国地震目录.
| [1] | Chen Y I, Liu J Y, Tsai Y B, et al. 2004. Statistical tests for pre-earthquake ionospheric anomaly. Terrestrial Atmospheric and Oceanic Sciences, 15(3): 385-396. |
| [2] | Dautermann T, Calais E, Haase J, et al. 2007. Investigation of ionospheric electron content variations before earthquakes in southern California. J. Geophys. Res., 112(B2): B02106, doi: 10. 1029/2006JB004447. |
| [3] | Gokhberg M, Morgounov V, Yoshino T, et al. 1982. Experimental measurement of electromagnetic emissions possibly related to earthquakes in Japan. J. Geophys. Res. , 87(B9): 7824-7828. |
| [4] | Hayakawa M, Molchanov O A. 2002. Seismo Electromagnetics: Lithosphere-Atmosphere-Ionosphere Coupling. Tokyo: Terrapub. |
| [5] | Henderson S B, Swenson C M, Christensen A B, et al. 2005. Morphology of the equatorial anomaly a and equatorial plasma bubbles using image subspace analysis of Global Ultraviolet Imager data. J. Geophys. Res., 110 (A11): A11306, doi: 10. 1029/2005JA011080. |
| [6] | King C Y, Zhang W, King B S. 1993. Radon anomalies on three kinds of faults in California. Pure and Applied Geophysics, 141(1): 111-124. |
| [7] | Kon S, Nishihashi M, Hattori K. 2011. Ionospheric anomalies possibly associated with M≥60 Earthquakes in the Japan area during 1998-2010: case studies and statistical study. Journal of Asian Earth Sciences, 41(4-5): 410-420. |
| [8] | Kuo C L, Huba J D, Joyce G, et al. 2011. Ionosphere plasma bubbles and density variations induced by pre-earthquake rock currents and associated surface charges. J. Geophys. Res., 116(A10): A10317, doi: 10. 1029/2011JA016628. |
| [9] | Larkina V, Nalivayko A, Gershenzon N, et al. 1983. Observations of VLF emission related with seismic activity on the Interkosmos-19 satellite. Geomagn. Aeron, 23: 684-687. |
| [10] | Le H, Liu J Y, L Liu. 2011. A statistical analysis of ionospheric anomalies before 736 M6.0+ earthquakes during 2002-2010. J. Geophys. Res., 116(A2): A02303, doi: 10. 1029/2010JA015781. |
| [11] | Liperovskaya E, Parrot M, Bogdanov V, et al. 2006. On variations foF2 and F-spread before strong earthquakes in Japan. Nat. Hazards Earth Syst. Sci. , 6(5):735-739. |
| [12] | Liu J Y, Chen Y I, Pulinets S A, et al. 2000. Seismo-ionospheric signatures prior to M≥ 6.0 Taiwan earthquakes. Geophys. Res. Lett, 27(19): 3113-3116. |
| [13] | Liu J Y, Chen Y, Chuo Y, et al. 2001. Variations of ionospheric total electron content during the Chi-Chi earthquake. Geophys. Res. Lett. , 28(7): 1383-1386. |
| [14] | Liu J Y, Chen Y I, Chen C H, et al. 2009. Seismoionospheric GPS total electron content anomalies observed before the 12 May 2008 Mw7.9 Wenchuan earthquake. J. Geophys. Res., 114(A4): A04320, doi:10. 1029/2008JA013698. |
| [15] | Mannucci A J, Wilson B D, Yuan D N, et al. 1998. A global mapping technique for GPS-derived ionospheric total electron content measurements. Radio Science, 33(3): 565-582. |
| [16] | Molchanov O, Hayakawa M, Rafalsky V. 1995. Penetration characteristics of electromagnetic emissions from an underground seismic source into the atmosphere, ionosphere, and magnetosphere. J. Geophys. Res. , 100(A2): 1691-1712. |
| [17] | Molchanov O, Fedorov E, Schekotov A, et al. 2004. Lithosphere-atmosphere-ionosphere coupling as governing mechanism for preseismic short-term events in atmosphere and ionosphere. Nat. Hazards Earth Syst. Sci. , 4(5-6): 757-767. |
| [18] | Otsuka Y, Shiokawa K, Ogawa T. 2006. Equatorial ionospheric scintillations and zonal irregularity drifts observed with closely-spaced GPS receivers in Indonesia. Journal of the Meteorological Society of Japan, 84: 343-351. |
| [19] | Ouyang X Y, Zhang X M, Shen X H, et al. 2008. Study on ionospheric Ne disturbances before 2007 Pu'er, Yunnan of China, earthquake. Acta Seismologica Sinica (in Chinese), 30(4): 424-436. |
| [20] | Parrot M, Berthelier J J, Lebreton J P, et al. 2006. Examples of unusual ionospheric observations made by the DEMETER satellite over seismic regions. Physics and Chemistry of the Earth, 31(4-9): 486-495. |
| [21] | Pulinets S A, Boyarchuk K A, Hegai V V, et al. 2000. Quasielectrostatic model of atmosphere-thermosphere-ionosphere coupling. Advances in Space Research, 26(8): 1209-1218. |
| [22] | Pulinets S A, Contreras A L, Bisiacchi-Giraldi G, et al. 2005. Total electron content variations in the ionosphere before the Colima, Mexico, earthquake of 21 January 2003. Geofisica Internacional-Mexico, 44(4): 369-377. |
| [23] | Sagawa E, Immel T J, Frey H U, et al. 2005. Longitudinal structure of the equatorial anomaly in the nighttime ionosphere observed by IMAGE/FUV. J. Geophys. Res., 110(A11): A11302, doi: 10. 1029/2004JA010848. |
| [24] | Shalimov S, Gokhberg M. 1998. Lithosphere-ionosphere coupling mechanism and its application to the earthquake in Iran on June 20, 1990. A review of ionospheric measurements and basic assumptions. Physics of the Earth and Planetary Interiors, 105(3-4): 211-218. |
| [25] | Sorokin V M, Yaschenko A K, Chmyrev V M, et al. 2005. DC electric field amplification in the mid-latitude ionosphere over seismically active faults. Nat. Hazards Earth Syst. Sci. , 5(5): 661-666. |
| [26] | Takeuchi A, Lau B W S, Freund F T. 2006. Current and surface potential induced by stress-activated positive holes in igneous rocks. Physics and Chemistry of the Earth, 31(4-9): 240-247. |
| [27] | Utkin V, Yurkov A. 1998. The dynamics of radon liberation from a rock massif as a Short-Term earthquake forerunner. Doklady Earth Sciences, 359: 262-266. |
| [28] | Wan W, Liu L, Pi X, et al. 2008. Wavenumber-4 patterns of the total electron content over the low latitude ionosphere. Geophys. Res. Lett., 35(L12): L12104, doi: 10. 1029/2008GL033755. |
| [29] | Wilson B, Mannucci A, Edwards C, et al. 1992. Global ionospheric maps using a global network of GPS receivers. URSI Beacon Satellite Symposium, Cambridge. |
| [30] | Zeren Z M, Shen X H, Cao J B, et al. 2012. Statistical analysis of ELF/VLF magnetic field disturbances before major earthquakes. Chinese Journal of Geophysics (in Chinese), 55(11): 3699-3708. |
| [31] | Zhang X M, Shen X H, Parrot M, et al. 2012. Phenomena of electrostatic perturbations before strong earthquakes (2005-2010) observed on DEMETER. Nat. Hazards Earth Syst. Sci. , 12(1): 75-83. |
| [32] | Zhang X M, Shen X H, Zhao S F, et al. 2014. The characteristics of quasistatic electric field perturbations observed by DEMETER satellite before large earthquakes. Journal of Asian Earth Sciences, 79: 42-52. |
| [33] | Zhao B Q, Wang M, Yu T, et al. 2008. Is an unusual large enhancement of ionospheric electron density linked with the 2008 great Wenchuan earthquake? J. Geophys. Res., 113(A11): A11304, doi: 10.1029/2008JA013613. |
| [33] | 欧阳新艳, 张学民, 申旭辉等. 2008. 普洱地震前电离层电子密度扰动变化研究. 地震学报, 30(4): 424-436.. |
| [33] | 泽仁志玛, 申旭辉, 曹晋滨等. 2012. 强震前 ELF/VLF 磁场的扰动特征统计研究. 地球物理学报, 55(11): 3699-3708.. |
 2014, Vol. 57


