2. 中国科学院大学, 北京 100049;
3. 中海油研究总院, 北京 100027
2. University of Chinese Academy of Sciences, Beijing 100049, China;
3. CNOOC Research Institute, Beijing 100027, China
珠江口盆地是中国南海北部最大的中新生代沉积盆地,由于其良好的油气资源前景而备受关注,2006珠江口盆地白云凹陷荔湾3-1深水扇气田的重大发现拉开了我国深水油气勘探的序幕.珠江口盆地地热研究始于20世纪70年代.汪缉安等(1995)用古温标数据Ro对珠江口盆地珠Ⅲ坳陷的古地温梯度进行了研究,认为珠Ⅲ坳陷新生代以来的地温有一个逐渐降低并在近期有所回升的趋势.前人也分析了珠江口盆地深部地热特征,计算了莫霍面的温度,研究了岩石圈的热结构与热流变学结构(张健和汪集旸,2000;张健等,2005; Shi et al., 2002).为了研究南海的起源、演化历史、大地构造属性及其形成的地球动力学背景,前人获得了大量钻井和海底探针地热资料(Jessop et al., 1976; Watanable et al., 1977; Anderson et al., 1978; Taylor and Hayes, 1983; Ru and Pigott, 1986; 陈墨香等,1991; 饶春涛和李平鲁,1991; Nissen et al., 1995; Qian et al., 1995; Xia et al., 1995; Shyu et al., 1998).He等(2001)对南海地区已发表的热流数据进行了系统收集、整理、分析,利用589个大地热流数据编制了南海大地热流图.Shi等(2003)收集整理了南海地区592个热流数据,并进行了系统分析,研究了南海地区大地热流在平面上各构造单元的分布特征.米立军等(2009)首次研究了南海北部深水区地热特征及其成因,并提出南海北部深水区地温梯度为2.94~5.22℃/hm,平均为 3.91±0.74 ℃/hm;大地热流值为24.2~121 mW·m-2,平均为77.5±14.8 mW·m-2.前人在该盆地现今地温场研究方面做了大量工作,但绝大部分温度数据都来自于该盆地浅水区(饶春涛和李平鲁,1991; 米立军等,2009; Yuan et al., 2009),深水区钻井温度数据十分稀少.
本文收集了该盆地深水区的最新钻井测温资料并新增计算了19个大地热流数据,丰富了深水区钻井地热数据,更好地控制了该盆地地热分布特征,对盆地动力学研究和油气资源评价具有重要意义.另外,研究表明珠江口盆地大地热流从陆架到陆坡逐渐增大,主控因素为岩石圈厚度减薄(Shi et al., 2003; 袁玉松,2007; 米立军等,2009).大地热流与热岩石圈厚度之间到底存在什么样的关系?本文基于盆地36口钻井资料,从定性到定量分析了这两者间的关系.
2 地质背景南海北部大陆边缘东北部珠江口盆地,处于欧亚、印度—澳大利亚和太平洋及菲律宾海板块相互作用且靠近菲律宾板块的特殊构造位置,是在复杂基底上发育起来的被动大陆边缘盆地,其构造格局具有“东西分块、南北分带”特征.自北而南由北部断阶带、北部坳陷带,中部隆起带、南部坳陷带及南部隆起带组成“三隆两坳”(龚再升等,1997)(图 1).珠江口盆地深水区主要位于珠Ⅱ坳陷内,包括白云凹陷、荔湾凹陷、开平凹陷和顺德凹陷,其中顺德凹陷又被中间的低凸起分为顺德北凹和顺德南凹.坳陷北部以番禺低隆起和神狐隆起与珠Ⅰ和珠Ⅲ坳陷相隔,南部以南部隆起为界,东部与东沙隆起相邻,西部以神狐隆起为界.
珠江口盆地新生代区域构造演化主要受华南板块与印支板块碰撞、太平洋及菲律宾海板块俯冲挤压和南海扩张等三大主控因素制约和影响,主要经历了晚白垩世—早渐新世多幕断陷裂谷阶段、晚渐新世—早中新世裂后断坳转换及区域热沉降阶段和晚中新世以来新构造运动及热沉降坳陷阶段等三大构造演化阶段(Ru and Pigott, 1986; 李平鲁,1993; 张功成,2010).
珠江口盆地多幕断陷裂谷作用始于晚白垩世,其发育演化历程先后经历了3幕断陷裂谷演化阶段(裂陷发育期),即晚白垩世初始断陷裂谷阶段、始新世断陷裂谷鼎盛阶段和早渐新世晚期断陷裂谷阶段.在此期间发生了神弧运动、珠琼运动一幕及珠琼运动二幕3 次构造运动(李平鲁,1993).晚渐新世—早中新世,受印度板块与欧亚板块碰撞的影响,深部地幔流向SE和SSE 方向蠕散(Tapponnier et al., 1986).由于地幔物质的过剩堆积导致上地幔发生强烈隆升、岩石圈进一步被拉伸减薄,盆地进入了裂后断坳转换及热沉降阶段.晚渐新世该区发生了大规模的海底扩张(张裂)即南海运动,形成了南海北部地区区域性破裂不整合面.晚中新世以来,菲律宾板块向NNW 方向俯冲推挤,台湾地体与东海陆架碰撞拼贴,东沙运动即新构造运动开始(Sibuet et al., 2002),盆地伴随着断块升降、隆起剥蚀、挤压褶皱和断裂及岩浆等活动.
珠江口盆地介于陆架-陆坡减薄过渡带,多幕拉张、裂陷使得其地壳厚度向洋盆方向递减.南海北部地壳结构研究经历了20世纪70年代的声纳浮标、80年代的双船扩展排列地震(EPS)和90年代海底地震仪探测(OBS或OBH)几个阶段(丘学林等,2003).中美南海海洋地质科学联合调查项目的地震声纳浮标、双船扩展排列地震资料通过南海北部陆缘东部、中部和西部的三条EPS断面为研究珠江口盆地地壳结构特征提供了宝贵的数据.该盆地地壳厚度横向变化显著,东部由东沙隆起至洋-陆边界,上地幔逐渐抬升,下地壳逐渐减薄,地壳厚度由32 km减薄到12 km;中部由珠Ⅱ坳陷到洋-陆边界地壳逐渐减薄,地壳由27 km减薄到18 km;在西部,珠Ⅲ坳陷和西沙海槽地壳显著减薄,地壳厚度分别为23 km和14 km(姚伯初,1998).
3 大地热流大地热流是表征由地球内部向地表传输并在单
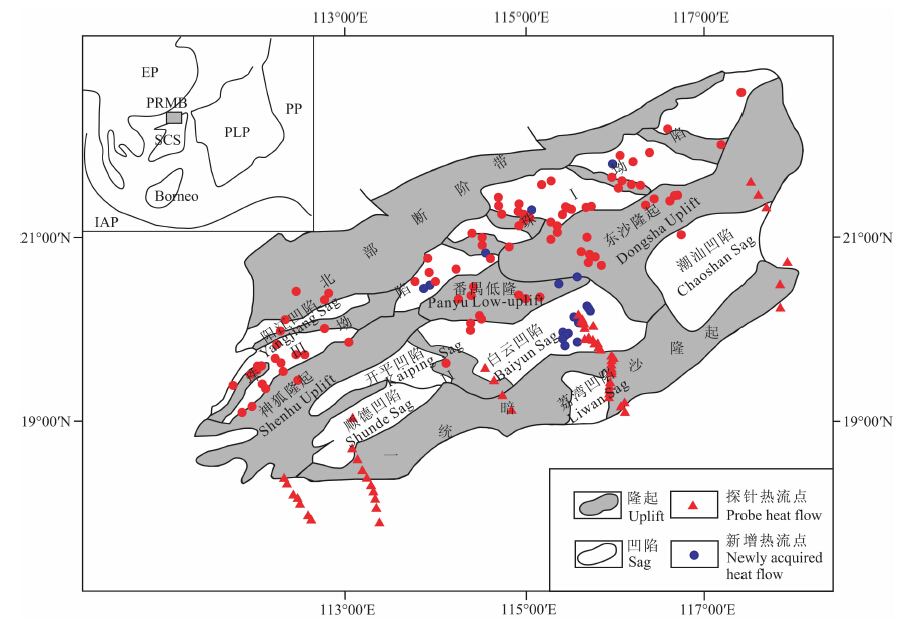
 | 图 1 珠江口盆地构造区划及大地热流点分布图EP—欧亚板块(Eurasian Plate),PP—太平洋板块(Pacific Plate),PLP—菲律宾板块(Philippine Plate),IAP—印—澳板块(India-Australian Plate),SCS—南海(South China Sea),PRMB—珠江口盆地(Pearl River Mouth Basin)Fig. 1 Structural division and heat flow distribution of the Pearl River Mouth Basin |
位面积上散发的热量,它是地球内部的各种动力学过程的能量平衡在地表最直接的反映,在数值上,大地热流值等于地温梯度与地层热导率之积:

式中,q为大地热流(或称地表热流)值,mW·m-2;k为热导率,W/(m·K);dT/dZ为地温梯度,℃/km; 负号表示热流方向与地温梯度方向相反.可以看出,大地热流数据质量取决于地温资料质量和岩石热导率的测试精度.
3.1 地温资料常见的地温数据可分为钻孔系统连续测温、地层试油温度(DST)、孔底温度(BHT)等.上述各类温度数据中,系统连续测温数据和试油静温数据比较可靠,它们构成了盆地地温场研究的主要数据.其他测井温度数据(如BHT等)由于静井时间不够,虽不能直接用,但经校正后仍可作为参考.
海上盆地的地温数据不同于陆盆,很少有系统的钻井测温数据.本文新增计算19口钻井温度数据除HZ25-7-2井为BHT,其他井温度数据类型均为地层压力测量时的温度数据(MDT),其测试原理跟DST类似,属于可靠温度数据类型.HZ25-7-2的BHT数据采用Waples等(2004)的方法进行校正,校正前后的温度见图 2a.
对于温度数据较连续的钻井,采用最小二乘法拟合得到地温梯度数据(图 2b).对于温度数据较少的钻井,则采用(2)式来计算地温梯度.

当800 m>水深>100 m时,平均海底温度: T0=-8.7946×lnZ0+62.958;当水深大于800 m时,海底温度取4.2~2.0 ℃(袁玉松,2007).
3.2 热导率岩石热导率表示岩石传热的特性,其物理意义为:沿热传导方向在单位厚度岩石两侧的温度差为1 ℃时单位时间内所通过的比热流量,单位为W/(m·K).研究区内的热导率数据丰富(饶春涛和李平鲁, 1990,1991; Yuan et al., 2009),单竞男(2011)测试并校正了大量珠江口盆地岩芯样品的岩石热导率数据,在此基础上建立了盆地岩石热导率系列柱(见表 1),为本文的热流计算提供了基础资料.由于在珠江口盆地钻井地层分层和地震解释成果中,N2与Q的界限往往没有划分,且它们的岩芯样 品非常有限.因此,N2-Q的平均热导率很难精确获得,考虑第四纪海底沉积物固结性差,热导率较低,但随深度增加,未固结成岩的沉积物(粉砂质粘土)在埋深50 m左右时的热导率可达 1.6~1.8 W/(m·K),综合海底沉积物、未固结成岩沉积物和N2泥岩 的实测热导率,将N2-Q的平均热导率取值为2.0 W/(m·K)(袁玉松,2007).
 | 图 2 钻孔温度-深度分布曲线a)HZ25-7-2井校正前后BHT-深度曲线,虚线代表校正后的温度-深度曲线.(b)钻孔温度-深度分布曲线. 1—LH34-3-1;2—LW3-1-2;3—LW3-1-3;4—LW9-1-1;5—EP23-7-1;6—EP24-2-1;7—HZ25-7-2;8—HZ25-8-2;9—LF7-1-1;10—PY10-4-1.Fig. 2 Borehole temperature change with depth in the Pearl River Mouth Basin(a)shows the BHT change with depth before and after correction,the dash line represents the post-correction BHT.(b)shows the temperature-depth curve of 10 boreholes,of which the geothermal gradients were regressed by the least square method. |
| | 表 1 珠江口盆地岩石热导率系列柱,修改自单竞男(2011) Table 1 Thermal conductivity data of different formation in Pearl River Mouth Basin,revised from Shan.(2011) |
3.3 热流值及分布特征
根据地温梯度与对应的岩石热导率,可以方便地计算出钻孔的大地热流(见表 2).计算大地热流时,尽可能采用与钻孔测温深度对应的热导率,如果该钻孔无岩芯或岩芯不全,则参考表 1数据,然后根据钻孔层厚、岩性计算测温段的调和平均岩石热导率.
经统计,位于研究区的大地热流资料共193个,其中钻井热流121个,探针热流72个,热流点分布见图 1.大地热流值介于24.2~121.0 mW·m-2之间,平均71.8±13.6 mW·m-2,新增盆地深水区钻井平均热流值高达84.5±4.4 mW·m-2,远高于中 国大陆地区大地热流平均值(63.0±24.2 mW·m-2(胡圣标等,2001)),也高于中国近海其他盆地:东 海盆地台北坳陷的热流值为59.5~81.3 mW·m-2,平均为70.4 mW·m-2,西湖坳陷的热流值为55.3~84.3 mW·m-2,平均为71.7 mW·m-2(Yang et al., 2004);南黄海盆地南部地区热流值为60.1~76.8 mW·m-2,平均为67.7 mW·m-2(杨树春等,2003).根据盆地热流数据,按克里格插值法绘制了珠江口盆地大地热流分布图(图 3).可以看出,该盆地大地热流在平面上具有两个显著的分布特征:总体上,从北到南(从陆架到陆坡方向)大地热流具有逐渐增高的趋势;存在阳江凹陷和顺德凹陷两个高值异常区.
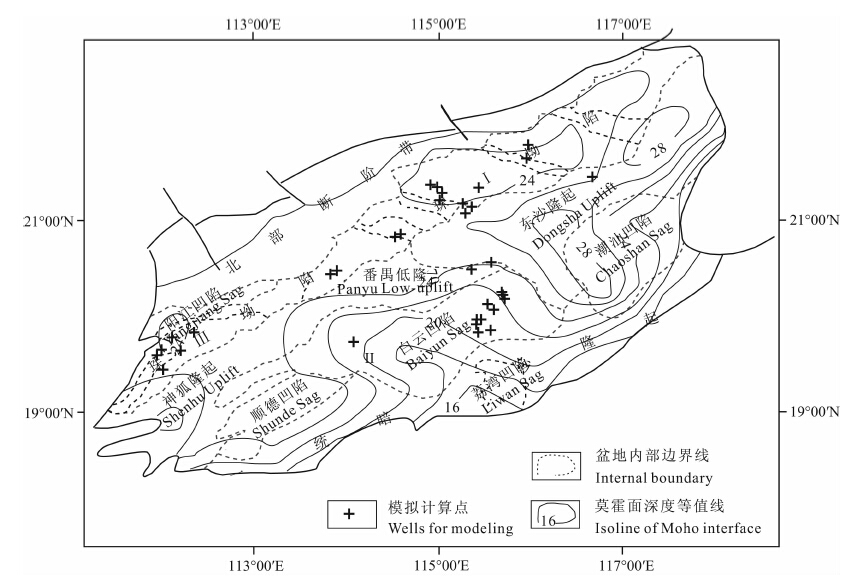
4 热岩石圈厚度将整个热岩石圈分成上地壳10 km、剩余地壳、岩石圈地幔三个部分(Shi et al., 2002).为了获得每个井位处的地壳厚度值,本文参考该盆地的莫霍面深度1)(图 4),在此基础上减去每口井的沉积层厚度便可获得该点处对应的地壳厚度.岩石圈地幔厚度无法直接获得,本文运用Genesis软件,通过求解一维热传导方程计算得到每个井位处的岩石圈地幔厚度.
1)中国地质调查局,国家海洋局科学技术司.2004.海洋地质地球物理补充调查及矿产资源评价.“我国专属经济区和大陆架勘察”专项HY126-03项目综合报告.北京:海洋出版社. 4.1 计算方法与参数计算过程中,固定热岩石圈底部温度为1330 ℃,不断改变每个井位点处的岩石圈地幔厚度,从而获得温度随深度的分布,并用钻井实际温度数据对计算结果进行拟合.
考虑放射性生热时的一维稳态热传导方程为:

当生热率呈指数分布时,温度的解析解为:

| | 表 2 热岩石圈厚度计算所用井位 Table 2 Wells for lithosphere thickness calculation,wells with * at the upper right corner represent the wells with newly acquired heat flow data in this paper,other wells with heat flow and thermal conductivity data quoted from Yuan et al., 2007 |
 | 图 4 莫霍面深度等值线及模拟计算井位分布,修改自“我国专属经济区和大陆架勘察”专项HY126-03项目综合报告1) Fig. 4 Contour map of Moho interface in the Pearl River Mouth Basin,revised from the comprehensive report on project HY126-03,Specific Exploration Projects of Chinese Exclusive Economic Zone and Continental Shelf1) |
ermák(1989)认为在地壳上部,破裂、水动力等作用常常导致生热元素重新分布,并给出了估算 盆地基底以及地壳上部10 km深度范围内的生热 率分布经验关系.地壳生热率的估算采用 ermák和Bodri(1991)的处理方法.岩石圈地幔生热效应很 少,计算中没有考虑其生热.沉积层热导率由Genesis 软件根据每口井不同层位岩性比例计算而得,其他计算参数如表 3(张健等,2005; 高翔等,2012).
| | 表 3 计算参数 Table 3 Parameters for calculation |
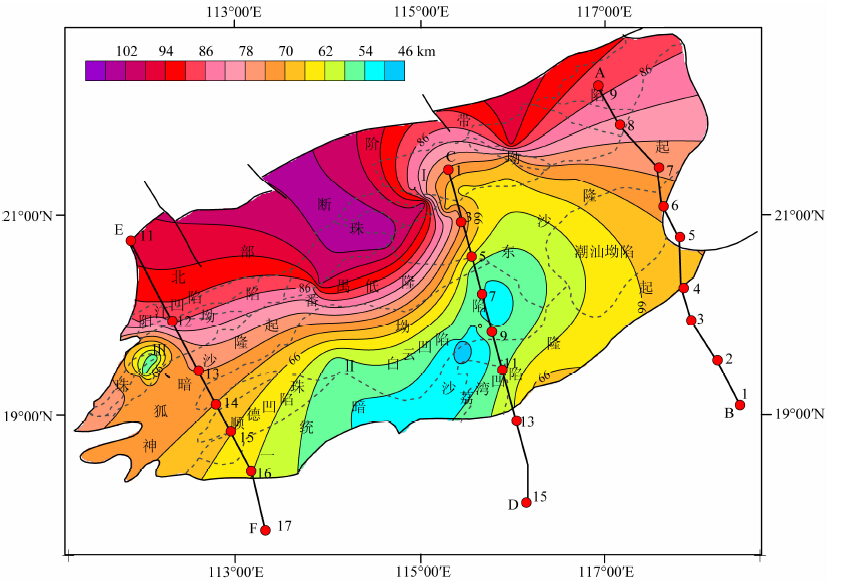
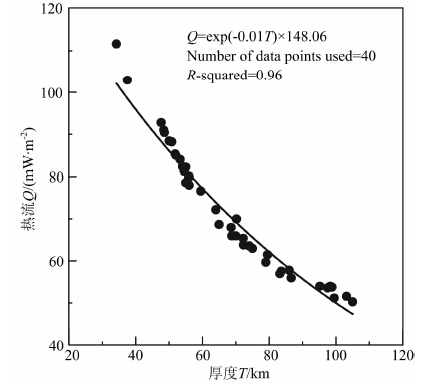
已知每个井位点处的地壳厚度以及岩石圈地幔厚度,便可确定其热岩石圈厚度.结果表明,珠江口盆地的热岩石圈厚度介于47.6~105 km之间(表 2).运用这些数值,绘制了珠江口盆地热岩石圈厚度等值线分布图(图 5),可见珠江口盆地热岩石圈厚度分布与大地热流分布趋势相反,即由陆架区向陆坡区减薄,且二者间存在良好的指数相关性(图 6).值得注意的是,由于计算数据点分布不均,图 5只能反映珠江口盆地热岩石圈厚度分布的总体趋势,并不能完全代表其真实状况.
5 讨论与结论珠江口盆地自新生代以来经历了多次拉张过程,岩石圈减薄,热流升高,早中新世(23.3 Ma)以后,盆地进入热沉降阶段(董冬冬等,2008; 宋洋等,2011).由于深部应力场进行调整(Tapponnier et al., 1986; Zoback et al., 1989),晚中新世至上新世,南海及其邻区发生了新构造运动,这次新构造运动波及范围很广,在珠江口盆地表现为东沙运动(李平鲁,1993).盆地进入“再活动阶段”的新构造期,断层、岩浆活动较为强烈,在拉张热背景之下形成附加热流.总体来说,岩石圈拉张减薄控制了珠江口盆地的整体热流分布,岩浆与断裂等活动导致了珠江口盆地局部高热流异常,这些因素共同造就了盆地热属性.珠江口盆地大地热流值介于24.2~ 121.0 mW·m-2,平均71.8±13.6 mW·m-2,属于典型的“热盆”.
 | 图 3 珠江口盆地大地热流分布图Fig. 3 Heat flow trend contour map of the Pearl River Mouth Basin |
 | 图 5 珠江口盆地热岩石圈厚度分布图AB、EF分别为中美合作东部剖面和中美合作西部剖面,剖面上的红点及数字为扩展排列地震剖面中心位置及编号;CD是中日合作剖面,剖面上的红点及数字为海底地震仪位置及其编号(施小斌等,2000).Fig. 5 Contour map of lithosphere thickness in the Pearl River Mouth BasinAB、EF、CD represent the profiles for thermal lithosphere thickness calculation in Shi et al.(2000). Circles and numbers along Profile AB、 EF show the positions of the Exp and ing Spread Profile(ESP)midpoints and their serial numbers;Circles and numbers along Profile CD mark the positions of the Ocean Bottom Station(OBS) and their serial numbers. |
 | 图 6 珠江口盆地大地热流与热岩石圈厚度关系Fig. 6 Relationship between heat flow and lithosphere thickness of the Pearl River Mouth Basin |
施小斌等(2000)计算了珠江口盆地三条深部地震剖面的岩石圈热结构,利用玄武岩固相线获得“热”岩石圈厚度(剖面位置见图 5).结果表明:沿剖面AB,“热”岩石圈厚度由陆架区(点9、8)约88 km往上陆坡(点7、6、5)方向逐渐减薄,在下陆坡(点3、2)减薄至约64~67 km.沿剖面CD,“热”岩石圈厚度在大陆架区达96 km,往陆坡方向逐渐减薄,在洋壳区减薄至62 km左右.沿剖面EF“热”岩石圈厚度在大陆架区(点11、12、13)达86 km,往陆坡方向逐渐减薄,在西沙海槽(点16)处减薄为60 km.本文计算的热岩石圈厚度结果与其大致相同.
文章中通过求解一维热传导方程量化了珠江口盆地区域整体热岩石圈厚度与大地热流的关系,但这种相关性不适用于岩浆以及断裂活动等区域.总体上来看,珠江口盆地从陆架区到陆坡区大地热流增高,热岩石圈厚度减薄,这两者存在良好的指数相关性.
致谢本文在收集基础资料的过程中得到了中海油研究总院以及中海石油(中国)有限公司深圳分公司的大力协助,在此表示衷心感谢!
| [1] | Anderson R N, Langseth M G, Hayes D E, et al. 1978. Heat flow, thermal conductivity, geothermal gradient.//Hayes D E ed. A Geophysical Atlas of the East and Southeast Asian Seas. Boulder, CO: Geological Society of America. |
| [2] | ermák V, Bodri L. 1991. A heat production model of the crust and upper mantle. Tectonophysics, 194(4): 307-323. |
| [3] | ermák V. 1989. Crustal heat production and mantle heat flow in Central and Eastern Europe. Tectonophysics, 159(3-4): 195-215. |
| [4] | Chen M X, Xia S G, Yang S Z. 1991. Local geothermal anomalies and their formation mechanisms on Leizhou peninsula, South China. Scientia Geologica Sinica (in Chinese), 26(4): 369-383. |
| [5] | Dong D D, Wu S G, Zhang G C, et al. 2008. Rifting process and formation mechanisms of syn-rift stage prolongation in the deepwater basin, northern South China Sea. Chinese Science Bulletin, 53(23): 3715-3725. |
| [6] | Gao X, Zhang J, Sun Y J, et al. 2012. A simulation study on the thermal structure of Manila trench subduction zone. Chinese Journal of Geophysics (in Chinese), 55(1): 117-125. |
| [7] | Gong Z S, Li S T, Xie T J, et al. 1997. Dynamic Research of Oil and Gas Accumulation in Northern Marginal Basions of South China Sea (in Chinese). Beijing: Science Press. |
| [8] | He L J, Wang K L, Xiong L P, et al. 2001. Heat flow and thermal history of the South China Sea. Physics of the Earth and Planetary Interiors, 126(3-4): 211-220. |
| [9] | Hu S B, He L J, Wang J Y. 2001. Compilation of heat flow data in the China continental area (3rd edition). Chinese Journal of Geophysics (in Chinese), 44(5): 611-626. |
| [10] | Jessop A M, Hobart M A, Sclater J G. 1976. The world heat-flow data collection-1975. Geothermal Series Number 5. Canada: Earth Physics Branch, 5: 125. |
| [11] | Li P L. 1993. Cenozoic tectonic movement in the Pearl River Mouth Basin. China Offshore Oil and Gas (Geology) (in Chinese), 7(6): 11-17. |
| [12] | Mi L J, Yuan Y S, Zhang G C, et al. 2009. Characteristics and genesis of geothermal field in deep-water area of the northern South China Sea. Acta Petrolei Sinica (in Chinese), 30(1): 27-32. |
| [13] | Nissen S S, Hayes D E, Bochu Y, et al. 1995. Gravity, heat flow, and seismic constraints on the processes of crustal extension: Northern margin of the South China Sea. Journal of Geophysical Research, 100(B11): 22447-22483. |
| [14] | Qian Y P, Niu X P, Yao B C, et al. 1995. Geothermal pattern beneath the continental margin in the northern part of the South China Sea. CCOP/TB, 25: 89-104. |
| [15] | Qiu X L, Shi X B, Yan P, et al. 2003. New progresses in study and sounding seismic exploration on crustal structure in northern South China Sea. Progress in Natural Science (in Chinese), 13(3): 231-236. |
| [16] | Rao C T, Li P L. 1990. Petroleum geology research report in the eastern Pearl River Mouth Basin (in Chinese). Research Center of the Eastern SCS Branch, CNOOC, 223-243. |
| [17] | Rao C T, Li P L. 1991. Study of heat flow in Pearl River Mouth Basin. China Offshore Oil and Gas (Geology) (in Chinese), 5(6): 7-18. |
| [18] | Ru K, Pigott J D. 1986. Episodic rifting and subsidence in the South China Sea. AAPG Bulletin, 70(9): 1136-1155. |
| [19] | Shan J N. 2011. Thermla regime and source rock maturation history in deepwater area, the northern margin of the South China Sea (in Chinese). Beijing: Institute of Geology and Geophysics, Chinese Academy of Sciences. |
| [20] | Shi X B, Zhou D, Zhang Y X. 2000. Lithospheric thermal-rheological structures of the continental margin in the northern South China Sea. Chinese Science Bulletin, 45(22): 2107-2112. |
| [21] | Shi X B, Zhou D, Qiu X L, et al. 2002. Thermal and rheological structures of the Xisha Trough, South China Sea. Tectonophysics, 351(4): 285-300. |
| [22] | Shi X B, Qiu X L, Xia K Y, et al. 2003. Characteristics of surface heat flow in the South China Sea. Journal of Asian Earth Sciences, 22(3): 265-277. |
| [23] | Shyu C T, Hsu S K, Liu C S. 1998. Heat flows off southwest Taiwan: Measurements over mud diapirs and estimated from bottom simulating reflectors. Terrestrial Atmospheric and Oceanic Sciences, 9(4): 795-812. |
| [24] | Sibuet J C, Hsu S K, Le Pichon X, et al. 2002. East Asia plate tectonics since 15 Ma: constraints from the Taiwan region. Tectonophysics, 344(1-2): 103-134. |
| [25] | Song Y, Zhang C Y, Zhang G C, et al. 2011. Research on tectono-thermal modeling for Qiongdongnan Basin and Pearl River Mouth Basin in the northern South China Sea. Chinese Journal of Geophysics (in Chinese), 54(12): 3057-3069. |
| [26] | Tapponnier P, Peltzer G, Armijo R. 1986. On the mechanics of the collision between India and Asia. Geological Society, London, Special Publications, 19: 115-157. |
| [27] | Taylor B, Hayes D E. 1983. Origin and history of the South China basin.//Hayes D E. The Tectonic and Geologic Evolution of South Eastern Asia Seas and Islands. Geophys. Monogr. Ser. 27. Washington D. C., AGU, 23-56. |
| [28] | Wang J A, Deng X, Chen M X, et al. 1995. Analysis on cenozoic thermal history and its features in west sector shelf of northern South China Sea. Scientia Geologica Sinica (in Chinese), 30(3): 220-232. |
| [29] | Waples D W, Pacheco J, Vera A. 2004. A method for correcting log-derived temperatures in deep wells, calibrated in the Gulf of Mexico. Petroleum Geoscience, 10(3): 239-245. |
| [30] | Watanable T, Langseth M G, Anderson R N. 1977. Heat flow in back-arc basins of the western Pacific.//Talwani M, Pitman W C eds. Island Arcs, Deep Sea Trenches and Back-Arc Basins. Washington, D C: AGU, 137-167. |
| [31] | Xia K Y, Xia S G, Chen Z R, et al. 1995. Geothermal characteristics of the South China Sea.//Gupta M L, Yamano M eds. Terrestrial Heat Flow and Geothermal Energy in Asia. Science Publishers, 113-128. |
| [32] | Yang S C, Hu S B, Cai D S, et al. 2003. Geothermal characteristics and tectonothermal evolution of the southern area of South Yellow Sea. Chinese Science Bulletin (in Chinese), 48(14): 1564-1569. |
| [33] | Yang S C, Hu S B, Cai D S, et al. 2004. Present-day heat flow, thermal history and tectonic subsidence of the East China Sea Basin. Marine and Petroleum Geology, 21(9): 1095-1105. |
| [34] | Yao B C. 1998. Crust structure of the northern margin of the South China Sea and its tectonic significance. Marine Geology & Quaternary Geology (in Chinese), 18(2): 1-16. |
| [35] | Yuan Y S. 2007. Tectono-thermal evolution and source rock maturation history in deepwater area in the northern margin of the South China Sea (in Chinese). Beijing: Institute of Geology and Geophysics, Chinese Academy of Sciences. |
| [36] | Yuan Y S, Zhu W L, Mi L J, et al. 2009. "Uniform geothermal gradient" and heat flow in the Qiongdongnan and Pearl River Mouth Basins of the South China Sea. Marine and Petroleum Geology, 26(7): 1152-1162. |
| [37] | Zhang G C. 2010. Tectonic evolution of deepwater area of northern continental margin in South China Sea. Acta Petrolei Sinica (in Chinese), 31(4): 528-533, 541. |
| [38] | Zhang J, Song H B, Li J B. 2005. Thermal modeling of the tectonic evolution of the southwest subbasin in the South China Sea. Chinese Journal of Geophysics (in Chinese), 48(6): 1357-1365. |
| [39] | Zhang J, Wang J Y. 2000. The deep thermal characteristic of continental margin of the northern South China Sea. Chinese Science Bulletin, 45(18): 1717-1722. |
| [40] | Zoback M L, Zoback M D, Adams J, et al. 1989. Global patterns of tectonic stress. Nature, 341(6240): 291-298. |
| [41] | 陈墨香, 夏斯高, 杨淑贞. 1991. 雷州半岛局部地热异常及其形成机制. 地质科学, 26(4): 369-383. |
| [42] | 董冬冬, 吴时国, 张功成等. 2008. 南海北部深水盆地的裂陷过程及裂陷期延迟机制探讨. 科学通报, 53(19): 2342-2351. |
| [43] | 高翔, 张健, 孙玉军等. 2012. 马尼拉海沟俯冲带热结构的模拟研究. 地球物理学报, 55(1): 117-125. |
| [44] | 龚再升, 李思田, 谢泰俊等. 1997. 南海北部大陆边缘盆地分析与油气聚集. 北京: 科学出版社. |
| [45] | 胡圣标, 何丽娟, 汪集旸. 2001. 中国大陆地区大地热流数据汇编(第三版). 地球物理学报, 44(5): 611-626. |
| [46] | 李平鲁. 1993. 珠江口盆地新生代构造运动. 中国海上油气(地质), 7(6): 11-17. |
| [47] | 米立军, 袁玉松, 张功成等. 2009. 南海北部深水区地热特征及其成因. 石油学报, 30(1): 27-32. |
| [48] | 丘学林, 施小斌, 阎贫等. 2003. 南海北部地壳结构的深地震探测和研究新进展. 自然科学进展, 13(3): 231-236. |
| [49] | 饶春涛, 李平鲁. 1990. 珠江口盆地断层特征及其封闭性研究. 珠江口盆地(东部) 石油地质科研报告集(第6集). 中国海洋石油南海东部公司科技研究中心, 223-243. |
| [50] | 饶春涛, 李平鲁. 1991. 珠江口盆地热流研究. 中国海上油气(地质), 5(6): 7-18. |
| [51] | 单竞男. 2011. 南海北部深水区热体制及烃源岩成熟度史研究[博士论文]. 北京: 中国科学院地质与地球物理研究所. |
| [52] | 施小斌, 周蒂, 张毅祥. 2000. 南海北部陆缘岩石圈热-流变结构. 科学通报, 45(15): 1660-1665. |
| [53] | 宋洋, 赵长煜, 张功成等. 2011. 南海北部珠江口与琼东南盆地构造-热模拟研究. 地球物理学报, 54(12): 3057-3069. |
| [54] | 汪缉安, 邓孝, 陈墨香等. 1995. 南海北部大陆架西段新生代热演化历史及其特点的分析. 地质科学, 30(3): 220-232. |
| [55] | 杨树春, 胡圣标, 蔡东升等. 2003. 南黄海南部盆地地温场特征及热-构造演化. 科学通报, 48(14): 1564-1569. |
| [56] | 姚伯初.1998.南海北部陆缘的地壳结构及构造意义. 海洋地质与第四纪地质, 18(2): 1-16. |
| [57] | 袁玉松. 2007. 南海北部陆缘深水区构造-热演化与烃源岩成熟度史研究[博士论文]. 北京: 中国科学院地质与地球物理研究所. |
| [58] | 张功成. 2010. 南海北部陆坡深水区构造演化及其特征. 石油学报, 31(4): 528-533, 541. |
| [59] | 张健, 宋海斌, 李家彪. 2005. 南海西南海盆构造演化的热模拟研究. 地球物理学报, 48(6): 1357-1365. |
| [60] | 张健, 汪集旸. 2000. 南海北部大陆边缘深部地热特征. 科学通报, 45(10): 1095-1100. |
 2014, Vol. 57


