 2014, Vol. 57


2. 中国科学院地质与地球物理研究所油气资源研究重点实验室, 北京 100029;
3. 中国地质科学院, 北京 100037;
4. 冀东油田勘探开发研究院, 河北唐山 063004
2. Key Laboratory of Petroleum Resources Research, Institute of Geology and Geophysics, Chinese Academy of Sciences, Beijing 100029, China;
3. Chinese Academy of Geological Sciences, Beijing 100037, China;
4. China Petroleum Jidong Oilfield Exploration and Development Research Institute, Hebei Tangshan 063004, China
1 引言
南海位于欧亚大陆东南缘,处于欧亚板块、太平洋板块和印-澳板块的交汇处,是西太平洋重要的边缘海,面积约350万km2.中生代以来,经历了东亚边缘大规模的地块拼合、挤压和伸展-走滑,以及新生代华南大陆岩石圈的破裂、南海海盆扩张、太平洋板块和印-澳板块的俯冲、碰撞,造就了南海4个不同性质的边缘,即北部(琼东南—珠江口盆地)为张性背景的陆缘,南部为挤压型陆缘,东部则为俯冲带,西部为走滑-剪切环境.南海丰富的地质现象是研究张裂大陆边缘形成演化与海底扩张的理想天然场所,被国内外学者认为是研究大陆破裂过程及其大陆破裂驱动力的“地球上最好的天然实验室”(Taylor and Hayes, 1983;Briais et al., 1993).
南海陆缘新生代沉积盆地蕴藏着丰富的石油资源,并且在南海北部残留的中生代地层中也发现了一些油气藏,揭示了南海巨大的油气资源潜力,因此开展南海边缘沉积盆地的构造-热演化历史不仅有助于增进南海张裂大陆边缘形成演化、海底扩张等重大科学的认识,同时有助于深化南海大陆边缘深水区的油气勘探的基础地质研究.
目前,南海地区的构造-热演化研究,多集中在南海北部边缘,如珠江口盆地和琼东南盆地(何丽娟等,1998; He et al., 2001;张健和汪集旸,2000;刘绍文等,2006),而南海南部盆地的研究多局限于构造、沉降模拟,热史模拟比较少(He et al., 2001;Shi et al., 2003).因此,本文基于应变速率方法(Jarvis and McKenzie, 1980; Kusznir et al., 1991; White,1994; White and Bellingham, 2002; 陈林等,2008; Song et al., 2010),采用多期有限拉张应变速率模型对南海南部边缘沉积盆地部分测线进行了构造-热演化历史模拟,完成了南海南部若干盆地的热演化历史的模拟,分析了基底热流(受深部岩石圈构造-热演化控制的盆地基底的热流)的变化过程,并且与北部边缘的珠江口和琼东南盆地进行了对比分析,对认识南海南部的构造-热演化过程和含油气盆地的油气资源潜力评估与发掘,具有重要的基础研究科学价值.
2 南海南部区域地质背景南海南部地区自新生代以来经历了复杂的构造 演化过程,先后经历了拉张、走滑、压剪等构造运动 的改造(谢文彦等,2007),而且不同地区经历的新生代构造活动也具有明显的不同,造就了南部陆缘沉积盆地不同的构造和热历史.中生代末南海南部与北部边缘仍位于华南陆缘(Taylor and Hayes, 1980),东亚陆缘发生应力松弛后(金庆焕和李唐根,2000),发生区域伸展,形成一系列NE向的垒-堑构造.新生代早期,南沙地块随着古南海俯冲的拖曳,逐渐从华南陆缘裂离(姚伯初,1996;周蒂等,2005),沿南海西缘断裂右旋走滑;中始新世,随着太平洋板块俯冲方向的转变(由NNW转为NWW),以及印度板块与欧亚板块的碰撞,古南海向南加速俯冲(吴世敏等,2004),南海周缘进一步被拉伸(万玲等,2003;姚伯初和刘振湖,2006).渐新世,古南海继续向南俯冲,新南海洋盆张开,印藏碰撞挤出,造成南海西缘发生左旋走滑剪切,南沙地块南部与加里曼丹发生碰撞(万玲等,2004),但是南沙块体内部依然以张性应变为主(姚永坚等,2005).早中新世,澳大利亚陆块北缘与巽他爪哇沟弧系碰撞(Hall et al., 1995),菲律宾海板块运动至南海东部(Rangin et al., 1990),新南海洋盆开始扩张,至中中新世新南海海底扩张逐渐停止.经历了一系列的地块碰撞活动后(姚伯初和刘振湖,2006),早期的断裂也由张性转为压或压扭性质(万玲等,2003),并且导致北西向大断裂发生右旋剪切,晚中新世以后区域构造活动相对较弱.
 | 图 1 南海南部边缘的沉积盆地展布和测线分布 Fig. 1 Map showing distribution of sedimentary basins in the southern SCS and seismic and geology lines |
本文采用基于有限拉张应变速率(Jarvis and McKenzie, 1980; Kusznir et al., 1991; White,1994; White and Bellingham, 2002; 陈林等,2008; Song et al., 2010)的构造-热模拟方法对南海南部边缘盆地进行模拟分析,该方法可以客观、准确地反映盆地尺度的多期拉张事件,而且多期应变速率反演,可以很好地实现像南海陆缘这样经历多期伸展活动的含油气盆地的伸展因子的计算,不需要知道拉张期次及拉张持续时间等先验信息,进而实现南海陆缘盆地的构造-热历史模拟,该方法在南海北部珠江口、琼东南盆地的构造-热模拟中取得很好的应用效果(宋洋等,2011),并且在叠合盆地中也可以取得较好的应用效果(赵长煜等,2010).其物理模型:假定岩石圈拉张前,盆地基底热流值稳定、均匀分布,地表温度T(z=a)=0,岩石圈底部温度T=Tm(1300 ℃),区域的构造运动使得岩石圈与地壳以速度u(x)水平拉伸,同时造成软流圈物质以垂向速度v(x,z)上涌以取代原先的岩石圈,垂向速度v从岩石底部的v0线性减小到地表的0(陈林等,2008),物理模型见图 2,参数见表 1.
 | 图 2 二维应变速率正演模拟的物理模型(陈林等,2008) Fig. 2 Physical model of 2D forward modeling of strain rates(after Chen et al., 2008) |
| 表 1 模型的基本参数(White and Bellingham, 2002) Table 1 Parameters of the model(White and Bellingham, 2002) |
有限拉张应变速率方法的构造-热演化模拟即是通过正演模型计算的构造沉降与反演计算的构造沉降进行拟合,而且在计算的过程中古水深校正是一个很难确定的参数,古水深的校正方法非常有限,由于缺少钻井和3D地震资料,无法利用沉积相分析南海南部边缘的古水深变化,而采用由现今的水深和南海张裂初始时的水深进行线性插值的方法误差很大(张云帆等,2011;赵中贤等,2011),因此本文通过应变速率反演计算裂后沉降的同时估算古水深.
古水深与现今的水深、沉积历史(古沉积厚度)具有一定的联系,并且洋壳的厚度与其张裂时间具有一定的线性关系(赵长煜,2012).因此,古水深的变化至少可以与现今的水深和历史的沉积厚度(受构造活动和沉积环境的交互作用)相结合进行估算:首先通过现今水深估算初次迭代的古水深Pwd(0),结合构造反演结果计算构造沉降量So,利用应变速率反演计算构造沉降量Sc,由于古水深是构造-热模拟过程中最主要的影响因素,因此假定二者的差值即为古水深的校正值Δ,进而得到第2次迭代的古水深Pwd(1),由此循环计算至限定的误差内(赵长煜,2012).图 3为利用现今水深线性插值、沉积厚度校正和热沉降反演校正后的结果对比图.
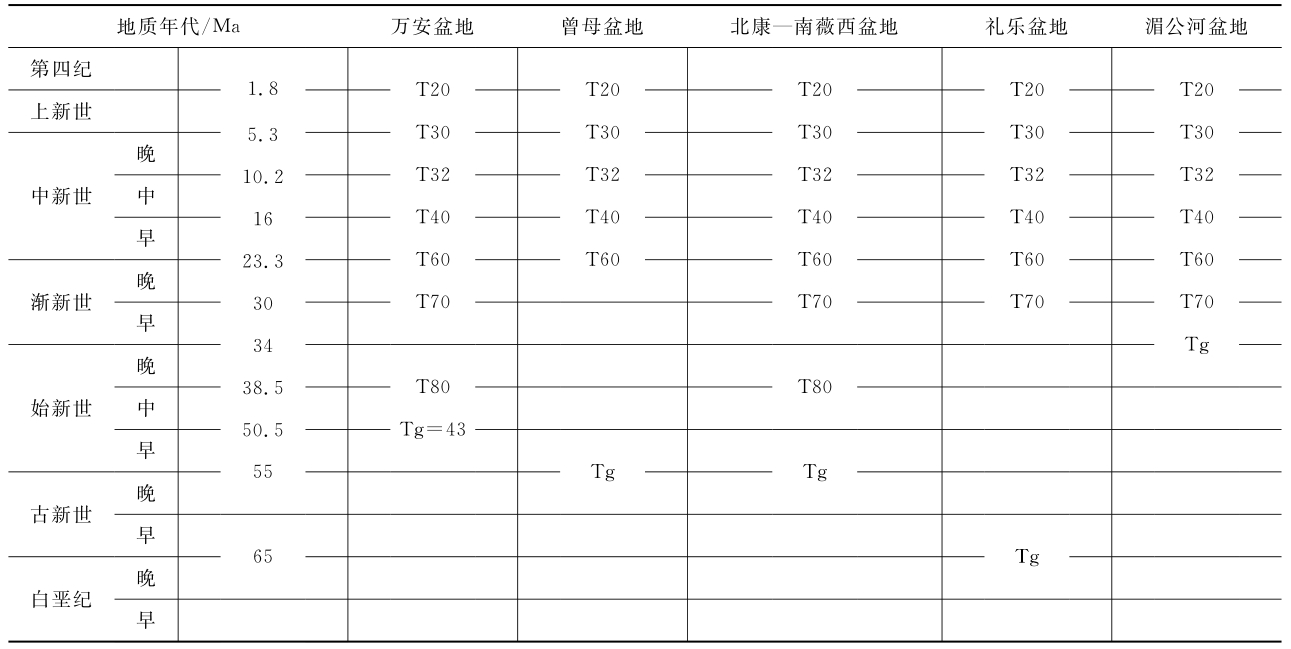
4 测线分布和模拟参数南海南部陆缘发育多个新生代沉积盆地,本文进行构造-热演化模拟所用的数据主要来源于前人(Clift et al., 2008; Binh et al., 2007; 丁巍伟和李家彪,2011;孙珍等,2011;吕彩丽等,2011;孙金龙等,2011;吴时国等,2011)公开发表的地震资料和国家重点基础研究发展计划973项目“南海大陆边缘动力学与油气资源潜力”的部分测线(丁巍伟和李家彪,2011;赵长煜等,2011),测线展布见图 1.南海南部边缘沉积盆地的地质年代划分,见表 1.南海南部边缘在海盆扩张之前与北部陆缘同属华南地块,具有相同的构造环境,因此为了便于与北部边缘沉积盆地(宋洋等,2011)进行对比,南部边缘热模拟参数采用了和北部 琼东南盆地和珠江口盆地相同的模拟参数,详见表 2.
 | 图 3 不同方法的古水深校正示意图(赵长煜,2012) Fig. 3 Sketch of different paleo-water-depth calibration methods(Zhao,2012) |
5 南海南部边缘的构造-热演化模拟
南海南部边缘沉积盆地的热历史具有明显的区域特征,不同盆地的热状态具有明显的差异性,可能源于西南次海盆海底扩张、南海南部陆缘的碰撞-走滑活动在不同盆地具有不同的响应.
5.1 南海南部边缘的西部南海南部边缘西部的基底热流,整体上呈现自西向东逐渐升高的趋势:始新世—渐新世为主要的张裂-裂陷期,盆地的热状态呈现逐渐升温的过程,进入热沉降期后逐渐冷却,西边的湄公河盆地的基底热流远远低于东部的曾母盆地.并且曾母的断裂活动自中新世以来一直持续至第四纪,沉降历史也呈现出多期的变化,晚中新世基底热流达到最大值,上新世以后逐渐降低,现今的基底热流普遍在80~100 mW·m-2左右,为典型的热盆,可能与南沙南部地块碰撞活动有关.
(1)湄公河盆地,现今基底热流50~60mW·m-2,是南部边缘西部最冷的地区,晚始新世—渐新世基底热流的快速上升对应于该时期的快速沉降,渐新世末基底热流达到历史最大值,约55~62 mW·m-2,随后进入热衰减期,逐渐冷却(图 4).
 | 图 4 湄公河盆地Con Lon测线的模拟结果 (a)地质剖面;(b)构造沉降曲线;(c)基底热流变化剖面;(d)基底热流变化曲线. Fig. 4 Results of thermal modeling for the Mekong basin (a)Geological model;(b)Tectonic subsidence curve;(c)Basal heat flow distribution variation map;(d)Basal heat flow curve. |
(2)万安盆地的热历史,表现为“南北有差异、东西有不同”,局部变化非常明显,浅水区基底热流变化幅度比较均一,深水区中新世以后的基底热流衰减比较快.始新世-渐新世处于快速升温过程,渐新世末达到历史最大值,约为70~75 mW·m-2,深水区基底热流最大约100 mW·m-2.早中新世,深水区热衰减非常明显,基底热流显著降低,浅水区冷却过程比较平缓,中中新世以后,全区进入热衰减期,现今的基底热流普遍在60~70 mW·m-2,东部深水区基底热流较高,约为85~90 mW·m-2(图 5).
 | 图 5 万安盆地SJL-E测线的模拟结果 (a)地质剖面;(b)构造沉降曲线(红色虚线以下为深水区);(c)基底热流变化剖面,(d)基底热流变化曲线(红色虚线以上为深水区). Fig. 5 Results of thermal modeling for the Wan′an basin on survey line SJL-E (a)Geological model;(b)Tectonic subsidence curve(below the red dash line is the Deep water areas);(c)Basal heat flow distribution variation map;(d)Basal heat flow curve(above the red dash line is the Deep water areas). |
(3)曾母盆地现今的基底热流普遍大于80 mW·m-2,远远高于万安—湄公河盆地,曾母南部凹陷现今大 地热流高达130 mW·m-2(He et al., 2001;Shi et al., 2003;单竞男,2011),基底热流也高达100 mW·m-2. 新生代以来,基底热流经历了始新世—渐新世、早中新世和晚中新世三次升温过程,深水区的基底热流明显高于浅水区,晚中新世基底热流达到了历史最大值,约80~90 mW·m-2,深水区更高一些,晚渐新世以后深水区基底热流明显降低,浅水区第三次的加热实际的影响大于深水区(图 6).
 | 图 6 曾母盆地SJL-A测线的模拟结果 (a)地质剖面;(b)构造沉降曲线(红色虚线以下为深水区);(c)基底热流变化剖面;(d)基底热流变化曲线(红色虚线以上为深水区). Fig. 6 Results of thermal modeling for the Zengmu on survey line SJL-A (a)Geological model;(b)Tectonic subsidence curve(below the red dash line is the Deep water areas);(c)Basal heat flow distribution variation map;(d)Basal heat flow curve(above the red dash line is the Deep water areas). |
该地区的基底热流展布主要为南北向的差异,东西向的差异较小,北康盆地中—北部和南薇西盆地的热流明显低于北康盆地南部地区.南薇西盆地的变化不大,现今基底热流约70~80 mW·m-2,晚渐新世末达到历史极大值,约80~85 mW·m-2,随后逐渐衰减;北康盆地的热流变化幅度明显小于曾母盆地,但是区域横向变化大,北康盆地中西部为高热流背景,现今基底热流约75 mW·m-2,东部70 mW·m-2左右,渐新世—早中新世达到历史极 大值,约80~85 mW·m-2,而东部约70 mW·m-2,裂后的热沉降期,热流变化比较平稳(图 7);九章、安渡北盆地的热历史与南薇西、北康盆地相似,东部的南沙海槽热演化程度较高,具有较高的基底热流,渐新世末最大约110 mW·m-2,随后进入热衰减阶段,现今基底热流约80 mW·m-2(图 8).
 | 图 7 90N9测线的模拟结果 (a)地质剖面;(b)构造沉降曲线;(c)基底热流变化剖面;(d)基底热流变化曲线. Fig. 7 Modeling results of line 90N9 (a)Geological model;(b)Tectonic subsidence curve;(c)Basal heat flow distribution variation map;(d)Basal heat flow curve. |
 | 图 8 So27-04测线的模拟结果(a)地质剖面;(b)构造沉降曲线;(c)基底热流变化剖面;(d)基底热流变化曲线. Fig. 8 Modeling results of line So27-04(a)Geological model;(b)Tectonic subsidence curve;(c)Basal heat flow distribution variation map;(d)Basal heat flow curve. |
礼乐盆地位于南沙东部,是南部陆缘热流较低的区域之一,尤其是礼乐盆地中部热流非常低,远低于湄公河盆地,且变化幅度剧烈,是南海南部边缘最冷的区域.模拟结果表明:礼乐盆地中部的热流异常低,现今的基底热流50 mW·m-2,渐新世末最大52~58 mW·m-2,而礼乐滩只有45 mW·m-2左右;礼乐盆地北部稍高一些,渐新世末约65~70 mW·m-2,现今基底热流60~65 mW·m-2(图 9和图 10).
 | 图 9 L2测线的模拟结果(a)地质剖面;(b)构造沉降曲线;(c)基底热流变化剖面;(d)基底热流变化曲线. Fig. 9 Results of line L2(a)Geological model;(b)Tectonic subsidence curve;(c)Basal heat flow distribution variation map;(d)Basal heat flow curve. |
 | 图 10 NH973-02测线的模拟结果 (a)地质剖面,(b)构造沉降曲线,(c)基底热流变化剖面,(d)基底热流变化曲线. Fig. 10 Results of line NH973-02 (a)Geological model;(b)Tectonic subsidence curve;(c)Basal heat flow distribution variation map;(d)Basal heat flow curve. |
(1)新生代以来,南海南、北边缘均经历了多期的拉张和伸展事件,在新南海海底扩张之前具有相似的大地构造背景,早期的拉张活动(始新世—渐新世/早中新世),对应于快速的沉降过程,随后普遍进入裂后的热沉降期(图 11).
 | 图 11 南海南、北边缘沉积盆地构造演化和沉降对比图(解习农等,2011) Fig. 11 Comparison of tectonic evolution and subsidence of marginal sedimentary basins between the northern and southern South China Sea(Xie et al., 2011) |
(2)南海北部琼东南盆地东部存在的热衰减延迟现象,在南海南部地区并没有可对应的衰减延迟 现象,相应时期的基底热流变化比较平稳,这可能是 由于不同构造单元对西南次海盆海底扩张的响应不同.
(3)西南次海盆海底扩张结束后,南、北边缘各盆地表现出迥异的构造、热演化历史,南海北部边缘珠江口盆地与南部边缘南沙中、北部和礼乐盆地均是在渐新世以后进入热衰减期,而琼东南盆地局部地区经历了晚期的热异常事件,基底热流至上新世才达到历史最大值,南部边缘的曾母盆地也同样存在晚期的热异常事件,虽然处于不同的构造单元,但是均与晚期的走滑-剪切活动有关(图 12).
 | 图 12 南海南、北边缘沉积盆地基底热流(赵长煜,2012) Fig. 12 Basal heat flow curves of marginal sedimentary basins in the northern and southern South China Sea(Zhao,2012) |
南海南部边缘的热状态整体特征表现为自SW向NE逐渐变冷,并且深水区热流明显高于浅水区.西部湄公河盆地始新世—渐新世的张裂结束后,基底热流逐渐降低,受南沙地区的碰撞-挤压-走滑和西南次海盆的海底扩张的影响很小,是南海南部较冷的地区.南沙中部的热状态比较稳定,自北西向南东基底热流逐渐增大,南沙海槽盆地表现为高热流异常,但是低于西南次海盆陆坡深水区,也低于曾母盆地的热异常.礼乐盆地为一个冷盆,现今的大地热流远远低于南海南部周缘的其他地区(单竞男,2011),是否是源于盆内中生代地层对深部的热扩散的阻挡或吸收,还不是很清楚.
南海南、北边缘具有相似的热演化特征,琼东南盆地和曾母盆地都存在晚期相似的热事件,曾母盆地的热异常可能与南部的挤压、走滑改造有关,而琼东南盆地的热异常可能与南海西北部的红河断裂的走滑活动有关.
| [1] | Binh N T T, Tokunaga T, Son H P, et al. 2007. Present-day stress and pore pressure fields in the Cuu Long and Nam Con Son Basins, offshore Vietnam. Marine and Petroleum Geology, 24(10): 607-615. |
| [2] | Briais A, Patriat P, Tapponnier P. 1993. Updated interpretation of magnetic anomalies and seafloor spreading stages in the South China Sea: implications for the tertiary tectonics of southeast Asia. Journal of Geophysical Research, 98(B4): 6299-6328. |
| [3] | Chen L, Song H B, Dong C Z, et al. 2008. 2-D strain rate forward modeling. Chinese J. Geophys. (in Chinese), 51(6): 1819-1825. |
| [4] | Clift P, Lee G H, Duc N A, et al. 2008. Seismic reflection evidence for a dangerous grounds miniplate: no extrusion origin for the South China Sea. Tectonics, 27(3): 1-16. |
| [5] | Ding W W, Li J B. 2011. Seismic stratigraphy, tectonic structure and extension factors across the southern margin of the South China Sea: evidence from two regional multi-channel seismic profiles. Chinese J. Geophys. (in Chinese), 54(12): 3038-3056. |
| [6] | Hall R, Ali J R, Anderson C D, et al. 1995. Origin and motion history of the Philippine Sea Plate. Tectonophysics, 251(1-4): 229-250. |
| [7] | He L J, Xiong L P, Wang J Y. 1998. Effects on the tectonothermal modeling of extensional basins. Scientia Geologica Sinica (in Chinese), 33(2): 222-228. |
| [8] | He L J, Wang K L, Xiong L P, et al. 2001. Heat flow and thermal history of the South China Sea. Physics of the Earth and Planetary Interiors, 126(3-4): 211-220. |
| [9] | Jarvis G T, McKenzie D P. 1980. Sedimentary basin formation with finite extension rates. Earth and Planetary Science Letters, 48(1): 42-52. |
| [10] | Jin Q H, Li T G. 2000. Regional geologic tectonics of the Nans Ha Sea area. Marine Geology & Quaternary Geology (in Chinese), 20(1): 1-8. |
| [11] | Kusznir N J, Marsden G, Egan S S. 1991. A flexural cantilever simple-shear/pure-shear model of continental lithosphere extension: applications to the Jeanne d'Arc Basin, Grand Banks and Viking Graben, North Sea. Geological Society, London, Special Publication, 56(1): 41-60. |
| [12] | Liu S W, Shi X B, Wang L S, et al. 2006. Recent advances in studies on the formation mechanism of the South China Sea and thermo-rheological structure of lithosphere in its northern margin: an overview. Marine Geology & Quaternary Geology (in Chinese), 26(4): 117-124. |
| [13] | Lü C L, Yao Y J, Wu S G, et al. 2011. Seismic responses and sedimentary characteristics of the miocene Wan'an carbonate platform in the southern South China Sea. Earth Science-Journal of China University of Geosciences (in Chinese), 36(5): 931-938. |
| [14] | Rangin C, Bellon H, Benard F, et al. 1990. Neogene arc-continent collision in Sabah, northern Borneo (Malaysia). Tectonophysics, 183(1-4): 305-319. |
| [15] | Shan J N. 2011. Tectonothermal evolution and source rock maturation history in deep water region area of the northern Margin of the South China Sea[Ph. D. thesis] (in Chinese). Beijing: Institute of Geology and Geophysics, Chinese Academy of Sciences. |
| [16] | Shi X B, Qiu X L, Xia K Y, et al. 2003. Characteristics of surface heat flow in the South China Sea. Journal of Asian Earth Sciences, 22(3): 265-277. |
| [17] | Song H B, Chen L, Zhang J, et al. 2010. A MATLAB program for 1D strain rate inversion. Computers & Geosciences, 36(1): 16-23. |
| [18] | Song Y, Zhao C Y, Zhang G C, et al. 2011. Research on tectono-thermal modeling for Qiongdongnan Basin and Pearl River Mouth Basin in the northern South China Sea. Chinese J. Geophys. (in Chinese), 54(12): 3057-3069. |
| [19] | Sun J L, Zhang Y F, Xu H L, et al. 2011. Cenozoic tectonics and basin evolution in the southwestern Nansha sea area. Earth Science-Journal of China University of Geosciences (in Chinese), 36(5): 956-966. |
| [20] | Sun Z, Zhao Z X, Zhou D, et al. 2011. The stratigraphy and the sequence architecture of the basins in Nansha region. Earth Science-Journal of China University of Geosciences (in Chinese), 36(5): 798-806. |
| [21] | Taylor B, Hayes D E. 1980. The tectonic evolution of the South China Basin.//Hayes D E. The Tectonic and Geologic Evolution of Southeast Asian Seas and Islands. AGU Geophysical Monograph, Washington, D. C, 2: 89-104. |
| [22] | Taylor B, Hayes D E. 1983. Origin and history of the South China Sea basin.//Hayes D E. The Tectonic and Geologic Evolution of Southeast Asian Seas and Islands: Part Ⅱ. AGU Geophysical Monograph, Washington, D. C, 27: 23-56. |
| [23] | Wan L, Wu N Y, Yao B C, et al. 2003. Cenozoic tectonic movement and the genetic discussion in Nansha sea area. Geological South China Sea (in Chinese), 8-16. |
| [24] | Wan L, Wu N Y, Yao B C, et al. 2004. Crustal structure in Nansha and its adjacent area. Geological South China Sea (in Chinese), 1-9. |
| [25] | White N. 1994. An inverse method for determining lithospheric strain rate variation on geological timescales. Earth and Planetary Science Letters, 122(3-4): 351-371. |
| [26] | White N, Bellingham P. 2002. A two-dimensional inverse model for extensional sedimentary basins 1. theory. Journal of Geophysical Research, 107(B10): ETG 17-1-ETG 17-20. |
| [27] | Wu S G, Zhao X Y, Dong D D, et al. 2011. Seismic response and development of carbonate platform in Liyue basin, Nansha area. Earth Science-Journal of China University of Geosciences (in Chinese), 36(5): 807-814. |
| [28] | Wu S M, Zhou D, Liu H L. 2004. Tectonic framework and evolutionary characteristics of Nansha block, south China Sea. Geotectonica ET Metallogenia (in Chinese), 28(1): 23-28. |
| [29] | Xie W Y, Wang T, Zhang Y W. 2007. Structural features and formation mechanism of fault systems in Nansha sea area. Journal of Tropical Oceanography (in Chinese), 26(6): 26-33. |
| [30] | Xie X N, Zhang C, Ren J Y, et al. 2011. Effects of distinct tectonic evolutions on hydrocarbon accumulation in northern and southern continental marginal basins of south China Sea. Chinese J. Geophys. (in Chinese), 54(12): 3280-3291. |
| [31] | Yao B C. 1996. Tectonic evolution of the south China Sea in Cenozoic. Marine Geology & Quaternary Geology (in Chinese), 16(2): 1-13. |
| [32] | Yao B C, Liu Z H. 2006. Sedimentary basins and petroleum resources in Nansha offshore area, South China Sea. China Offshore Oil and Gas (in Chinese), 18(3): 150-160. |
| [33] | Yao Y J, Xia B, Xu X. 2005. Tectonic evolution of the main sedimentary basins in southern area of the South China Sea. Geological South China Sea (in Chinese), 1-11. |
| [34] | Zhang J, Wang J Y. 2000. The deep geothermal characteristics of northern South China Sea margin continental. Chinese Science Bulletin (in Chinese), 45(10): 1095-1100. |
| [35] | Zhang Y F, Liao J, Sun Z, et al. 2011. Characteristics of tectonic subsidence of Nansha area. Earth Science-Journal of China University of Geosciences (in Chinese), 36(5): 949-955. |
| [36] | Zhao C Y, Song H B, Qian R Y, et al. 2010. Research on tectono-thermal evolution modeling method for superimposed basin with the Jianghan basin as an example. Chinese J. Geophys. (in Chinese), 53(1): 128-137. |
| [37] | Zhao C Y, Song H B, Li J B, et al. 2011. Tectonic and seismic interpretation of line NH973-1 along southwest sub-basin in South China Sea. Chinese J. Geophys. (in Chinese), 54(12): 3258-3268. |
| [38] | Zhao C Y. 2012. Tectono-thermal evolution modeling of the South China Sea continental margin basins (in Chinese). Beijing: China University of Geosciences. |
| [39] | Zhao Z X, Sun Z, Chen G H, et al. 2011. Cenozoic structural characteristics and subsidence evolution in Nansha. Earth Science-Journal of China University of Geosciences (in Chinese), 36(5): 815-822. |
| [40] | Zhou D, Wu S M, Chen H Z. 2005. Some remarks on the tectonic evolution of Nansha and its adjacent regions in Southern South China Sea. Geotectonica ET Metallogenia (in Chinese), 29(3): 339-345. |
| [41] | 陈林, 宋海斌, 董崇志等. 2008. 二维应变速率正演模拟. 地球物理学报, 51(6): 1819-1825. |
| [42] | 丁巍伟, 李家彪. 2011. 南海南部陆缘构造变形特征及伸展作用: 来自两条973多道地震测线的证据. 地球物理学报, 54(12): 3038-3056. |
| [43] | 何丽娟, 熊亮萍, 汪集旸. 1998. 拉张盆地构造热演化模拟的影响因素. 地质科学, 33(2): 222-228. |
| [44] | 金庆焕, 李唐根. 2000. 南沙海域区域地质构造. 海洋地质与第四纪地质, 20(1): 1-8. |
| [45] | 刘绍文, 施小斌, 王良书等. 2006. 南海成因机制及北部岩石圈热-流变结构研究进展. 海洋地质与第四纪地质, 26(4): 117-124. |
| [46] | 吕彩丽, 姚永坚, 吴时国等. 2011. 南沙海区万安盆地中新世碳酸盐台地的地震响应与沉积特征. 地球科学——中国地质大学学报, 36(5): 931-938. |
| [47] | 单竞男. 2011. 南海北部深水区热体制及烃源岩成熟度史研究[博士论文]. 中国科学院地质与地球物理研究所. |
| [48] | 宋洋, 赵长煜, 张功成等. 2011. 南海北部珠江口与琼东南盆地构造-热模拟研究. 地球物理学报, 54(12): 3057-3069. |
| [49] | 孙金龙, 张云帆, 徐辉龙等. 2011. 南沙西南海域新生代构造活动特征与盆地演化. 地球科学——中国地质大学学报, 36(5): 956-966. |
| [50] | 孙珍, 赵中贤, 周蒂等. 2011. 南沙海域盆地的地层系统与沉积结构. 地球科学——中国地质大学学报, 36(5): 798-806. |
| [51] | 万玲, 吴能友, 姚伯初等. 2003. 南沙海域新生代构造运动特征及成因探讨. 南海地质研究, 8-16. |
| [52] | 万玲, 吴能友, 姚伯初等. 2004. 南沙及其邻近海域地壳结构特征. 南海地质研究, 1-9. |
| [53] | 吴时国, 赵学燕, 董冬冬等. 2011. 南沙海区礼乐盆地碳酸盐台地地震响应及发育演化. 地球科学——中国地质大学学报, 36(5): 807-814. |
| [54] | 吴世敏, 周蒂, 刘海龄. 2004. 南沙地块构造格局及其演化特征. 大地构造与成矿学, 28(1): 23-28. |
| [55] | 谢文彦, 王涛, 张一伟. 2007. 南沙群岛海域断裂体系构造特征及其形成机制. 热带海洋学报, 26(6): 26-33. |
| [56] | 解习农, 张成, 任建业等. 2011. 南海南北大陆边缘盆地构造演化差异性对油气成藏条件控制. 地球物理学报, 54(12): 3280-3291. |
| [57] | 姚伯初. 1996. 南海海盆新生代的构造演化史. 海洋地质与第四纪地质, 16(2): 1-13. |
| [58] | 姚伯初, 刘振湖. 2006. 南沙海域沉积盆地及油气资源分布. 中国海上油气, 18(3): 150-160. |
| [59] | 姚永坚, 夏斌, 徐行. 2005. 南海南部海域主要沉积盆地构造演化特征. 南海地质研究, 1-11. |
| [60] | 张健, 汪集旸. 2000. 南海北部大陆边缘深部地热特征. 科学通报, 45(10): 1095-1100. |
| [61] | 张云帆, 廖杰, 孙珍等. 2011. 南沙海域构造沉降特征. 地球科学——中国地质大学学报, 36(5): 949-955. |
| [62] | 赵长煜, 宋海斌, 钱荣毅等. 2010. 叠合盆地构造热演化模拟方法研究——以江汉盆地为例. 地球物理学报, 53(1): 128-137. |
| [63] | 赵长煜, 宋海斌, 李家彪等. 2011. 南海西南次海盆NH973-1测线地震解释. 地球物理学报, 54(12): 3258-3268. |
| [64] | 赵长煜. 2012. 南海大陆边缘盆地构造热演化模拟[博士论文]. 北京: 中国地质大学. |
| [65] | 赵中贤, 孙珍, 陈广浩等. 2011. 南沙海域新生代构造特征和沉降演化. 地球科学——中国地质大学学报, 36(5): 815-822. |
| [66] | 周蒂, 吴世敏, 陈汉宗. 2005. 南沙海区及邻区构造演化动力学的若干问题. 大地构造与成矿学, 29(3): 339-345. |