2. 中国地质大学地球物理与信息技术学院, 北京 100083;
3. 中国科学院地质与地球物理研究所, 北京 100029
2. School of Geophysics and Information Technology, China University of Geosciences, Beijing 100083, China;
3. Institute of Geology and Geophysics, Chinese Academy of Sciences, Beijing 100029, China
1 引言
印度板块和欧亚板块的碰撞造就了喜马拉雅山 脉和号称世界屋脊的青藏高原,其影响越过天山 山脉,可能达到贝加尔裂谷甚至更远的地方(Tapponnier and Molnar, 1976),与太平洋板块的西向俯冲一起,共同构成了影响东亚新生代构造格局最重要的构造动力源泉.中国西部地区成为研究大陆动力学的绝佳场所,青藏高原的隆升历史、动力学机制及其对于周边地块的影响一直是地学界研究的热点问题.从20世纪20年代开始陆续提出了多种青藏高原隆升机制的模型(Matte et al., 1997; Tapponnier et al., 2001),而了解地壳上地幔的结构是建立正确动力学模型的重要基础.从20世纪后期开始中外科学家利用天然地震资料、人工地震、大地电磁测深等各种方法对这一区域(图 1)的地壳上地幔结构进行探测,取得了丰富的成果.对于中国西部这样地震台站比较稀疏的区域,面波资料可以达到相对较好的路径覆盖,因此区域尺度的面波层析成像是研究百公里尺度S波速度结构的重要方法,已经取得很多成果(宋仲和等,1991; 周兵等,1991; 庄真等,1992; 朱介寿等,2002; 彭艳菊等,2002; 苏伟等,2002; Huang et al., 2003,2004; Zhou and Murphy, 2005; Priestley et al., 2006; 冯梅和安美建,2007; Chen et al., 2010).近年来从地震噪声中提取面波信息的方法取得很大发展,弥补了天然地震资料不足的缺陷,对改善地壳结构的分辨能力起到了很好的作用(Yao et al., 2008; Li et al., 2009,2012; Guo et al., 2009; Yang et al., 2012).本文介绍我们的面波层析成像工作在研究区域(20°N—55°N,65°E—110°E,图 1)的最新结果,给出各个构造块体岩石圈速度结构的主要特征,并对其构造动力学意义作初步的探讨.
 | 图 1 研究区域及主要构造单元(红线指示图 6中速度剖面的位置) Fig. 1 Study region and major tectonic units(Red lines indicate locations of velocity profiles in Fig. 6) |
全部面波层析成像工作覆盖的范围是23°S—65°N,50°E—165°E,收集了该区域内截止于2006年底的地震记录.用基于多重滤波技术(Dziewonski and Hales, 1972)的时频分析方法提取每条路径在10~184 s周期范围内的基阶瑞利波群速度频散曲线.层析成像采用传统的两步法:第一步通过二维网格反演确定每个结点的纯路径频散曲线,第二步再反演每个结点下方的S波速度结构.整个反演区域采用可变尺度网格进行离散,中国、蒙古境内和印度东北部网格大小为1°×1°,边缘地区为2°×2°或2°×4°结点间速度采用双线性内插,结点速度(即反演待定参数)采用Smith和Dahlen(1973)的方法表示为V=V0+Acos(2α)+Bsin(2α),其中V0是平均(各向同性)速度,α是瑞利波传播方位角,A和B是表征方位各向异性的两个参数,由此可算出瑞利波快波方向和各向异性强度.二维网格反演采用Occam方法(Constable et al., 1987; 黄忠贤和郑月军,1998; Huang et al., 2003,2004),同时反演瑞利波的速度及方位各向异性.文中给出的S波速度结构是根据平均瑞利波速度V0的频散曲线,最近重新进行S波速度结构反演的结果.
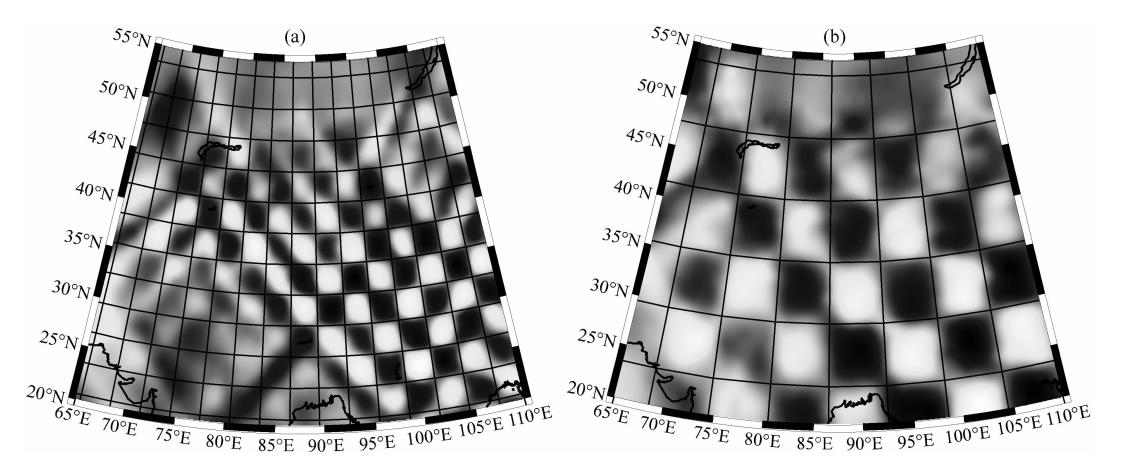
穿过本文研究区域的面波路径数在周期39.8 s时最多,达8525条.周期减小或增大时路径数都减少,10 s周期路径数为7235,184.7 s周期的路径数为3463条.利用棋盘模型对反演的分辨能力作了试验.理论模型为速度高低相间的棋盘状速度模型,通过正演计算得到每条路径的理论走时,然后随机叠加一个介于正负0.04 km·s-1的速度误差.利用与实际资料相同的路径和反演参数进行反演,考察输出结果与理论模型的符合程度.图 2a显示周期39.8 s,3°×3°棋盘模型的反演结果.可以看出除了研究区域的北、西边缘部分外,原始速度模型得到了较好恢复.图 2b显示周期184.7 s,6°×6°棋盘模型的反演结果,可见在深部路径覆盖最差的情况下,研究区内仍有不差于6°的分辨能力.综合实际资料的反演结果来判断,我们估计在地壳和岩石圈地幔深度的反演分辨率大约分别是3°和4°.
 | 图 2 分辨率试验结果 (a)3°×3°模型,周期39.8s;(b)6°×6°模型,周期184.7 s. Fig. 2 Resolution test results (a)Period 39.8 s,checkerboard cell size 3°×3°;(b)Period 184.7s,checkerboard cell size 6°×6°. |
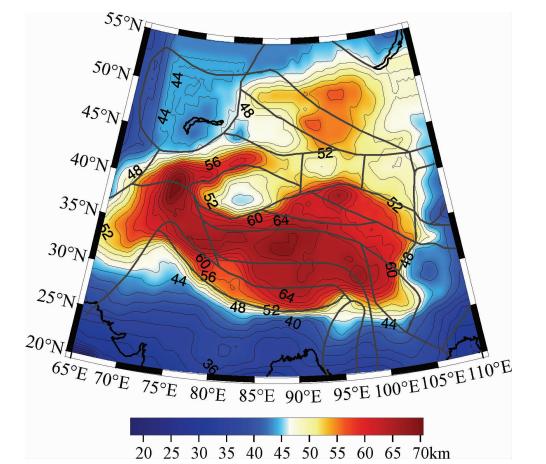
图 3给出由面波反演得到的研究区内莫霍面深 度分布,等值线间隔为2 km.面波给出的是忽略小尺度横向变化后的平均结果,在通常情况下由于层厚/速度折衷引起的不确定性估计为±1~2 km,但是在构造活动强烈的地区如青藏高原,我们对于下地壳和地幔顶部的真实速度没有确切的认识,因此地壳厚度的确定会有较大的误差.由图 3可见青藏高原及兴都库什—帕米尔—天山是地壳显著增厚的地区,地壳厚度在帕米尔达到70 km,青藏高原内部达68 km,在高原的边缘具有很大的水平梯度.西蒙古高原和阿尔泰山脉也是一个地壳增厚区,地壳厚度一般在52 km以上.而在构造作用以拉伸为主的地区,如中国大陆东部及边缘海,地壳减薄往往是构造活动强烈的标志.
 | 图 3 面波反演给出的Moho面深度分布 Fig. 3 Map of Moho depths from surface wave tomography |
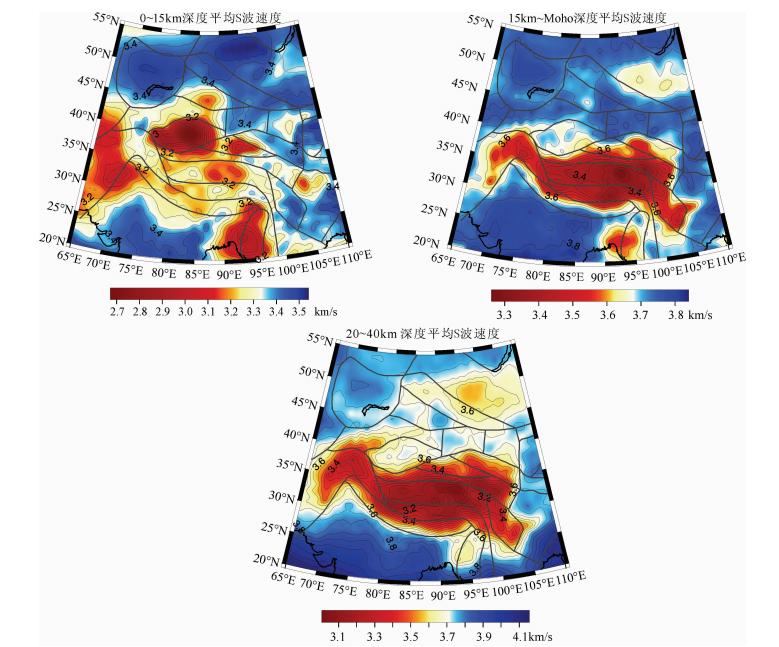
图 4a和图 4b给出0至15 km和15 km至Moho 面深度范围内平均S波速度的分布,分别表示上地壳和中下地壳的平均速度.在采用分层模型进行层析成像的情况下,利用一定深度范围的平均速度开展讨论可以大体上消除模型分层的随意性和层厚/速度折中造成的影响.
 | 图 4 0~15 km(a),15 km~Moho(b)和20~40 km(c)深度平均S波速度分布 Fig. 4 Average S wave velocity in 0~15 km(a),15 km~Moho(b) and 20~40 km(c)depths |
上地壳的平均速度主要受沉积层厚度的影响.研究区内的主要沉积盆地,如塔里木、准噶尔、柴达木、四川盆地和羌塘盆地等,以及印度河、恒河、伊洛瓦底平原等在图 4a中都有显著的表现.
中下地壳速度分布(图 4b)中的低速区与新生代构造活动有密切关系.研究区内存在三个地壳低速区:北部的蒙古高原,南部的缅甸弧两侧,以及最为显著的青藏高原地区,包括川滇西部及帕米尔—兴都库什地区.青藏高原地壳的低速现象主要是由中地壳存在低速层引起.图 4c给出20~40 km深度范围的平均速度分布,青藏高原低速区的范围与高原地形相当一致,并包括了川滇西部地区以及毗邻的兴都库什、帕米尔和天山地区.这一深度范围的平均速度如小于3.6 km·s-1就低于正常大陆中地壳的速度,如小于3.4 km·s-1就说明存在速度发生逆转的地壳低速层.图 4c显示中地壳低速现象和低速层存在于整个高原地区.喀喇昆仑断裂东西两侧的低速层似乎不相连贯,但在高原主体和东缘地区没有出现明显的阻隔;在90°E以西,速度等值线都是东西走向,以东地区则出现了NW-SE和NS走向的等值线.
青藏高原地壳的低速现象得到很多研究工作的支持,只是在关于低速层的展布范围、存在深度、以及低速层之间是否连通的问题上存在分歧.Rapine 等(2003)利用两组分别穿越羌塘和拉萨地块到达INDEPTH台站的面波资料反演地壳结构,发现拉 萨地块有显著的中地壳低速层,而羌塘不存在低速层.Caldwell等(2009)利用面波研究了一条印北—喜马拉雅—喀喇昆仑剖面的地壳S波速度结构,发现地壳中20~40 km深度存在显著低速层.Yao 等(2008)同时利用背景噪声和地震资料研究川滇菱形地块的地壳上地幔结构,发现低速层可能在中或下地壳出现,三维速度结构复杂,大范围物质流动可能受阻.Li 等(2009)通过噪声成像发现青藏东缘地区的中地壳存在低速层.Guo 等(2009)对尼泊尔—藏南地区(85°E—88°E,26.5°N—29.5°N)开展噪声成像,发现在大约10~25 km深度存在地壳低速层.本文结果也显示在喜马拉雅造山带下低速层埋深变浅.Li 等(2012)对中国西部开展了地震噪声成像(7~50 s面波),给出0~70 km的S波速度结构,有较好分辨;在20~45 km平均速度图以及穿过青藏高原的速度剖面上可以看到中地壳低速层.Yang 等(2012)利用噪声资料提取10~60 s瑞利波相速度进行成像,发现青藏高原大部分地区20~40 km深度存在中地壳低速层,相互连通.这两个最新的噪声研究与本文结果比较一致.
利用其他地震资料和大地电磁测深的研究结果也证实了低速/低阻层在整个青藏高原普遍存在.Wang等(2007)对川西两条地震测深剖面进行了分析,龙门山以西上地壳10~20 km间存在低速层,下地壳Q值小且明显增厚.王椿镛等(2008)在青藏东缘沿30°N开展了接收函数研究,在羌塘地块和巴颜喀拉地块,沿观测剖面的下地壳(30~60 km深度范围内)普遍存在低速异常和高泊松比.Xu 等(2007)利用接收函数方法研究川滇西部地区速度结构,发现存在壳内低速层.在西藏南部(魏文博等,2009)、青藏高原东缘(赵国泽等,2008)和西缘(金胜等,2007)开展的大地电磁测深工作表明青藏高原地区普遍存在中、下地壳高导层.
综上所述,整个青藏高原包括其东缘的川滇西部地区和西部毗邻的帕米尔—兴都库什地区具有比较一致的地壳结构特征,即高原下方增厚的地壳、周缘陡峭的地形和急剧减薄的地壳、以及高原内部广泛存在的中下地壳低速.这种地壳结构支持关于青藏高原隆升的塑性增厚和侧向流动模式,与根据地表GPS观测得到的现今连续变形模式(Zhang et al., 2004)相容.
3.3 上地幔速度结构青藏高原的上地幔速度结构表现出与地壳完全不同的特征.图 5a和5b分别给出研究区莫霍面至100 km和100至160 km深度区间的平均S波速度分布.图中蓝色(高速上地幔)区域对应比较稳定的大陆地块,包括哈萨克斯坦、西伯利亚、塔里木、准噶尔、阿拉善、鄂尔多斯、扬子及印度等.与地壳的情况相似,研究区中有三个主要的上地幔低速区.比较图 4b、5a和5b不难发现,随着深度增大,西蒙古和缅甸弧后的低速区变得越发显著,而青藏高原低速区的范围逐渐变小,说明这些低速区的结构和形成机制有明显区别.
 | 图 5 Moho至100 km(a)和100~160 km(b)深度平均S波速度分布 Fig. 5 Average S wave velocity in Moho~100 km(a) and 100~160 km(b) |
西蒙古高原下方的岩石圈厚度约为80 km,在贝加尔湖地区上地幔低速层上升到接近莫霍面的深度.这个低速层大致以贝加尔南段为中心,范围广、厚度大、向下延伸至250 km,即本文能可靠反演的底部深度.西蒙古—贝加尔地区上地幔的低速现象也得到其他研究的支持(Zorin et al., 2002,2003; Tiberi et al., 2008; Koulakov and Bushenkova, 2010),低速区的形成可能与印度—欧亚板块碰撞的作用无关,而是新生代地幔柱上升和更早地质时期板块拼合残留的影响.
印度板块沿缅甸弧向东俯冲达到200 km深度,在俯冲板片上方造成显著的上地幔低速,在腾冲火山区低速上地幔物质上升至莫霍面.这一低速区向东扩展,占据了哀牢山—红河断裂以南的大片区域.从图 5b中看到,沿缅甸弧延伸的代表俯冲板块的高速体和从喜马拉雅东构造结向北延伸的高速体相连.印度板块在向东俯冲的同时向北运动,在东构造结这个结合点究竟如何运动,产生了怎样复杂的速度结构,还需要做大量深入的工作.
在上地幔顶部(图 5a),青藏高原除了东、西构造结和柴达木—祁连山地区外,大部分表现为低速区,并可大致分为三块:羌塘—昆仑、班公—怒江缝合带、以及巴颜喀拉—川滇西部.深度增大时,低速区逐渐收缩到羌塘—柴达木地区以下(图 5b).青藏高原的上地幔速度结构远比地壳复杂,从西到东呈现显著不同的结构特征,在下一节中结合速度剖面有详细论述.
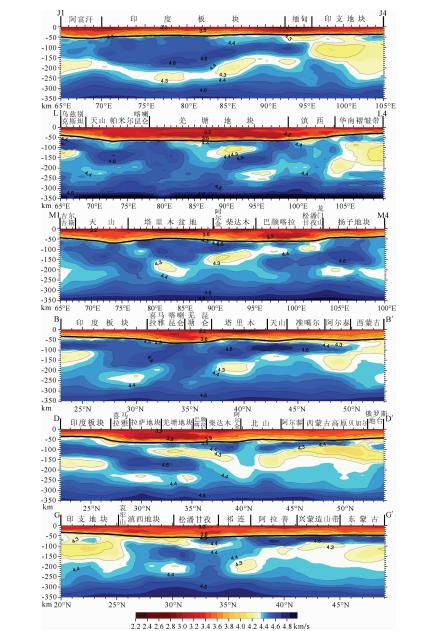
3.4 速度结构剖面图 6给出沿6条剖面的S波速度结构图像,剖面位置如图 1所示.剖面J1J4大致平行于喜马拉雅山脉穿过印度板块的北部,然后通过缅甸进入印支地块.印度板块向东俯冲到亚洲板块之下的迹象相当明显.值得注意的是,印度板块北部的岩石圈厚度明显分成东西两部分,在大约84°E以西厚约160~200 km,而以东的厚度为140 km左右.从剖面BB′和DD′中也可清楚看出这一差别.BB′南端接近阿拉伯海的地方岩石圈厚度约100 km,与Suresh 等(2008)给出附近印度河盆地的岩石圈厚度(79 km)接近,而26°N以北的岩石圈厚度为200 km.剖面DD′中印度岩石圈厚约130~140 km.印度大陆大部分地区的岩石圈厚度为150 km左右(Mitra et al., 2006; Bhattacharya et al., 2009),而喜马拉雅西端以南的岩石圈较厚(Vinnik et al., 2007).印度大陆北部岩石圈的东、西方向差异与青藏高原岩石圈变形/运动的东西不对称性是否存在联系,是一个值得研究的问题.
 | 图 6 0~350 km S波速度剖面图(剖面位置见图 1) Fig. 6 S wave velocity profiles(see Fig. 1 for profile locations) |
剖面L1L4从西到东穿过青藏高原,高原的上地幔结构可以分成具有不同特征的四段:兴都库什—喀喇昆仑,羌塘,东构造结,川滇西部.大致在83°E以西,莫霍面以下的上地幔整体表现出高速性质;在近南北走向的BB′剖面中也可以看到这一现象.其他利用体波和面波资料的研究同样揭示了这 个地区的高速上地幔(Pandey et al., 1991; Koulakov and Sobolev, 2006; 张瑞青等,2008; Hanna and Weeraratne, 2013).地质和地震活动性研究表明,这个地区存在大陆岩石圈向北和向南的俯冲,在兴都库什地区中源地震达到300 km深度,因此这里的上地幔高速现象是由俯冲的岩石圈板块造成的.
83°E到95°E之间剖面L1L4通过高原的中心地带,对这一区域已作过较多研究,但对其上地幔结构仍存在较多争议.目前大致有共识的一点是羌塘地块上地幔顶部呈现S波低速异常.20世纪80年代对Sn波的研究发现这一现象(McNamara et al., 1995),但是利用Sn波的最新研究(Barron and Priestley, 2009)显示,低频Sn波基本上可以在整个高原地区传播,而随着频率增大在越来越大的范围内Sn波传播效率变低,说明高原的莫霍面以下仍大致保留一定厚度的高速岩石圈.从本文的面波成像结果可以看出,这个区域上地幔结构有两个特 征(图 6剖面L1L4和DD′):第一,从莫霍面到140 km 深度上地幔速度明显低于稳定大陆地区的速度,但是在上地幔顶部多数地方仍保留有几十公里厚相对高速的岩石圈;这可以解释低频Sn波的传播,但是难以解释高频Sn波传播困难的现象,这也许与Moho面是一个速度梯度层以及存在小尺度的复杂速度结构有关;第二,大约在140~220 km深度范围内存在近水平展布的高速体,我们倾向于解释为俯冲到青藏之下的印度岩石圈板片,其前缘到达昆仑—巴颜喀拉山脉下方.近年的面波研究大多认为存在这个俯冲板片(苏伟等,2002; Zhou et al., 2005; Priestley et al., 2006,2008),其水平和深度展布范围也大体一致.但是面波的结果与多数体波研究存在较大分歧.Kind 等(2002)利用接收函数方法研究了这个区域下方的速度界面,其中一条剖面的位置与图 6剖面DD′很接近,但二者结果大相径庭.他们的结果中显示出欧亚板块向南俯冲的迹象但未见印度板块向北俯冲,与面波的结果正好相反.Tilmann等(2003)用走时反演方法研究了88°E附近一条剖面的P波速度结构,发现在班公—怒江缝合带以南100~400 km深度存在近垂直的高速带,解释为下沉的印度岩石圈地幔.Kumar 等(2006)用接收函数研究了92°E附近的岩石圈底界面深度;班公怒江缝合带以南,印度岩石圈底界面从160 km北倾到220 km,以北亚洲岩石圈底面近水平存在于160~180 km.Liang 等(2012)最近的体波成像结果 显示在班公—怒江缝合带以北的上地幔直到400 km 深度都表现为低速,而向北俯冲的印度岩石圈被南北向的低速条带分隔呈碎片状.上述情况表明,对青藏高原上地幔结构的研究还有许多工作要做.
95°E—99°E之间从喜马拉雅东构造结到巴颜喀拉地块,上地幔基本呈现高速状态(图 6剖面L1L4,图 5a,图 5b),因此羌塘上地幔低速物质不易发生向东的流动.川滇菱形地块的岩石圈厚度约为180 km(剖面L1L4和GG′),说明基本保留了扬子地块的岩石圈,只是此地的上地幔速度明显低于稳 定的扬子地块,特别是在上地幔顶部出现显著的低速.
剖面M1M4经过青藏高原北部地区,在汶川大震震源区穿过龙门山进入四川盆地.塔里木盆地的岩石圈厚度为150~180 km,四川盆地的岩石圈厚约180 km.可以看到在巴颜喀拉地块上地幔低速层出现在很浅的深度,并且中地壳和上地幔低速层都有向东抬升的趋势.
面波反演给出的青藏高原上地幔结构显示与地壳结构完全不同的特征,由此推测在印度—欧亚板块碰撞的过程中,地壳和岩石圈上地幔具有完全不同的运动/变形模式.在青藏高原东部,面波反演结果显示地壳中较强的各向异性图像与地壳物质向东向南运动的模式一致,而地幔各向异性较弱且具有明显不同的图像,在一定程度上印证了上述推断(黄忠贤等,2013).
4 结论根据中国西部和邻区面波层析成像结果的分析,可以得出以下主要结论.
(1)研究区域存在三个以低速地壳/上地幔为特征的构造活动区域:西蒙古高原—贝加尔地区,青藏高原,印支地区.西蒙古高原—贝加尔和印支地区的上地幔低速层向下延伸至很大深度,源自地幔深部的热流活动;青藏高原的低速存在于地壳和上地幔顶部,是印度—欧亚板块碰撞的产物.区内的哈萨克斯坦、塔里木、鄂尔多斯、扬子、印度等地块的岩石圈具有高速特征,厚度150~200 km,表现出稳定大陆地块的性质.
(2)青藏高原地壳厚达70 km,中下地壳的平均S波速度明显低于正常大陆地壳,在中地壳20~40 km深度范围广泛存在速度逆转的低速层,这一低速层的展布范围与高原的范围相符.这些特征符合高原中下地壳在印度板块的北向挤压下发生塑性增厚和侧向流动的变形模式.
(3)青藏高原上地幔速度结构呈现与地壳显著不同的特点,并沿东西方向表现出明显的分段变化.在大约84°E以西的喀喇昆仑—帕米尔—兴都库什地区,印度板块的北向和亚洲板块的南向俯冲造成上地幔明显高速;84°E—94°E之间上地幔顶部速度较低,在大约150~220 km深度范围存在高速板片,有可能是俯冲的印度岩石圈,其前缘到达昆仑—巴颜喀拉之下;在喜马拉雅东构造结以北区域,存在显著的上地幔高速区,可能阻碍上地幔物质的东向运动.川滇西部岩石圈底界深度与扬子克拉通相似,约为180 km,但上地幔顶部速度较低.这些现象表明青藏高原岩石圈地幔的变形/运动方式可能与地壳有本质的区别.
| [1] | Barron J, Priestley K. 2009. Observations of frequency-dependent Sn propagation in Northern Tibet. Geophys. J. Int., 179(1): 475-488. |
| [2] | Bhattacharya S N, Suresh G, Mitra S. 2009. Lithospheric S-wave velocity structure of the Bastar Craton, Indian Peninsula, from surface-wave phase-velocity measurements. Bulletin of the Seismological Society of America, 99(4): 2502-2508. |
| [3] | Caldwell W B, Klemperer S L, Rai S S, et al. 2009. Partial melt in the upper-middle crust of the northwest Himalaya revealed by Rayleigh wave dispersion. Tectonophysics, 477(1-2): 58-65. |
| [4] | Chen Y, Badal J, Hu J F. 2010. Love and Rayleigh wave tomography of the Qinghai-Tibet Plateau and surrounding areas. Pure and Applied Geophysics, 167(10): 1171-1203. |
| [5] | Constable S C, Parker R L, Constable C G. 1987. Occam's inversion: A practical algorithm for generating smooth models from electromagnetic sounding data. Geophysics, 52(3): 289-300. |
| [6] | Dziewonski A M, Hales A L. 1972. Numerical analysis of dispersed seismic waves. Methods Comput. Phys., 11: 39-85. |
| [7] | Feng M, An M J. 2007. Middle and upper crust shear-wave velocity structure of the Chinese mainland. Acta Seismologica Sinica (in Chinese), 29(4): 337-347. |
| [8] | Guo Z, Gao X, Yao H J, et al. 2009. Midcrustal low-velocity layer beneath the central Himalaya and southern Tibet revealed by ambient noise array tomography. Geochem. Geophys. Geosyst., 10(5): Q05007, doi: 10.1029/2009GC002458. |
| [9] | Hanna A C, Weeraratne D S. 2013. Surface wave velocity structure of the western Himalayan syntaxis. Geophys. J. Int., 194(3): 1866-1877, doi: 10.1093/gji/ggt203. |
| [10] | Huang Z X, Peng Y J, Luo Y, et al. 2004. Azimuthal anisotropy of Rayleigh waves in East Asia. Geophys. Res. Lett., 31(15): L15617, doi: 10.1029/2004GL020399. |
| [11] | Huang Z X, Su W, Peng Y J, et al. 2003. Rayleigh wave tomography of China and adjacent regions. J. Geophys. Res.: Solid Earth (1978—2012), 108(B2): 2073, doi: 10.1029/2001JB001696. |
| [12] | Huang Z X, Li H Y, Xu Y. 2013. Lithospheric S-wave velocity structure of the North-South Seismic Belt of China from surface wave tomography. Chinese J. Geophys. (in Chinese), 56(4): 1121-1131, doi: 10.6038/cjg20130408. |
| [13] | Huang Z X, Zheng Y J. 1998. Occam's inversion of surface wave velocities. // Chen Y. Collected Papers for Celebrating 50 Years' Work of Academician Liu Guang-Ding (in Chinese). Beijing: Science Press, 692-702. |
| [14] | Jin S, Ye G F, Wei W B, et al. 2007. The electrical structure and fault feature of crust and mantle of western Tibet Plateau: Based on results of magnetotelluric survey along profile Zhada-Quanshuihu. Earth Science (Journal of China University of Geosciences) (in Chinese), 32(4): 474-480. |
| [15] | Kind R, Yuan X, Saul J, et al. 2002. Seismic images of crust and upper mantle beneath Tibet: evidence for Eurasian plate subduction. Science, 298(5596): 1219-1221. |
| [16] | Koulakov I, Sobolev S V. 2006. A tomographic image of Indian lithosphere break-off beneath the Pamir-Hindukush region. Geophys. J. Int., 164(2): 425-440. |
| [17] | Koulakov I, Bushenkova N. 2010. Upper mantle structure beneath the Siberian craton and surrounding areas based on regional tomographic inversion of P and PP travel times. Tectonophysics, 486(1-4): 81-100. |
| [18] | Kumar P, Yuan X H, Kind R, et al. 2006. Imaging the colliding Indian and Asian lithospheric plates beneath Tibet. J. Gophys. Res.: Solid Earth (1978—2012), 111(B6): B06308, doi: 10.1029/2005JB003930. |
| [19] | Li H Y, Li S, Song X D, et al. 2012. Crustal and uppermost mantle velocity structure beneath northwestern China from seismic ambient noise tomography. Geophys. J. Int., 188(1): 131-143, doi: 10.1111/j.1365-246X.2011.05205.x. |
| [20] | Li H Y, Su W, Wang C Y, et al. 2009. Ambient noise Rayleigh wave tomography in western Sichuan and eastern Tibet. Earth and Planetary Science Letters, 282(1-4): 201-211. |
| [21] | Liang X F, Sandvol E, Chen Y, et al. 2012. A complex Tibetan upper mantle: A fragmented Indian slab and no south-verging subduction of Eurasian lithosphere. Earth and Planetary Science Letters, 333-334: 101-111. |
| [22] | Matte P, Mattauer M, Olivet J M, et al. 1997. Continental subductions beneath Tibet and the Himalayan orogeny: a review. Terra Nova, 9(5-6): 264-270. |
| [23] | McNamara D E, Owens T J, Walter W R. 1995. Observations of regional phase propagation across the Tibetan Plateau. J. Geophys. Res.: Solid Earth (1978—2012), 100(B11): 22215-22229. |
| [24] | Mitra S, Priestley K, Gaur V K, et al. 2006. Shear-wave structure of the south Indian lithosphere from Rayleigh wave phase-velocity measurements. Bulletin of the Seismological Society of America, 96(4A): 1551-1559. |
| [25] | Pandey M R, Roecker S W, Molnar P. 1991. P-wave residuals at stations in Nepal: Evidence for a high velocity region beneath the Karakorum. Geophys. Res. Lett., 18(10): 1909-1912. |
| [26] | Peng Y J, Su W, Zheng Y J, et al. 2002. Love wave seismic tomography of China and vicinal sea areas. Chinese J. Geophysics. (in Chinese), 45(6): 792-801. |
| [27] | Priestley K, Debayle E, McKenzie D, et al. 2006. Upper mantle structure of eastern Asia from multimode surface waveform tomography. J. Geophys. Res.: Solid Earth (1978—2012), 111(B10): B10304, doi: 10.1029/2005JB004082. |
| [28] | Priestley K, Jackson J, McKenzie D. 2008. Lithospheric structure and deep earthquakes beneath India, the Himalaya and southern Tibet. Geophys. J. Int., 172(1): 345-362. |
| [29] | Rapine R, Tilmann F, West M, et al. 2003. Crustal structure of northern and southern Tibet from surface wave dispersion analysis. J. Geophys. Res.: Solid Earth (1978—2012), 108(B2): 2120, doi: 10.1029/2001JB000445. |
| [30] | Smith M L, Dahlen F A. 1973. The azimuthal dependence of Love and Rayleigh wave propagation in a slightly anisotropic medium. J. Geophys. Res., 78(17): 3321-3333. |
| [31] | Song Z H, An C Q, Chen G Y, et al. 1991. Study on 3D velocity structure and anisotropy beneath the west China from the Love wave dispersion. Acta Geophysica Sinica (in Chinese), 34(6): 694-707. |
| [32] | Su W, Peng Y J, Zheng Y J, et al. 2002. Crust and upper mantle shear velocity structure beneath the Tibetan Plateau and adjacent areas. Acta Geoscientia Sinica (in Chinese), 23(3): 193-200. |
| [33] | Suresh G, Jain S, Bhattacharya S N. 2008. Lithosphere of Indus Block in the Northwest Indian Subcontinent through Genetic Algorithm Inversion of Surface-Wave Dispersion. Bulletin of the Seismological Society of America, 98(4): 1750-1755. |
| [34] | Tapponnier P, Molnar P. 1976. Slip-line field theory and large-scale continental tectonics. Nature, 264(5584): 319-324. |
| [35] | Tapponnier P, Xu Z Q, Roger F, et al. 2001. Oblique stepwise rise and growth of the Tibet Plateau. Science, 294(5547): 1671-1677. |
| [36] | Tiberi C, Deschamps A, Déverchère J, et al. 2008. Asthenospheric imprints on the lithosphere in Central Mongolia and Southern Siberia from a joint inversion of gravity and seismology (MOBAL experiment). Geophys. J. Int., 175(3): 1283-1297. |
| [37] | Tilmann F, Ni J, Indepth III Seismic Team. 2003. Seismic imaging of the downwelling Indian lithosphere beneath central Tibet. Science, 300(5624): 1424-1427. |
| [38] | Vinnik L, Singh A, Kiselev S, et al. 2007. Upper mantle beneath foothills of the western Himalaya: subducted lithospheric slab or a keel of the Indian shield?. Geophys. J. Int., 171(3): 1162-1171. |
| [39] | Wang C Y, Han W B, Wu J P, et a1. 2007. Crustal structure beneath the eastern margin of the Tibetan plateau and its tectonic implications. J. Geophys. Res.: Solid Earth (1978—2012), 112(B7): (B07307), doi: 10.1029/2005JB00387. |
| [40] | Wang C Y, Lou H, Lu Z Y, et al. 2008. Crust and upper mantle S-wave velocity structure in the eastern part of Tibetan Plateau—The deep environment of lower crust flow. Science in China (Series D: Earth Sciences) (in Chinese), 38(1): 22-32. |
| [41] | Wei W B, Jin S, Ye G F, et al. 2009. Conductivity structure and rheological property of lithosphere in Southern Tibet inferred from super-broadband magmetotulleric sounding. Sci China Ser D-Earth Sci. (in Chinese), doi: 10.1007/s11430-010-0001-7. |
| [42] | Xu L L, Rondenay S, Van der Hilst R D. 2007. Structure of the crust beneath the Southeastern Tibetan Plateau from teleseismic receiver functions. Phys. Earth Planet. Int., 165(3-4): 176-193. |
| [43] | Yang Y J, Ritzwoller M H, Zheng Y, et al. 2012. A synoptic view of the distribution and connectivity of the mid-crustal low velocity zone beneath Tibet. J. Geophys. Res.: Solid Earth (1978—2012), 117(B4): B04303, doi: 10.1029/2011JB008810. |
| [44] | Yao H J, Beghein C, van der Hilst R D. 2008. Surface wave array tomography in SE Tibet from ambient seismic noise and two-station analysis— II. Crustal and upper-mantle structure. Geophys. J. Int., 173(1): 205-219, doi: 10. 11111/j.1365-246X.2007.03696.x. |
| [45] | Zhang P Z, Shen Z K, Wang M, et al. 2004. Continuous deformation of the Tibetan Plateau from global positioning system data. Geology, 32(9): 809-812. |
| [46] | Zhang R Q, Wu Q J, Li Y H, et al. 2008. SH-wave velocity structure in the upper mantle of western Qiantang of Tibetan Plateau. Chinese Science Bulletin (in Chinese), 53(19): 2335-2341. |
| [47] | Zhao G Z, Chen X B, Wang L F, et al. 2008. Evidence of crustal "channel flow" in the eastern margin of Tibetan Plateau from MT measurements. Chinese Science Bulletin (in Chinese), 53(3): 345-350. |
| [48] | Zhou B, Zhu J S, Chun K Y. 1991. Three-dimensional shear velocity structure beneath Qinhai-Tibet and its adjacent area. Acta Geophysica Sinica (in Chinese), 34(4): 426-441. |
| [49] | Zhou H W, Murphy M A. 2005. Tomographic evidence for wholesale underthrusting of India beneath the entire Tibetan plateau. Journal of Asian Earth Sciences, 25(3): 445-457. |
| [50] | Zhu J S, Cao J M, Cai X L, et al. 2002. High resolution surface wave tomography in East Asia and west Pacific marginal seas. Chinese J. Geophys. (in Chinese), 45(5): 646-664. |
| [51] | Zhuang Z, Fu Z W, Lu Z L, et al. 1992. 3-D shear velocity model of crust and upper mantle beneath the Tibetan Plateau and its adjacent regions. Acta Geophysica Sinica (in Chinese), 35(6): 694-709. |
| [52] | Zorin Y A, Mordvinova V V, Turutanov E K, et al. 2002. Low seismic velocity layers in the Earth's crust beneath Eastern Siberia (Russia) and Central Mongolia: receiver function data and their possible geological implication. Tectonophysics, 359(3-4): 307-327. |
| [53] | Zorin Y A, Turutanova E K, Mordvinova V V, et al. 2003. The Baikal rift zone: the effect of mantle plumes on older structure. Tectonophysics, 371(1-4): 153-173. |
| [54] | 冯梅, 安美建. 2007. 中国大陆中上地壳剪切波速结构. 地震学报, 29(4): 337-347. |
| [55] | 黄忠贤, 李红谊, 胥颐. 2013. 南北地震带岩石圈S波速度结构面波层析成像. 地球物理学报, 56(4): 1121-1131, doi: 10.6038/cjg20130408. |
| [56] | 黄忠贤, 郑月军. 1998. 面波速度的Occam反演. // 陈颐等. 刘光鼎院士工作50周年学术论文集. 北京: 科学出版社, 692-702. |
| [57] | 金胜, 叶高峰, 魏文博等. 2007. 青藏高原西缘壳幔电性结构与断裂构造: 札达-泉水湖剖面大地电磁探测提供的依据. 地球科学(中国地质大学学报), 32(4): 474-480. |
| [58] | 彭艳菊, 苏伟, 郑月军等. 2002. 中国大陆及海域Love波层析成像. 地球物理学报, 45(6): 792-801. |
| [59] | 宋仲和, 安昌强, 陈国英等. 1991. 中国西部三维速度结构及其各向异性. 地球物理学报, 34(6): 694-707. |
| [60] | 苏伟, 彭艳菊, 郑月军等. 2002. 青藏高原及其邻区地壳上地幔S波速度结构. 地球学报, 23(3): 193-200. |
| [61] | 王椿镛, 楼海, 吕智勇等. 2008. 青藏高原东部地壳上地幔S波速度结构—下地壳流的深部环境. 中国科学(D辑: 地球科学), 38(1): 22-32. |
| [62] | 魏文博, 金胜, 叶高峰等. 2009. 藏南岩石圈导电性结构与流变性—超宽频带大地电磁测深研究结果. 中国科学(D辑: 地球科学), 39(11): 1591-1606. |
| [63] | 张瑞青, 吴庆举, 李永华等. 2008. 青藏高原羌塘西部上地幔SH波速度结构的研究. 科学通报, 53(19): 2335-2341. |
| [64] | 赵国泽, 陈小斌, 王立凤等. 2008. 青藏高原东边缘地壳“管流” 层的电磁探测证据. 科学通报, 53(3): 345-350. |
| [65] | 周兵, 朱介寿, 秦建业. 1991. 青藏高原及邻近区域的S波三维速度结构. 地球物理学报, 34(4): 426-441. |
| [66] | 朱介寿, 曹家敏, 蔡学林等. 2002. 东亚及西太平洋边缘海高分辨率面波层析成像. 地球物理学报, 45(5): 646-664. |
| [67] | 庄真, 傅竹武, 吕梓龄等. 1992. 青藏高原及邻近地区地壳与上地幔剪切波三维速度结构. 地球物理学报, 35(6): 694-709. |
 2014, Vol. 57

