 2014, Vol. 57


2. 国家海洋局极地科学重点实验室, 中国极地研究中心, 上海 200136;
3. 南京航空航天大学, 南京 210016
2. SOA Key Laboratory for Polar Science, Polar Research Institute of China, Shanghai 200136, China;
3. Nanjing University of Aeronautics and Astronautics, Nanjing 210016, China
近20年来,通过理论和卫星观测,科研工作者 对亚暴期间磁场的宽频波动进行了大量研究(Holter et al., 1995; Lui and Najmi, 1997; Sigsbee et al., 2002; Shiokawa et al., 2005; Saito et al., 2008a,2008b; Lui et al., 2008). ULF 波,尤其是相对高频的Pi1(1~40 s)与相对低频的Pi2(40~100 s),在亚暴过程中发挥重要作用(Liang et al., 2009).大尺度的ULF波可耦合磁尾和电离层发生的物理过程.局域尺度上的ULF 波经常代表等离子体不稳定性模,可瞬时改变磁场位形比如亚暴膨胀相(EP,Expansion Phase)起始(Angelopoulos et al., 2008; 2009)及伴随的电流中断(CD,Current Disruption)(Kepko and Kivelson, 1999; Kepko et al., 2001; Sigsbee et al., 2002).
对于地磁脉动频率范围的ULF波,其起源和本质可以追溯到Saito(1969).各种类型的气球模不稳定性(Pu et al., 1997; Erickson et al., 2000; Cheng,2004;Satio et al., 2008a,2008b;Fu et al., 2013a)可以触发Pi2,横场(Cross-field)漂移不稳定性(Lui et al., 2008)可以触发Pi1和Pi2.磁尾爆发性整体流(Cao et al., 2006; Ma et al., 2009; Cao et al., 2012)及其振荡减速(Kepko et al., 2001)也可 以触发Pi2(Shiokawa et al., 1998; Kepko and Kivelson, 1999; Kepko et al., 2004; Volwerk et al., 2005; Kim et al., 2007;Cao et al., 2008),甚至决定了Pi2的性质. 最近研究发现,太阳风动压的脉动也可触发夜侧等离子体片内(Shi et al., 2013)及同步轨道处(Zhang et al., 2010)的ULF波.
Lui等(2008)用THEMIS卫星的磁场数据观测到了CD前的倒串级(inverse cascade)现象,即先观测到0.1Hz附近的高频Pi1,后观测到0.006~0.008 Hz的低频Pi2. 经过理论推导和数值分析,认为这个倒串级源于漂移驱动的电磁离子回旋不稳定性,可能是Weibel不稳定性的电磁模,或者是类似于横场离子漂移不稳定性驱动的寻常模(Lui et al., 1991; Yoon et al., 1992). Liang等(2009)观测到了亚暴EP起始前及整个EP期间的低频Pi2,及高频Pi1在EP起始后几十秒内出现,在当地CD期间增强,之后衰减.Pi1之所以出现在EP起始后,可能是因为薄电流片(TCS,Thin Current Sheet)模的传播效应(Liu,2009).
理想和Hall MHD理论预测气球模不稳定性要求β(等离子体热压与磁压的比)初始值~1(Pu et al., 1997),但是动理学剧烈的稳定效应使得不稳定性阈值β超过20(Saito et al,2008a),甚至偶极化/电流中断起始前升至50(Cheng and Lui, 1998; Fu et al., 2011; 2012; 2013b). Ji和Wolf(2003a;2003b))发现快速地向对流期间,水龙管(firehose)不稳定性触发了Pi2频段的波动,而热压力(或温度)各向异性可以引起水龙管不稳定性(Horton et al., 2004).Volwerk 等(2003) 统计发现:频率为0.08~1 Hz压缩波的功率,强烈地依赖于等离子体流速的峰值;推测流(stream)不稳定性可能是引起此频段波的源.
CD期间观测到从Pi2至高于离子回旋频率的宽带波活动,其光谱特征表明不同频率的多种等离子体不稳定性在当地CD期间共存(Liang et al., 2009),比如气球模,TCS模和电流横场不稳定性(CCI,Current Cross-field Instability).这些不稳定性可以由高β、压力(温度)各向异性、等离子体快速对流引起,但是EP或者CD期间哪一种或者几种物理参数起作用是我们需要进一步研究的内容.本文基于TC-1卫星在近地观测到高速流期间的Pi2和Pi1,研究高β,压力(温度)各向异性,等离子体快速对流在其演化过程中的作用.2 仪器及数据
我们使用了TC-1(Liu et al., 2005)上搭载的FGM(Flux Gate Magnetometers)的磁场数据(Carr et al., 2005),HIA(Hot Ion Analysis)的等离子体数据(Rème et al., 2005). TC-1卫星轨道的倾角为28°,近地点为570 km,远地点为79000 km(大约13.4RE),卫星自旋周期为4 s. 在2004年和2007年的 7月到10月,TC-1运行在地球磁尾,多次穿越近地等离子体片,为研究近地ULF波提供了很好的机会.本文针对发生在2004年8月3日03 ∶ 00 到03 ∶ 30 UT,TC-1观测到的伴随着高速流的ULF波进行分析.3 事件分析
为了研究高β、压力(温度)各向异性、等离子体快速对流在ULF波演化中可能发生的作用,图 1给 出了磁场观测到ULF前后(2004年8月3日02 ∶ 50 到03 ∶ 30UT)TC-1卫星在GSM坐标系下观测到的等 离子体和磁场数据,期间TC-1卫星在日地连线方向上位于(-11~12)RE处.从02 ∶ 50UT 到03 ∶ 10UT,等离子体的密度ni、流速Vx、Vy、Vz和β比较小,磁场Bx、By比较强,Bz比较小,卫星位于等离子体片南侧(Bx为负),垂直于磁场的温度T⊥明显地大于平行温度T//.03 ∶ 10—03 ∶ 30UT,等离子体密度急剧增加,离子流速度从小于50 km·s-1到接近300 km·s-1,β从小于0.5增大到37,卫星从等离子体片的南侧穿越边界层向着中心等离子体片运动.从磁场Bx分量的极性变化可以看出,TC-1在03 ∶ 18UT附近到03 ∶ 30UT多次穿越中性片,流速Vx变小,并从初始的地向变为地向和尾向的多次转换,对应于地向高速流的振荡减速. 如果考虑到 TC-1的运行速度很慢(大约1 km·s-1),综合卫星观测可以看出,高速流前后也就是从03 ∶ 10—03 ∶ 20UT,等离子体片内的磁场位形和等离子体参数都发生了剧烈变化.
 | 图 1 2004年8月3日02 ∶ 50 到03 ∶ 30 UT,TC-1卫星观测到的GSM坐标系下4 s分辨率的等离子体和磁场数据Fig. 1 Data of the panels are plasma and magnetic parameters at 4 s resolution in GSM coordinates obtained from TC-1 for the period 02 ∶ 50 to 03 ∶ 30 UT on 3 August 2004 |
为了方便与理论模型进行对比分析,图 2给出了2004年8月3日03 ∶ 00到03 ∶ 30UT,将TC-1卫星观测到的磁场三分量,转换到MFA(Mean Field Aligned)坐标系下(Fu et al., 2009;Park et al., 2010)的功率谱密度(PSD,Power Spectral Density),白色曲线为0.1Ωi(离子回旋频率). 三分量分别为沿着平均磁场即平行于磁场的 e 1(FBparallel),垂直于平均磁场和卫星相对于地心位置矢量 e 2(FBmeridional),完成右手坐标系的另一个分量 e 3= e 1× e 2(FBzonal).高速流及其振荡减速期间,垂直于平均磁场FBmeridional(图 2a)的PSD明显增强,增强频率(峰值频 率为0.018 Hz)小于离子回旋频率(0.10~0.52 Hz),位于Pi2频段.另一个垂直于平均磁场方向FBzonal(图 2b)的PSD,只是在高速流的速度比较大时略有增强,强度相对较小;频率(峰值频率为0.037 Hz)也小于离子回旋频率(0.10~0.52 Hz),位于Pi1频段.在03 ∶ 11―03 ∶ 13UT和03 ∶ 15―03 ∶ 17UT期间,平行于磁场方向FBparallel(图 2c)的PSD明显增强,频率在0.01~0.1 Hz之间(峰值频率为0.022 Hz),小于离子回旋频率,位于Pi1频段.平行平均磁场方向的PSD(峰值为304 nT2Hz-1)比两个垂直磁场方向的大两倍多(107 nT2Hz-1,FBmeridional),甚至一个数量级(25 nT2Hz-1,FBzonal).可以看出在高速流的速度比较大时,垂直(FBzonal)和平行(FBparallel)于平均磁场的PSD都明显地大于高速流振荡减速时的PSD.
 | 图 2 2004年8月3日03 ∶ 00 UT到03 ∶ 30 UT,TC-1观测到的磁场在MFA坐标系下PSD的三分量,白色线代表 0.1ΩiFig. 2 Power spectral densities of the magnetic field in MFA coordinates from TC-1 for the period 03 ∶ 00 UTto 03 ∶ 30 UT on Aug 3,2004. The white line represents tenth of the ion cyclotron frequency |
结合图 2和图 1可以看出在磁场PSD增强期 间,平行和垂直于磁场的温度及其相对大小与增强前明显不同:没有增强时,垂直于磁场的温度大于平行于磁场的温度;而增强期间垂直于磁场的温度与平行于磁场的温度相当,甚至明显小于平行于磁场的温度.PSD增强期间等离子体的流速与没有增强时也明显不同,增强期间流速显著增大或振荡减速,没有增强时流速很小. 因此我们首先考察这些磁场的PSD增强是否由当地不稳定性激发.Lui等(2008)给出了一个完全磁化离子横场漂移驱动不稳定性的理论模型,包含了垂直传播和平行传播两种情况,不稳定性激发波的频率略低于离子回旋频率或者仅为其一小部分.首先来看垂直时不稳定性的情况,其色散关系方程(1)如下,详细推导请见Lui等(2008)的附录A和其文中的方程(7).
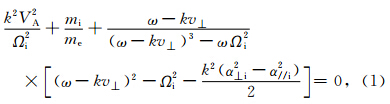
为了判断卫星观测中哪些物理参数影响Lui等(2008)模型中的不稳定性,我们将方程(1)无量纲化,并取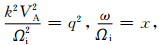 则方程(1)可变形为
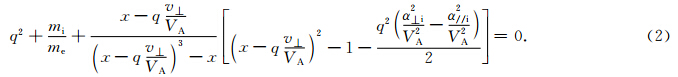
 当α⊥i2>α//i2也就是T⊥i>T//i,方程(3)的计算结果中没有不稳定性出现,只有T⊥i
 另一方面对于有离子横场漂移温度各向同性时,也就是v⊥≠0,T⊥i=T//i时,方程(1)经过如上过程的无量纲后,并令a= 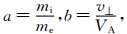 ,则色散方程可简化为
由于a是个常数,方程(4)是否有不稳定出现,主要取决于b=v⊥ /VA大小. 对方程(4)进行数值计算后发现,当v⊥ /VA<0.3时,不稳定性基本上不增长.图 3给出了两种v⊥ /VA时,色散方程(4)出现不稳定性增长的情况.图 3a为v⊥=0.3VA时,不稳定性增长也就是虚线给出的Im(x)>0,激发波的频率为实线给出的Re(x)<0.图 3b为v⊥=0.8VA时,随着不稳定性增长率变大,激发波频率从负值 增加到接近离子回旋频率.通过如上的数值计算可 以看出存在离子横场漂移而温度各向同 性时,不稳定性增长率和激发波频率依赖于v⊥ /VA. 为此,我们需要检查卫星观测中,离子横场漂移速度的平均值(即卫星观测到的垂直流速v⊥)和局域Alfvén速度(VLA,由卫星观测的密度和磁场给出)的比值大小v⊥ /VLA.
 | 图 3 温度各向同性两种离子横场漂移速度下寻常O模色散方程的数值解 归一化ω/Ωi后的实部(Re(x))和虚部(Im(x))分别用实线和虚线表示. Fig. 3 Numerical solution of the dispersion equation for the O mode drift instability in two cases of ion cross- field drift with temperature isotropy The real(Re(x)) and imaginary(Im(x))parts of normalized ω are shown in solid and dashed,respectively. |
基于垂直传播时方程(3)和方程(4)的数值分析结果,我们将卫星的观测与理论模型进行对比,图 4给出了相应的参数.PSD增强前,图 4给出的β///β⊥基本上都小于1(只有一个时刻大于1),也就是说大部分时候β//<β⊥.PSD增强期间,β//和β⊥ 明显增大,甚至超过了10. 而且PSD增强期间,β//>β⊥,甚至短暂地满足了水龙管不稳定性要求的β//-β⊥>2.从这里可以看出,卫星观测结果与方程(4)数值计算结果大致趋势一致:平行温度大于垂直温度的温度各向异性形成不稳定性,可激发垂直传播的低频波.另一方面垂直分量的PSD增强前,等离子体横场流速与当地Alfvén速度的比v⊥ /VLA一直都小于0.1(图 4底栏虚线所示). PSD增强期间,v⊥ /VLA急剧增大,达到了0.3(图 4中底栏虚点线所示),可以产生垂直传播时离子横场漂移不稳定性;甚至有两个时刻超过0.8接近1,可以较好地解释PSD增强期间频率的宽频段.
 | 图 4 由TC-1观测到的等离子体和磁场数据计算出的参数:平行和垂直磁场的等离子体(β//,β⊥),平行和垂直磁场的等 离子体β比值(β// ∕ β⊥),平行和垂直磁场的等离子体β差(β//-β⊥),等离子体垂直流速与当地Alfvén速度比值(V⊥ /VLA)Fig. 4 Calculated parameters with plasma and magnetic data observed by TC-1: perpendicular and parallel plasma beta(β//,β⊥),ratio of the parallel plasma beta to the perpendicular plasma beta(β// ∕ β⊥),difference of the parallel plasma beta from the perpendicular plasma beta(β//-β⊥),ratio of the perpendicular ion velocity to the Local Alfvén speed(V⊥ /VLA) |
需要注意的是,图 2给出的PSD增强最初发生 在03 ∶ 10 UT附近,也就是卫星从南尾瓣,穿越等离 子体边界层进入等离子体片时,而卫星观测到v⊥ /VLA>0.3却出现在03 ∶ 10 UT之后.考虑到不稳定性激发波动需要一定的时间,可以推测03 ∶ 10 UT附近卫星最初观测到的PSD增强,并非由当地不稳定性激发,而可能是由卫星穿越等离子体边界层进入等离子体片过程中磁场的变化造成(Eastman et al., 1984; Duan et al., 2004;Takada et al., 2005).结合图 1可以看出,卫星穿越边界层大致上可以 分为两个过程:(1)从03 ∶ 09 ∶ 30 UT 到03 ∶ 11 ∶ 30 UT,卫星测到的Bx分量从―28 nT变化到―22 nT;(2)从03 ∶ 11 ∶ 30 UT到03 ∶ 12 ∶ 00 UT,卫星测到的Bx分量从―22 nT变化到―5 nT.在第一个过程中,磁场的变化较为平缓,这个变化在傅里叶频谱图上体现为一个“低频”(0.004~0.015 Hz)信 号;在第二个过程中,磁场的变化较为剧烈,该变化在傅里叶频谱图上体现为一个“高频”(0.015~0.1 Hz)信号.因此,图 2中的“低频”信号是在穿越边界层的第一个过程中(03 ∶ 10 UT)观测到的;图 2中的“高频”信号是在穿越边界层的第二个过程中(03 ∶ 12 UT)观测到的.
比较理论模型给出的数值计算结果和卫星观测到的v⊥/VLA可以看出,有离子横场漂移温度各向同性时是否出现不稳定性,以及激发波的频段都依赖于v⊥/ VLA.
鉴于垂直PSD增强的卫星观测与Lui等(2008)的垂直传播模型符合得比较好,我们也对Lui等(2008)的平行传播理论模型进行数值计算,并与卫星观测结果进行对比分析.为此先引入Lui等(2008)的双流线性化理论中波平行传播的第一种情况,即无离子横场漂移温度各向异性引起的不稳定情况,左旋圆极化Alfvén 离子回旋模的色散关系方程(5),详细的推导请见Lui等(2008)的附录A及其文中方程(1)和(2).

 则方程(5)可变形为
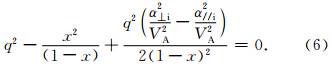
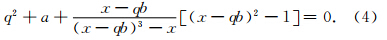
从方程(6)可以看出,是否出现不稳定性主要取 决于α⊥i与α//i的大小及二者相对于VA的大小.图 5给出了卫星观测到的相应参数.
 | 图 5 由TC-1观测到的等离子体和磁场数据计算出的参数,从上到下依次为:垂直于磁场的热速度与当地Alfvén速度的比值,平行于磁场的热速度与Alfvén速度的比值,垂直磁场热速度与平行磁场热速度的比值,等离子体垂直流速与当地Alfvén速度比值 Fig. 5Calculated parameters with plasma and magnetic data observed by TC-1,from top to bottom are: ratio of the perpendicular thermal speed to the local Alfvén speed,ratio of the parallel thermal speed to the local Alfvén speed,ratio of the perpendicular thermal speed to the parallel thermal speed,ratio of the perpendicular ion velocity to the local Alfvén speed |
对于平行传播,当垂直于磁场的离子热速度α⊥i小于等于平行于磁场的离子热速度α//i时,也就是垂直磁场温度小于等于平行磁场温度时,不稳定性不增长.为了更详细地将卫星观测与理论模型做比较,我们分α⊥i大于α//i的两种情况讨论方程(6).第一种情况为α⊥i和α//i小于VLA,即图 2中PSD明显增强前,也就是图 5中阴影部分之前的区域.第二种情况为α⊥i和α//i大于VLA,即图 2中PSD明显增强时,也就是图 5中阴影部分及之后的区域.第一种情况下也就是从03 ∶ 00 UT到03 ∶ 10 UT,α⊥i/VLA和α//i/VLA值都比较恒定,分别取α⊥i/VLA的平均值0.407078,α//i/VLA的平均值0.357543代入方程(6),计算结果如图 6a所示.图 6a的虚线代表增长率,实线代表激发波频率.可以看出当q>1.6时,不稳定性增长,激发波频率略低于Ωi,此为温度各 向异性引起的电磁离子回旋不稳定性. 增长率随频率增加而增大,随平行温度与垂直温度比值增加而减小.
第二种情况下,由于α⊥i/VLA和α//i/VLA变化剧烈,我们取阴影部分中某一时刻卫星的测量值,α⊥i/VLA为2.86647,α//i/VLA为2.57129代入方程(6),计算结果如图 6b所示. 从图 6b可以看出当q>0.4时,不稳定性已开始增长,且随激发波频率增加,不稳定性增长率增大.
 | 图 6 数值计算给出的垂直温度大于平行温度无离子漂移时,电磁离子回旋不稳定性的色散关系图 相对于归一化的波数q=kVA/Ωi,归一化的实部频率(实线)Re(x)=Re(ω/Ωi)和虚部频率(虚线)Im(x)=Im(ω/Ωi).Fig. 6 Numerical solutions of the dispersion equation for the electromagnetic ion cyclotron instability when the temperature perpendicular to the magnetic field is larger than that of the parallel temperature without ion drift The real(Re(x)) and imaginary(Im(x))parts of normalized w are shown in solid and dashed,respectively. |
再来比较上述两种情况下温度的各向异性,也就是T⊥i/T//i=α2⊥i/α2//i.第一种为1.29628,大于第二种的1.24278.图 6a计算出不稳定性开始增长的频率明显大于图 6b的,也就是说,第一种情况下不稳定性增长时激发的波频段比较窄,只能激发较高频率的波;而第二种情况下不稳定性增长时激发 的波频段比较宽,从比较低的频率直到接近Ωi.值 得注意的是第二种情况给出的不稳定性增长率在频率较低时就可以达到甚至明显超过第一种的不稳定性增长率,例如当q=2.0时,第二种情况给出的不稳定增长率约是第一种的十倍.
通过比较垂直温度大于平行温度的第一种和第二种情况可以看出:离子热速度大于VLA比离子热速度小于VLA更容易出现不稳定性;且不稳定性增长率随着α⊥i/VLA比值增大而增大,激发波的频段随着α⊥i/VLA比值增大而变宽.
接着引入平行传播时另一种情况下的色散方程,即温度各向同性有横场漂移的色散方程(7),详 细推导请见Lui 等(2008)的附录A及其文中方程(4).
 则方程(7)可变形为
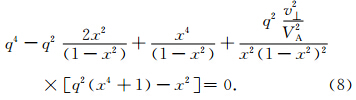
从方程(8)很容易看出,方程的数值解只依赖于v⊥ /VA的大小.基于图 6底栏卫星测量计算出的v⊥ /VLA可以看出,v⊥ /VLA大部分时候小于1甚至小于0.1.为此我们分别取v⊥ /VA=0.1,0.2,0.4,0.5,0.8代入方程(8)进行数值计算,图 7给出了相应的计算结果,实线代表实部(Re(x)),虚线代表虚部(Im(x)).
当v⊥ /VA≤0.1时,从图 7a可以看出虚线给出的增长率小于等于0,也就是无不稳定性出现.横场漂移速度v⊥远小于VA的数值计算结果,与图 2观测给出的PSD没有明显增强相符.
 | 图 7 数值计算出温度各向同性有离子漂移时,电磁离子回旋不稳定性的色散关系图 相对于归一化的波数q=kVA/Ωi,归一化的实部频率(实线)Re(x)=Re(ω/Ωi)和虚部频率(虚线)Im(x)=Im(ω/Ωi). Fig. 7 Numerical solutions of the dispersion equation for the electromagnetic ion cyclotron instability in the case of ion drift with temperature isotropy The real(Re(x)) and imaginary(Im(x))parts of normalized ω are shown in solid and dashed,respectively. |
当v⊥ /VA=0.2时,从图 7b可以看出,有零实频率的纯增长模出现,相当于离子韦贝尔不稳定性(ion-Weibel instability),这是Lui 等(1991)给出的横场电流不稳定性模.
当v⊥ /VA=0.4时,从图 7c可以看出,除了有离子韦贝尔不稳定性模,还出现了实频率略低于离子回旋频率的左旋离子回旋模(q>1.8时).
当v⊥ /VA=0.5时,从图 7d可以看出,不但出现了离子韦贝尔不稳定模和离子回旋模,后者还出现了两个分支.q>1.4的分支即为图 7c中的左旋离子回旋模,而位于q≈0.7附近极窄频的分支为右旋磁声和左旋Alfvén离子回旋的耦合.
当v⊥ /VA=0.8时,从图 7e可以看出,不稳定性模的类型与图 7d相似.而对于离子韦贝尔不稳定模,增长率明显变大.离子回旋模仍然有两个分支:只是左旋离子回旋模在q≈0.8附近就已开始出现;右旋磁声波和左旋Alfvén离子回旋耦合的另一分支出现在较宽频段0.5 通过对伴随着高速流的ULF波的近地卫星观测和数值计算比较分析,我们发现磁化离子横场漂移不稳定性模型(Lui et al., 2008),可以很好地解释尤其是垂直传播时,卫星观测到的伴随着高速流的PSD增强.具体结论如下: (1)高速流期间MFA坐标系下垂直和平行分量的PSD都明显增强,平行方向的振幅明显大于垂直方向的,垂直和平行方向PSD增强对应的频率约为0.1Ωi. (2)在垂直方向,PSD增强对应的频段,与使用卫星数据带入色散方程计算出不稳定性增长频段符合的比较好.卫星观测到PSD增强期间β// >β⊥,甚至短暂地出现了β//-β⊥>2的水龙管不稳定性.模型计算中v⊥ /VA对离子横场漂移引起不稳定性的增长率和激发波频率产生重要影响,与之对应卫星观测的v⊥ /VLA使增长率变大激发波频段变宽.当v⊥ /VA超过0.3甚至接近1时频率从负拓宽至接近离子回旋频率. (3)在平行方向,PSD增强对应的频段一直低于将卫星数据带入色散方程的计算结果.由温度各向异性引起的不稳定性增长率和激发频率更多地依赖于α⊥i/VA和α//i/VA.当两者的比值大于1时,增长率变大,激发波频段变宽. 由离子横场漂移引起的不稳定性则与v⊥ /VA密切相关.v⊥ /VA比较小时(比如小于等于0.1)无不稳定性,或者只出现纯增长零频率的韦贝尔不稳定性(比如0.2).随着v⊥ /VA进一步增大(比如0.4),韦贝尔和回旋不稳定性同时出现,回旋不稳定性甚至会出现两个分支(比如0.5). 当v⊥ /VA大到一定值甚至进一步增大(比如为0.8)时,无新的不稳定模出现,但韦贝尔不稳定性和回旋不稳定性的增长率都变大,回旋不稳定性两个分支激发波的频段明显变宽. 注意到PSD增强时,等离子体流速比较大,那么卫星观测到的PSD增强对应的频率还需进一步考虑多普勒频移效应.由于只有TC-1单颗卫星的观测,我们无法准确地做多普勒频移,但是对于垂直方向可以进行大体估计:考虑到垂直方向上数值计算给出的频带比较宽可以从负拓宽至接近离子回旋频率,即使考虑多普勒效应后,卫星观测与数值计算结果也可能符合的很好.而对于平行方向就很难粗略估计:因为如果多普勒频移后频率变大,则有可能接近数值计算结果;如果多普勒频移后频率进一步变小,那么与数值计算结果的偏差就可能更大. 对于平行传播时,模型给出的不稳定性激发波频率略高于卫星观测中PSD增强时的频率.高速流期间,TC-1观测位于XGSM~-12RE处,使用位于XGSM~-8RE处THEMIS卫星的观测,CD期间观测到了离子回旋频率附近的波动增强(Lui et al., 2008);也观测到了从Pi2到高于离子回旋频率的宽频波动(Liang et al., 2009). 高速流期间和CD期间,PSD增强频带在垂直传播上频率接近,而在平行传播上的不同是由于磁尾不同位置处的传播效应(Liu and Liang, 2009),还是由于局地磁场位形和流场的不同,亦或是兼而有之,都是需要考虑的因素. 值得注意的是Lui 等(2008)的理论模型中主要考虑横场漂移不稳定性也就是垂直磁场的流速,未考虑平行磁场的离子流速,理论模型中是否需要借鉴同步轨道处(Pu et al., 1997)漂移气球模不稳定性的研究,同时考虑平行和垂直磁场的等离子体流对不稳定性的影响,是值得尝试的研究内容. 最后需说明的是本文只是一个事例研究,近地TC-1卫星的磁场仪器观测到了ULF波,等离子体仪器观测到了高速流,将观测数据带入Lui等(2008)的理论模型数值计算后发现温度各向异性和高速流垂直磁场的分量可以产生不稳定性激发ULF波.而且如果进一步考虑到不稳定性激发波的时间,亚暴增长相后期和膨胀相期间尤其是卫星观测到高速流后磁尾等离子体片磁场位形和流场剧烈变化,不稳定性激发波的卫星观测与理论对比工作还需要进行统计研究.
| [1] | "Angelopoulos V, McFadden J P, Larson D, et al. 2008. Tail reconnection triggering substorm onset. Science, 321(5891): 931-935, doi: 10.1126/science.1160495. |
| [2] | Angelopoulos V, McFadden J P, Larson D, et al. 2009. Response to comment on ""Tail Reconnection Triggering Substorm Onset"". Science, 324(5933): 1391. |
| [3] | Cao J B, Ma Y D, Parks G, et al. 2006. Joint observations by Cluster satellites of bursty bulk flows in the magnetotail. J. Geophys. Res., 111(A4): A04206, doi: 10.1029/2005JA011322. |
| [4] | Cao J B, Duan J T, Du A M, et al. 2008. Characteristics of middle- to low-latitude Pi2 excited by bursty bulk flows. J. Geophys. Res., 113(A7): A07S15, doi: 10.1029/2007JA012629. |
| [5] | Cao J B, Wang Z Q, Ma Y D, et al. 2012. Differences between onset times of bursty bulk flows (BBFs) of two Cluster satellites in the magnetotail. Sci. China Tech. Sci., 55(5): 1178-1183. |
| [6] | Carr C, Brown P, Zhang T L, et al. 2005. The Double Star magnetic field investigation: instrument design, performance and highlights of the first year's observations. Ann. Geophys., 23: 2713-2732. |
| [7] | Cheng C Z. 2004. Physics of substorm growth phase, onset, and dipolarization. Space Sci. Rev., 113(1-2): 207-270. |
| [8] | Cheng C Z, Lui A T Y. 1998. Kinetic ballooning instability for substorm onset and current disruption observed by AMPTE/CCE. Geophys. Res. Lett., 25(21): 4091-4094, doi: 10.1029/1998GL900093. |
| [9] | Duan S P, Li Z Y. 2004. The kinetic Alfven wave driven by the density inhomogeneity and the magnetic field inhomogeneity in finite β plasma. Chinese Journal of Space Science, 24(4): 253-260. |
| [10] | Eastman T E, Frank L A, Peterson W K, et al. 1984. The plasma sheet boundary layer. J. Geophys. Res., 89(A3): 1553-1572. |
| [11] | Erickson G M, Maynard N C, Burke W J, et al. 2000. Electromagnetics of substorm onsets in the near-geosynchronous plasma sheet. J. Geophys. Res., 105(A11): 25265-25290. |
| [12] | Fu H S, Cao J B, Yang B, et al. 2009. ULF waves associated with solar wind deceleration in the earth's foreshock. Chinese Phys.Lett.,26(11):119402,doi:10.1088/0256-307X/26/11/119402. |
| [13] | Fu H S, Khotyaintsev Y V, André M, et al. 2011. Fermi and betatron acceleration of suprathermal electrons behind dipolarization fronts. Geophys. Res. Lett., 38(16): L16104,doi:10.1029/2011GL048528. |
| [14] | Fu H S, Khotyaintsev Y V, Vaivads A, et al. 2012. Pitch angle distribution of suprathermal electrons behind dipolarization fronts: A statistical overview. J. Geophys. Res., 117(A12): A12221, doi: 10.1029/2012JA018141. |
| [15] | Fu H S, Khotyaintsev Y V, Vaivads A, et al. 2013a. Energetic electron acceleration by unsteady magnetic reconnection. Nature Physics, 9(7): 426-430, doi: 10.1038/nphys2664. |
| [16] | Fu H S, Cao J B, Khotyaintsev Y V, et al. 2013b. Dipolarization fronts as a consequence of transient reconnection: In situ evidence. Geophys. Res. Lett., 40(23): 6023-6027, doi: 10.1002/2013GL058620. |
| [17] | Holter Ø, Altman C, Roux A, et al. 1995. Characterization of low frequency oscillations at substorm breakup. J. Geophys. Res., 100(A10): 19109-19119. |
| [18] | Horton W, Xu B Y, Wong H V, et al. 2004. Nonlinear dynamics of the firehose instability in a magnetic dipole geotail. J. Geophys. Res., 109(A9): A09216, doi: 10.1029/2003JA010288. |
| [19] | Ji S, Wolf R A. 2003a. Double-adiabatic MHD theory for motion of a thin magnetic filament and possible implications for bursty bulk flows. J. Geophys. Res., 108(A5): 1191, doi: 10.1029/2002JA009655. |
| [20] | Ji S, Wolf R A. 2003b. Firehose instability near substorm expansion-phase onset? Geophys. Res. Lett., 30(24): 2242, doi: 10.1029/2003GL017981. |
| [21] | Kepko L, Kivelson M. 1999. Generation of Pi2 pulsations by bursty bulk flows. J. Geophys. Res., 104(A11): 25021-25034, doi: 10.1029/1999JA900361. |
| [22] | Kepko L, Kivelson M G, Yumoto K. 2001. Flow bursts, braking, and Pi2 pulsations. J. Geophys. Res., 106(A2): 1903-1905, doi: 10.1029/2000JA000158. |
| [23] | Kepko L, Kivelson M G, McPherron R L, et al. 2004. Relative timing of substorm onset phenomena. J. Geophys. Res., 109(A4): A04203, doi: 10.1029/2003JA010285. |
| [24] | Kim K H, Takahashi K, Lee D H, et al. 2005. Pi2 pulsations associated with poleward boundary intensifications during the absence of substorms. J. Geophys. Res., 110(A1): A01217, doi: 10.1029/2004JA010780. |
| [25] | Liang J, Liu W W, Donovan E F, et al. 2009. In-situ observation of ULF wave activities associated with substorm expansion phase onset and current disruption. Ann. Geophys., 27: 2191-2204, doi: 10.5194/angeo-27-2191-2009. |
| [26] | Liu Z X, Escoubet C P, Pu Z Y, et al. 2005. The Double Star mission. Ann. Geophys., 23: 2707-2712. |
| [27] | Liu W W, Liang J. 2009. Disruption of magnetospheric current sheet by quasi-electrostatic field. Ann. Geophys., 27: 1941-1950. |
| [28] | Lui A T Y, Chang C L, Mankofsky A, et al. 1991. A cross-field current instability for substorm expansions. J. Geophys. Res., 96(A7): 11389-11401, doi: 10.1029/91JA00892. |
| [29] | Lui A T Y, Najmi A H. 1997. Time-frequency decomposition of signals in a current disruption event. Geophys. Res. Lett., 24(24): 3157-3160. |
| [30] | Lui A T Y, Yoon P H, Mok C, et al. 2008. Inverse cascade feature in current disruption. J. Geophys. Res., 113(A1): A00C06, doi: 10.1029/2008JA013521. |
| [31] | Lui A T Y. 2009. Comment on ""Tail Reconnection Triggering Substorm Onset"". Science, 324(5933): 1391. |
| [32] | Ma Y D, Cao J B, Nakamura R, et al. 2009. Statistical analysis of earthward flow bursts in the inner plasma sheet during substorms. J. Geophys. Res., 114(A7): A07215, doi: 10.1029/2009JA014275. |
| [33] | Park J, Lühr H, Stolle C, et al. 2010. Field-aligned current associated with low-latitude plasma blobs as observed by the CHAMP satellite. Ann. Geophys., 28: 697-703, doi: 10.5194/angeo-28-697-2010. |
| [34] | Pu Z Y, Korth A, Chen Z X, et al. 1997. MHD drift ballooning instability near the inner edge of the near-Earth plasma sheet and its application to substorm onset. J. Geophys. Res., 102(A7): 14397-14406. |
| [35] | Rème H, Dandouras I, Aoustin C, et al. 2005. The HIA instrument on board the Tan Ce 1 double star near-equatorial spacecraft and its first results. Ann. Geophys., 23: 2757-2774. |
| [36] | Saito M H, Miyashita Y, Fujimoto M, et al. 2008a. Modes and characteristics of low-frequency MHD waves in the near-Earth magnetotail prior to dipolarization: Fitting method. J. Geophys. Res., 113(A6): A06201, doi: 10.1029/2007JA012778. |
| [37] | Saito M H, Miyashita Y, Fujimoto M, et al. 2008b. Ballooning mode waves prior to substorm-associated dipolarizations: Geotail observations. Geophys. Res. Lett., 35(7): L07103, doi: 10.1029/2008GL033269. |
| [38] | Saito T. 1969. Geomagnetic pulsations. Space Science Reviews, 10(3): 319-412. |
| [39] | Shi Q Q, Hartinger M, Angelopoulos V, et al. 2013.THEMIS observations of ULF wave excitation in the nightside plasma sheet during sudden impulse events. J. Geophys. Res., 118(1): 284-298. |
| [40] | Shiokawa K, Baumjohann W, Haerendel G, et al. 1998. High-speed ion flow, substorm current wedge, and multiple Pi2 pulsations. J. Geophys. Res., 103(A3): 4491-4507, doi: 10.1029/97JA01680. |
| [41] | Shiokawa K, Shinohara I, Mukai T, et al. 2005. Magnetic field fluctuations during substorm-associated dipolarizations in the nightside plasma sheet around X=-10RE. J. Geophys. Res., 110(A5): A05212, doi: 10.1029/2004JA010378. |
| [42] | Sigsbee K, Cattell C A, Fairfield D, et al. 2002. Geotail observations of low-frequency waves and high-speed earthward flows during substorm onsets in the near magnetotail from 10 to 13 RE. J. Geophys. Res., 107(A7): SMP 27-1-SMP 27-16, doi: 10.1029/2001JA000166. |
| [43] | Takada T, Seki K, Hirahara M, et al. 2005. Statistical properties of low-frequency waves and ion beams in the plasma sheet boundary layer: Geotail observations. J. Geophys. Res., 110(A2), doi: 10.1029/2004JA010395. |
| [44] | Volwerk M, Nakamura R, Baumjohann W, et al. 2003. A statistical study of compressional waves in the tail current sheet. J. Geophys. Res., 108(A12): 1429, doi: 10.1029/2003JA010155. |
| [45] | Volwerk M, Zhang T L, Nakamura R, et al. 2005. Plasma flow channels with ULF waves observed by Cluster and Double Star. Ann. Geophys., 23: 2929-2935. |
| [46] | Yoon P H. 1992. Quasilinear evolution of Alfvén-ion-cyclotron and mirror instabilities driven by ion temperature anisotropy. Phys. Fluids B, 4(11): 3627-3637, doi: 10.1063/1.860371. |
| [47] | Zhang X Y, Zong Q G, Wang Y F, et al. 2010. ULF waves excited by negative/positive solar wind dynamic pressure impulses at geosynchronous orbit. J. Geophys. Res., 115(A10): A10221, doi: 10.1029/2009JA015016." |