 2014, Vol. 57


2. 西北核技术研究所, 西安 710024;
3. 蒙城地球物理国家野外科学观测研究站, 合肥 230026;
4. 中国科学院测量与地球物理研究所, 大地测量与地球动力学国家重点实验室, 武汉 430077;
5. 中国地震局地球物理研究所, 北京 100081;
6. 中国地震局地震预测研究所, 北京 100036
2. Northwest Institute of Nuclear Technology, Xi'an 710024, China;
3. Mengcheng National Geophysical Observatory, University of Science and Technology of China, Hefei 230026, China;
4. State Key Lab of Geodesy and Earth's Dynamics, Institute of Geodesy and Geophysics, CAS, Wuhan 430077, China;
5. Institute of Geophysics, China Earthquake Administration, Beijing 100081, China;
6. Institute of Earthquake Science, China Earthquake Administration, Beijing 100036, China
震源的破裂方向性是描述震源过程的重要参数.通过地震破裂方向性研究,可以确定震源机制解的两个节面中哪一个为实际的物理破裂断层,从而更好地理解发震机理(Boatwright,2007).同时,地震破裂方向性研究也能改善地面运动的估计(Aagaard et al., 2008),这是因为破裂方向是影响地震动强度的重要因素,处在破裂方向上的建筑物往往遭受大得多的损毁(Somerville et al., 1997,2001;Atkinson and Boore, 2006).
经验格林函数法是研究地震破裂方向性的常用方法之一,该方法使用小震作为经验格林函数校正地震波在三维地球中的传播效应,从而对震源的特性进行更准确的估计(Hartzell,1978;Frankel and Kanamori, 1983; 吴忠良等,1998;许向彤等,2001;McGuire,2004; de Lorenzo et al., 2008).Tan和Helmberger(2010)在此基础上,利用不同方位角台站上P波的形状和振幅信息,发展了正演模拟技术,从而测定破裂方向性.另外,PGA、PGV等地面运动强度也与破裂方向性有密切关系,经台站振幅修正后,可用于破裂方向性研究(Boatwright,2007).这些方法甚至可以适用于低达3级的小地震研究,但是要求比较密集的地震台网.对于更小的地震,最近有研究人员通过分析震源谱研究其破裂方向性(Lengliné and Got,2011; Wang and Rubin, 2011; Kane et al., 2013).而对于大地震(震级大于7),简单的破裂方向性参数已经不足以描述破裂的复杂性,一般使用有限断层反演方法研究其破裂过程的细节(Olson and Apsel, 1982; Hartzell and Heaton, 1983;Ji et al., 2002;王卫民等, 2008,2013;张勇等,2008).近年来随着对强震早期预警方面的关注,地震学家提出用地震台阵技术分析远震P波进而勾勒破裂前锋传播过程的back-projection法(Ishii et al., 2005; Kruger and Ohrnberger, 2005; Xu et al., 2009),研究也表明通过对近震与区域距离的P震相进行偏振分析可追踪大地震破裂过程(Bayer et al., 2012).
除了上述方法之外,还可以利用质心震中与起始震中的差别测定破裂方向性.对于单侧破裂地震而言,地震破裂从起始震中向质心震中延展,而且两者之间的距离应约为破裂长度的一半.所以根据质心震中与破裂起始震中之间的相对空间取向可判定震源机制解的两个节面中哪一个为实际断层面.例 如汶川地震,其震中位置为北纬31.00°、东经103.32°(http://earthquake.usgs.gov/earthquakes/search/[2014-02-25])、 质心震中为北纬31.44°、东经104.10°(http://www.globalcmt.org[2014-02-25]),据此可以推断汶川地震的破裂方向是北东向.但是由于地球的三维结构导致USGS提供的破裂起始震中与Global CMT提供的质心震中有一定误差(10~20 km,甚至可达40 km)(Li et al., 2008;Zha et al., 2009;Xie et al., 2011),因此这种方法只能适用于破裂长度远大于 20 km的大地震.而对于中小地震,破裂长度约10 km 或更小,这种方法无法直接适用.只有扣除了地球三维结构导致的定位误差,得到准确的起始震中和质心震中,才能使用这种方法测定破裂方向性.而目前广泛采用的双差方法(Waldhauser and Ellsworth, 2002;杨智娴等,2003;黄媛等,2006;朱艾斓等,2005),有效压制了三维结构的影响,可得到地震事件之间准确的相对破裂起始震中.借鉴类似的思路,应该也可以准确测定地震事件之间的相对质心震 中.近年来广泛使用的CAP方法(Zhao and Helmberger, 1994;Zhu and Helmberger, 1996;吕坚等,2008;黄建平等,2009;韦生吉等,2009;谢祖军等,2012;韩立波等,2012;陈伟文等,2012;曾祥方等,2013)就包含了一些主要震相的走时校正信息,部分反映了三维速度结构的影响,可用来测定破裂方向性等信息.本文将以2008年云南盈 江地震为例来具体描述该方法,并讨论地震绝对位 置和发震时刻的误差以及速度结构模型不准确的影响.
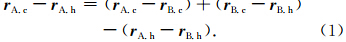
2 研究方法 2.1 基本原理起始震中(hypocenter)是地震破裂过程最先发生的空间位置,可以使用P波初动的到时获得.质心震中(centroid location)表示地震矩释放的平均位置,可以使用长周期地震波矩张量反演获得.对大地震而言,质心震中与起始震中可能有显著区别.质心震中相对于起始震中的偏移能够提供断层长度和破裂方向的信息(Bormann et al., 2009).其原理在图 1中显示如下:对于较大的单侧破裂地震事件A,其质心震中A.c和起始震中A.h有显著差异,且两个位置的连线表明了断层的方向.根据公式(1),测量质心震中A.c和起始震中A.h的差异可通过测量事件A与参考事件B之间的相对质心震中及相对起始震中获得:
 | 图 1 地震破裂方向性测定方法原理示意图.红色为事件A,绿色为事件B,五角星代表起始震中,圆圈代表质心震中,阴影区代表破裂区Fig. 1 Schematic demonstration of the method for resolving earthquake rupture directivity. Red signs denote event A and blue signs denote event B. For unilateral rupture,the spatial difference between centroid and hypocenter indicates the rupture plane |
而对于足够小的地震事件B(参考地震),其质心震中B.c和起始震中B.h很接近(r B.c- r B.h =0),因此公式(1)可以简化成公式(2):

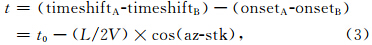
而公式(2)中右侧第二项,即事件A与事件B起始震中之间的相对位置,可利用两个事件之间的P波到时差(onsetA-onsetB)准确得到;右侧第一项,即两个事件之间的质心相对位置,可利用波形到时 差异(timeshiftA-timeshiftB,其中timeshift为CAP算法中的时移,即波形互相关得到的实际观测与理论计算地震波走时之差)测定.所以,根据公式(2)就得到了准确的事件A质心震中与起始震中之间的差异(r A.c- r A.h),从而判明事件A发震断层空间取向.
具体的说,公式(2)中的相关物理量可由公式(3)测得:
本文使用主事件法测定两个事件起始震中之间的相对位置,其原理是选定参考地震,基于P波到时,计算发生在其周围的待定地震相对于它的位置.由于两个事件到台站的地震波传播路径基本一致,因此该方法可有效削弱三维结构的影响,得到准确的相对位置(Havskov et al. 2009,Deichmann and Garcia-Fernandez, 1992;Fremont and Malone, 1987; 周仕勇等,1999).CAP方法是一个很有效的基于波形反演震源机制算法,它将地震图分成Pnl(P波及其后续震相)和面波部分(包括Rayleigh波和Love波),赋予Pnl波和面波不同的权重,分别进行拟合.该方法可有效避免面波在反演的时候占主导作用,同时允许Pnl和面波独立的时移,显著降低了反演结果对地壳结构的依赖性(Zhu and Helmberger, 1996).时移是用波形互相关得到的实际观测与理论计算地震波走时之差,包含了质心震中与起始震中差异的信息,同时也取决于真实地球三维结构与计算理论地震图所使用的一维速度结构模型之间的偏差.而通过计算两个事件之间的时移差,可基本消除三维结构引起的影响,只保留了两个事件之间的质心震中相对位置信息.
3 方法在2008年盈江地震中的应用2008年8月20日5时35分,云南省盈江县发生MS5.0地震.21日20时20分、20时24分震区又相继发生了MS4.9、MS6.0地震.截止到2008年9月底,发生了400多次2级以上地震,其中50多次3.0级以上余震,最大余震为9月3日14时27分的MS5.1地震.宏观震中位于勐弄乡左家坡—中山村—勐弄村一带,极震区烈度为Ⅷ度.由于震区历史上为弱震区,房屋抗震经验不足,地震造成较大的人员伤亡和巨大的经济损失(云南省地震局,2008).在图 2b中展示了苏典断层与双差重定位后的余震序列分布情况,可见二者均呈南北向分布,有较好对应性.而且地震目录显示主震起始震中位于地震序列的最北段,因此地震很可能是向南破裂的单侧破裂地震(图 2).
 | 图 2(a)2008年云南盈江地震构造背景及台站(黑色三角)分布情况;(b)余震序列的双差重定位结果(圆圈)、三次主要事件机制解和空间分布以及苏典断裂(黑线). 五角星为三次事件的起始震中位置. 余震序列的双差重定位结果由罗艳提供,我们在绘制(b)图时将地震序列的位置整体向西平移了5 kmFig. 2 Seismic stations(triangles) and earthquakes used in this study. The right panel is shown as inset in the left panel. Centroid Moment Tensor solutions of earthquakes in the Yingjiang sequence are shown |
罗艳等(2011)用CAP方法得到了此次地震序列中震级大于3.5的事件震源机制解,发现主震及 其之前4 min发生的5级前震(编号200808212020)均为走滑型,余震序列也主要为走滑型.200808212020 号前震与主震的空间位置十分接近,震源机制解的 参数也与主震基本一致,是作为参考地震的理想选择.
本文使用波形数据为云南地震台网所记录到的此次盈江地震序列的宽频带记录.6级主震的发震 时刻、震中位置以及参考地震的发震时刻等参数取 自国家地震科学数据共享中心(http://data.earthquake.cn[2014-01-25]). 由于记录到主震的台站数目较多,假定主震位置比较准确,利用主事件定位法获得参考地震与主震的起始震中的相对位置,从而得到参考地震的震 中位置(表 1).然后从CRUST2.0(Laske et al., 2001)中得到云南盈江地区的速度结构模型(表 2),使用频率波数法FK(Zhu and Rivera, 2002)计算反演所需的格林函数,进行CAP反演得到震源机制解(图 3).波形反演表明三次地震均为走滑型地震,有近南北向和东西向的两组节面(图 3a);P波、Rayleigh波和Love波均有明显的时移,但是随方位角分布规律不明显,表明研究区三维结构较为复杂.
| 表 1 主震及参考地震的发震时刻和目录位置Table 1 Origin time and location of main shock and reference events |
| 表 2 云南盈江地区地壳结构分层速度模型Table 2 Layered crustal velocity model for Yingjiang region |
 | 图 3(a)主震(左,编号200808202124)的震源机制解(节面Ⅰ:8°/86°/-180°,节面Ⅱ:278°/90°/-4°,矩震级Mw5.87)及参考地震(右,编号200808212020)的震源机制解(节面Ⅰ:271°/79°/-11°,节面Ⅱ:3°/79°/-168°,矩震级Mw4.88);(b)主震的波形对比;(c)参考地震的波形对比.两个事件的震源机制解的参数基本一致,均为走滑型,黑色和红色分别表示观测和理论地震图,地震图下面的数字表示时移(上面)和互相关系数(下面).时移是实际观测与理论计算地震波走时之差Fig. 3(a)The focal mechanisms of main shock(left,No.200808212024)(fault planeⅠ:8°/86°/-180°,fault planeⅡ:278°/90°/-4°,Mw5.87) and reference event(right,No.200808212020)(fault planeⅠ:271°/79°/-11°,fault planeⅡ:3°/79°/-168°,Mw=4.88);(b)Waveform comparison between the synthetic(red) and observed(black)seismograms of the main shock;(c)Waveform comparison of the reference event. The focal mechanism solutions of the two events are almost the same,numbers under the seismograms are time shifts(upper) and cross-correlation coefficient in percent(lower). Time shift is travel time difference measured with cross-correlation of observed and synthetic seismic waveforms |
用主震的时移减去参考地震的相同台站同一震相的时移,得到的时移之差随方位角的分布见图 4.由图可见,P波的数据基本上都是正值,变化幅度不大,随方位角增加略呈下降趋势.Rayleigh波的数据随着方位角的增加也有一个减小的趋势,并且在方位角az<90°时都是正值,在方位角az>90°时都是负值,其分布虽然有一定规律性,但是数据点较为散布.而Love波的数据分布很有规律,除了三个异常数据点之外,时移之差随方位角增加呈明显下降趋势.例外的三个异常数据点对应的台站(LUS台、LIJ台、JIH台)的波形互相关系数都不高,可能是这些台时移之差测量精度不高的原因.所以在以下的分析中,只使用波形拟合互相关系数大于0.8的Love波分量时移数据.
 | 图 4 以200808212020号事件作为参考地震得到的观测时移之差随方位角的分布. 从左到右分别为P波、Rayleigh波和Love波的时移之差Fig. 4 Observed azimuthal variations of time shift differences using the No.200808212020 reference event |
利用公式(3)对上面得到的Love波分量的时移之差进行拟合,其中破裂方向stk分别取CAP反演得到的主震的走向7°和97°,拟合结果见图 5.破裂方向取7°时的拟合效果很好,而破裂方向取97°时的拟合效果非常差.所以推测走向为7°的节面是实际的物理破裂面,与余震区呈近南北向展布一致.基于crust2.0模型,在波形反演频带内,Love波群速度为3.0 km·s-1左右.在stk=7°时,利用公式(3)反演得到破裂长度L约为12.5 km,与余震区展布长度接近.
 | 图 5 以200808212020号事件作为参考地震时得到的破裂方向性拟合结果.圆圈为实际观测的数据,实线、虚线分别表示破裂方向取7°、97°时的拟合曲线.破裂方向 为7°时的拟合效果很好,表明此走向的断层为发震断层.此时的破裂长度约为12.5 kmFig. 5 Rupture directivity result using the No.200808212020 reference event. Circles denote observed data . Black solid line denotes synthetic when rupture direction is 7°, and black dashed line denotes prediction when rupture direction is 97°. Fitting result of the black solid line is very good,indicating that the corresponding fault is the ruptured fault plane, and the rupture length is approximately 12.5 kilometers |
为了进一步验证方法的可靠性,我们还选择了9月03日14时27分发生的离主震较远、震源机制解与主震接近的MS5.1地震(编号200809031427)作为参考地震,其发震时刻以及震中位置见表 1.按照相同的处理流程得到主震的破裂方向性结果见图 6,破裂方向取7°时的拟合效果要好的多,所以同样地也可判定走向为7°的那个节面为实际的物理破裂面.不过推测的破裂长度比使用20808212020号参考地震得到的破裂长度偏短约2.6 km.
 | 图 6 以200809031427号事件作为参考地震时得到的破裂方向性拟合结果.图中的细节与图 5中相同Fig. 6 Rupture directivity result using the No.200809031427 reference event. Details are the same as in Fig. 5 |
罗艳等(2011)用双差定位方法对盈江MS6.0地震序列中震级大于2.5的地震进行了重定位,重 定位后的地震序列整体走向近南北向,与苏典断裂走向基本吻合,结合长周期波形反演的主震震源机制解以及当地断裂构造,确定发震断裂为苏典断裂;又用小震经验格林函数法分别计算了向南、向北破裂时,位于几乎正南方向的WAD台站上的理论地震图,发现向南破裂对应的理论地震图中S波与面波的周期与实际观测数据吻合得很好,而向北破裂对应的理论地震图中S波的周期远大于实际波形,推测地震破裂是沿着苏典断裂由北向南传播的.本文得到的结果与以上结果一致,验证了本文方法的可靠性.
4 讨论与结论 4.1 定位误差的影响从理论上来说,地震绝对位置、地震发震时刻、地震机制解、速度结构模型等因素均有可能影响本文方法的可靠性.为此,首先考察在起始震中相对位置准确、绝对位置变动的情况下该方法可靠性.同时将主震和200808212020号参考地震的起始震中位置向东、南、西、北移动5 km,这样可以保持相对位置不变,但是绝对位置发生了变动.再用本文的处理方法,得到主震的破裂性结果如图 7.由图可见,不同震中绝对位置对应的时移之差观测数据非常接近,破裂方向取7°时的拟合效果都很好,由此仍可确定走向为7°的节面为实际 破裂面.理论时移之差随方位角分布曲线的幅值则略有不同,导致推测的破裂长度为10.9~12.5 km.
 | 图 7 主震与200808212020号参考地震的绝对位置同时变动后得到的破裂方向性结果.红色、绿色、粉红色、蓝色、黑色分别表示位置向东、南、西、北平移5 km以及不平移时的结果.圆圈为实际观测的数据,实线、虚线分别表示破裂方向取 7°、97°时的拟合曲线Fig. 7 Rupture directivity result after shifting the main shock and No.200808212020 reference event with the same offset simultaneously. Red、green、magenta、blue and black denote the results when locations of the main shock and No.200808212020 reference event are moved eastward、southward、westward、northward by 5km respectively. Circles denote observed data. Black solid line denotes prediction when rupture direction is 7°, and black dashed line denotes prediction when rupture direction is 97° |
接着考察发震时刻不准确对本方法可靠性的影响.虽然理论上预测波形时移(timeshift)可由发震时刻的偏差直接修正,然而在波形反演中,截取观测波形的窗口会随着发震时刻的变动而变化,用于反演的波形就有相应的改变,因此波形时移并不一定能够根据发震时刻偏移直接得到.为此,使用地震目录中的发震时刻,进行CAP反演得到地震事件在各个台站上的时移;然后改变事件的发震时刻,分别向前后间隔1s移动,最大移动5s,随后进行CAP反演,得到各个台站上的时移.用同一台站上的发震时刻修改后的时移减去修改前的时移就得到由于发震时刻的改变而带来的变动,盈江6级主震以及200808212020号参考地震的测试结果如图 8所示.由图可见,发震时刻变动在4s以内时,对Love波在各个台站上的时移的影响几乎可以由发震时刻平移直接得到,但是P波和Rayleigh波受到的影响较大.本文研究的地震为走滑型,Love波一般发育良好,是测量破裂方向性的有效震相,所以发震时刻的不准确基本不影响本方法在走滑型地震中的应用.
 | 图 8 发震时刻不准确的影响测试.(a)为6级主震(编号为200808212024)的结果,(b)为5级参考地震(编号为 200808212020)的结果.每幅小图中的绿色、黑色、红色、蓝色、粉红色分别表示发震时刻移动1 s、2 s、3 s、4 s、5 s时的结果,实心点代表时刻向前移动,空心圈代表向后移动Fig. 8 Test of effects due to inaccurate origin time.(a)Result of the main shock.(b)Result of the No.200808212020 reference event. Green,black,red,blue and magenta circles denote results when the error of origin time is 1 s,2 s,3 s,4 s and 5 s respectively. Circles and dots denote the direction of forward and backward movement respectively |
最后我们还考察了速度模型对本方法可靠性的影响.我们从CRUST2.0中得到研究区的速度结构模型,计算格林函数,进行CAP反演,得到各个台站上的时移;然后修改模型,将波速分别增加或减小5%,得到新的模型,再次得到各个台站上的时移;最后计算模型改变对主震与参考事件引起的时移变动之差.主震与200808212020号参考地震的测试结果如图 9所示.由图可见:速度结构模型的波速有5%的变化时,两个事件Love波在同一台站上的时移变动之差很小(多数小于0.4 s),对本文方法可靠性影响不大.
 | 图 9 模型的波速有5%变化时,主震与200808212020号参考地震的时移变动之差Fig. 9 Test of effects due to inaccurate velocity model. Black(red)dots denote results when velocity increases(decreases)by five percent |
在前文的分析中,我们使用波形拟合互相关系数大于0.8的Love波分量时移数据,研究了2008年云南盈江MS6.0地震,清晰地展示出其破裂方向性.但是对P波、Rayleigh波的数据进行分析,没有得到破裂方向性结果.经过分析,可能的原因如下:(1)由于震相之间的相互转换,P-SV系统中的震相比SH系统要复杂,有可能P-SV系统对应的时移更容易受到速度模型不准确的影响,因为在不同的方位角不同的震相可能对波形拟合起主导作用;(2)由于SH波的振幅明显大于P-SV波,三维速度 结构和定位误差会把一部分SH能量投影到P-SV系.
4.5 结论我们提出了基于测定质心震中与起始震中的差异而测定破裂方向性的方法,并使用该方法研究了2008年云南盈江6级地震的破裂方向性,得到的结果与其他方法的研究结果一致,验证了方法的可靠性.我们还对地震绝对位置、地震发震时刻、速度结构模型等因素对本方法可靠性的影响进行了测试,结果表明在使用Love波的数据研究6级以上走滑型地震的破裂方向性时,这些因素影响不显著.需要指出的是我们的方法假定了地震单侧破裂,对于中心开始的双侧破裂不能适用.对于双侧破裂地震需要使用其他方法,例如有限矩张量方法(Chen et al., 2005)等.研究表明80%以上的大地震为单侧破裂(Henry and Das, 2001;McGuire et al., 2002;Mai et al., 2005),而且很多中小地震也具有明显的方向性(Boatwright J,2007;Kane et al,2013),因此本文提出的方法应该具有较好的适用性.然而本文只对一个地震序列进行了测试,方法的可靠性还需要更多地震实例研究进行评估.
致谢 我们对匿名审稿人表示感谢,他们提出了宝贵的建议.地震波形数据由云南省地震局地震台网中心提供.| [1] | Aagaard B T, Brocher T M, Dolenc D. 2008. Ground-motion modeling of the 1906 San Francisco earthquake, part II: Ground-motion estimates for the 1906 earthquake and scenario events. Bull. Seism. Soc. Amer., 98(2): 1012-1046. |
| [2] | Atkinson G M, Boore D M. 2006. Earthquake ground-motion prediction equations for eastern north America. Bull. Seism. Soc. Amer., 96(6): 2181-2205. |
| [3] | Bayer B, Kind R, Hoffmann M, et al. 2012. Tracking unilateral earthquake rupture by P-wave polarization analysis. Geophys. J. Int., 188(3): 1141-1153. |
| [4] | Boatwright J. 2007. The persistence of directivity in small earthquakes. Bull. Seism. Soc. Amer., 97(6): 1850-1861. |
| [5] | Bormann P, Baumbach M, Bock G, et al. 2009. (2009 online): Seismic Sources and Source Parameters. // Bormann P. New Manual of Seismological Observatory Practice (NMSOP). Potsdam: IASPEI, GFZ German Research Centre for Geosciences, 79-80. |
| [6] | Chen P, Jordan T H, Zhao L. 2005. Finite-moment tensor of the 3 September 2002 Yorba Linda earthquake. Bull. Seism. Soc. Amer., 95(3): 1170-1180. |
| [7] | Chen W W, Ni S D, Wang Z J. 2012. Joint inversion with both local and teleseismic waveforms for source parameters of the 2010 Kaohsiung earthquake. Chinese J. Geophys. (in Chinese), 55(7): 2319-2328. |
| [8] | de Lorenzo S, Filippucci M, Boschi E. 2008. An EGF technique to infer the rupture velocity history of a small magnitude earthquake. J. Geophys. Res., 113(B10), doi:10.1029/2007JB005496. |
| [9] | Deichmann N, Garcia-Fernandez M. 1992. Rupture geometry from high-precision relative hypocentre locations of microearthquake clusters. Geophys. J. Int., 110(3): 501-517. |
| [10] | Frankel A, Kanamori H. 1983. Determination of rupture duration and stress drop for earthquakes in southern California. Bull. Seism. Soc. Amer., 73(6A): 1527-1551. |
| [11] | Fremont M J, Malone S D. 1987. High precision relative locations of earthquakes at Mount St. Helens, Washington. J. Geophys. Res., 92(B10): 10233-10236. |
| [12] | Han L B, Jiang C S, Bao F. 2012. Source parameter determination of 2010 Taikang MS4.6 earthquake sequences. Chinese J. Geophys. (in Chinese), 55(9): 2973-2981. |
| [13] | Hartzell S H, Heaton T H. 1983. Inversion of strong ground motion and teleseismic waveform data for the fault rupture history of the 1979 Imperial Valley, California, earthquake. Bull. Seism. Soc. Amer., 73(6A): 1553-1583. |
| [14] | Hartzell S H. 1978. Earthquake aftershocks as Green's functions. Geophys. Res. Lett., 5(1): 1-4. |
| [15] | Havskov J, Bormann P, Schweitzer J. 2009. (2009 online): Earthquake location. // Bormann P. New Manual of Seismological Observatory Practice (NMSOP). Potsdam: IASPEI, GFZ German Research Centre for Geosciences, 16. |
| [16] | Henry C, Das S. 2001. Aftershock zones of large shallow earthquakes: fault dimensions, aftershock area expansion and scaling relations. Geophys. J. Int., 147(2): 272-293. |
| [17] | Huang J P, Ni S D, Fu R S, et al. 2009. Source mechanism of the 2006 Mw5.1 Wen'an Earthquake determined from a joint inversion of local and teleseismic broadband waveform data. Chinese J. Geophys. (in Chinese), 52(1): 120-130. |
| [18] | Huang Y, Yang J S, Zhang T Z. 2006. Relocation of the Bachu-Jiashi, Xinjiang earthquake sequence in 2003 using the double-difference location algorithm. Chinese J. Geophys. (in Chinese), 49(1): 162-169. |
| [19] | Ishii M, Shearer P M, Houston H, et al. 2005. Extent, duration and speed of the 2004 Sumatra—Andaman earthquake imaged by the Hi-Net array. Nature, 435(7044): 933-936. |
| [20] | Ji C, Wald D J, Helmberger D V. 2002. Source description of the 1999 Hector Mine, California, earthquake, part I: Wavelet domain inversion theory and resolution analysis. Bull. Seism. Soc. Amer., 92(4): 1192-1207. |
| [21] | Kane D L, Shearer P M, Goertz-Allmann B P, et al. 2013. Rupture directivity of small earthquakes at Parkfield. J. Geophys. Res., 118(1): 212-221. |
| [22] | Krüger F, Ohrnberger M. 2005. Tracking the rupture of the Mw9.3 Sumatra earthquake over 1, 150 km at teleseismic distance. Nature, 435(7044): 937-939. |
| [23] | Laske G, Masters G, Reif C. 2001. A new global crustal model at 2x2 degrees (Crust 2. 0). |
| [24] | Lengliné O, Got J L. 2011. Rupture directivity of microearthquake sequences near Parkfield, California. Geophys. Res. Lett., 38(8), doi:10.1029/2011GL047303. |
| [25] | Li Z H, Feng W P, Xu Z H. 2008. The 1998 Mw5.7 Zhangbei-Shangyi (China) earthquake revisited: A buried thrust fault revealed with interferometric synthetic aperture radar. Geochemistry, Geophysics, Geosystems, 9(4), doi:10.1029/2007GC001910. |
| [26] | Luo Y, Bao F, Ni S D, et al. 2011. Preliminary study of Yingjiang, Yunnan Ms5.9 earthquake sequences in 2008 (in Chinese). // Proceeding of the 27th annual meeting of the Chinese geophysical society. Changsha. |
| [27] | Lü J, Zhen Y, Ni S D, et al. 2008. Focal mechanisms and seismogenic structures of the Ms5.7 and Ms4.8 Jiujiang—Ruichang earthquakes of Nov. 26, 2005. Chinese J. Geophys. (in Chinese), 51(1): 158-164. |
| [28] | Mai P M, Spudich P, Boatwright J. 2005. Hypocenter locations in finite-source rupture models. Bull. Seism. Soc. Am., 95(3): 965-980. |
| [29] | McGuire J J, Zhao L, Jordan T H. 2002. Predominance of unilateral rupture for a global catalog of large earthquakes. Bull. Seism. Soc. Amer., 92(8): 3309-3317. |
| [30] | McGuire J J. 2004. Estimating finite source properties of small earthquake ruptures. Bull. Seism. Soc. Amer., 94(2): 377-393. |
| [31] | Olson A H, Apsel R J. 1982. Finite faults and inverse theory with applications to the 1979 Imperial Valley earthquake. Bull. Seism. Soc. Amer., 72(6A): 1969-2001. |
| [32] | Somerville P G, Smith N F, Graves R W, et al. 1997. Modification of empirical strong ground motion attenuation relations to include the amplitude and duration effects of rupture directivity. Seismological Res. Lett., 68(1): 199-222. |
| [33] | Somerville P G, Collins N, Abrahamson N. 2001. Earthquake source scaling and ground motion attenuation relations for the central and eastern United States. Report to the U. S. Geological Survey, Grant No. 99HQGR0098. |
| [34] | Tan Y, Helmberger D. 2010. Rupture directivity characteristics of the 2003 Big Bear sequence. Bull. Seism. Soc. Amer., 100(3): 1089-1106. |
| [35] | Waldhauser F, Ellsworth W L. 2002. A double-difference earthquake location algorithm: Method and application to the northern Hayward fault, California. Bull. Seism. Soc. Amer., 90(6): 1353-1368. |
| [36] | Wang E N, Rubin A M. 2011. Rupture directivity of microearthquakes on the San Andreas Fault from spectral ratio inversion. Geophys. J. Int., 186(2): 852-866. |
| [37] | Wang W M, Zhao L F, Yao Z X, et al. 2008. Rupture process of the M8.0 Wenchuan earthquake of Sichuan, China. Chinese J. Geophys. (in Chinese), 51(5): 1403-1410. |
| [38] | Wang W M, Hao J L, Yao Z X. 2013. Preliminary result for rupture process of Apr. 20, 2013, Lushan earthquake, Sichuan, China. Chinese J. Geophys. (in Chinese), 56(4): 1412-1417. |
| [39] | Wei S J, Ni S D, Cong J J, et al. 2009. The 16 August 2003 Chifeng earthquake: Is it a lower crust earthquake? Chinese J. Geophys. (in Chinese), 52(1): 111-119. |
| [40] | Xie J, Zeng X F, Chen W W, et al. 2011. Comparison of ground truth location of earthquake from InSAR and from ambient seismic noise: A case study of the 1998 Zhangbei earthquake. Earthquake Science, 24(2): 239-247. |
| [41] | Xie Z J, Zhen Y, Ni S D, et al. 2012. Focal mechanism and focal depth of the 19 January 2011 Anqing earthquake. Chinese J. Geophys. (in Chinese), 55(5): 1624-1634. |
| [42] | Xu Y, Koper K D, Sufri O, et al. 2009. Rupture imaging of the Mw7.9 12 May 2008 Wenchuan earthquake from back projection of teleseismic P waves. Geochem. Geophys. Geosyst., 10(4), doi:10.1029/2008GC002335. |
| [43] | Zeng X F, Luo Y, Han L B, et al. 2013. The Lushan MS7.0 earthquake on 20 April 2013: A high-angle thrust event. Chinese J. Geophys. (in Chinese), 56(4): 1418-1424. |
| [44] | Zha X J, Fu R S, Dai Z Y, et al. 2009. Applying InSAR technique to accurately relocate the epicentre for the 1999 MS5.6 Kuqa earthquake in Xinjiang province, China. Geophys. J. Int., 176(1): 107-112. |
| [45] | Zhao L S, Helmberger D V. 1994. Source estimation from broadband regional seismograms. Bull. Seism. Soc. Amer., 84(1): 91-104. |
| [46] | Zhu A L, Xu X W, Zhou Y S, et al. 2005. Relocation of small earthquakes in western Sichuan, China and its implications for active tectonics. Chinese J. Geophys. (in Chinese), 48(3): 629-636. |
| [47] | Zhu L P, Helmberger D V. 1996. Advancement in source estimation techniques using broadband regional seismograms. Bull. Seism. Soc. Amer., 86(5): 1634-1641. |
| [48] | Zhu L P, Rivera L A. 2002. A note on the dynamic and static displacements from a point source in multilayered media. Geophys. J. Int., 148(3): 619-627. |
| [49] | 陈伟文, 倪四道, 汪贞杰等. 2012. 2010年高雄地震震源参数的近远震波形联合反演. 地球物理学报, 55(7): 2319-2328. |
| [50] | 韩立波, 蒋长胜, 包丰. 2012. 2010年河南太康MS4.6地震序列震源参数的精确确定. 地球物理学报, 55(9): 2973-2981. |
| [51] | 黄建平, 倪四道, 傅容珊等. 2009. 综合近震及远震波形反演2006文安地震(Mw5.1)的震源机制解. 地球物理学报, 52(1): 120-130. |
| [52] | 黄媛, 杨建思, 张天中. 2006. 2003年新疆巴楚—伽师地震序列的双差法重新定位研究. 地球物理学报, 49(1): 162-169. |
| [53] | 罗艳, 包丰, 倪四道等. 2011. 2008年云南盈江MS5.9地震序列初步研究. //中国地球物理学会第二十七届年会论文集. 长沙. |
| [54] | 吕坚, 郑勇, 倪四道等. 2008. 2005年11月26日九江—瑞昌MS5.7, MS4.8地震的震源机制解与发震构造研究. 地球物理学报, 51(1): 158-164. |
| [55] | 王卫民, 赵连锋, 姚振兴等. 2008. 四川汶川8.0级地震震源过程. 地球物理学报, 51(5): 1403-1410. |
| [56] | 王卫民, 郝金来, 姚振兴. 2013. 2013年4月20日四川芦山地震震源破裂过程反演初步结果. 地球物理学报, 56(4): 1412-1417. |
| [57] | 韦生吉, 倪四道, 崇加军等. 2009. 2003年8月16日赤峰地震: 一个可能发生在下地壳的地震? 地球物理学报, 52(1): 111-119. |
| [58] | 吴忠良, 陈运泰, Mozaffari P. 1998. 用经验格林函数方法研究澜沧—耿马MS7.6地震的破裂过程. 地震学报, 20(1): 1-11. |
| [59] | 谢祖军, 郑勇, 倪四道等. 2012. 2011年1月19日安庆ML4.8地震的震源机制解和深度研究. 地球物理学报, 55(5): 1624-1634. |
| [60] | 许向彤, 陈运泰, 王培德. 2001. 1995年7月20日怀来盆地ML4.1地震序列震源参数的精确测定. 地震学报, 23(3), 225-238. |
| [61] | 杨智娴, 陈运泰, 郑月军等. 2003. 双差地震定位法在我国中西部地区地震精确定位中的应用. 中国科学: D辑, 33(S1): 129-134. |
| [62] | 云南省地震局. 2008. 2008年9月20日、21日盈江5.0、4.9、5.9级地震灾害直接损失评估报告. 云南: 云南省地震局, 1-3. |
| [63] | 曾祥方, 罗艳, 韩立波等. 2013. 2013年4月20日四川芦山MS7.0地震: 一个高角度逆冲地震. 地球物理学报, 56(4): 1418-1424. |
| [64] | 张勇, 冯万鹏, 许力生等. 2008. 2008 年汶川大地震的时空破裂过程. 中国科学: D 辑, 38(10): 1186-1194. |
| [65] | 周仕勇, 许忠淮, 韩京等. 1999. 主地震定位法分析以及1997年新疆伽师强震群高精度定位. 地震学报, 21(3): 258-265. |
| [66] | 朱艾斓, 徐锡伟, 周永胜等. 2005. 川西地区小震重新定位及其活动构造意义. 地球物理学报, 48(3): 629-636. |