 2013, Vol. 56


2. 中国科学院地质与地球物理研究所, 北京 100029
2. Institute of Geology and Geophysics, Chinese Academy of Sciences, Beijing 100029, China
作为青藏高原与华北克拉通的接壤地带,青藏高原东北缘被三条大型左旋走滑断裂包围:南侧是昆仑山断裂、西北侧是阿尔金断裂,东北侧是海原断裂.相邻的地体包括:南侧的松潘-甘孜地体,西北侧的塔里木盆地、北侧的阿拉善地块和东侧的鄂尔多斯地块(如图 1所示).自印度-欧亚板块碰撞以来,随着青藏高原持续向北东方向发展[1-2],使得距汇聚前缘约一千公里的东北缘发生了中-晚新生代以来的地表抬升和造山运动[3].虽然东北缘与碰撞有关的断层、沉积地层和抬升冷却所对应的年龄分布较宽(从碰撞开始至今),但多数研究都表明昆仑断裂以北大部分的新生代构造都晚于11 Ma[3],也有研究认为东北缘的隆升主要发生在上新世-第四纪[2].例如:近10 Ma以来,昆仑断裂与海原断裂之间沿北东方向(~N30°E)至少缩短了150km[3];阿尔金断裂13~16Ma以来再度活跃[4];昆仑山断裂近7 Ma以来发生了约75km的走滑位移[5];海原断裂也于晚中新世开始变得活跃[6-7].祁连山逆冲带大约9Ma以来迅速抬升[8].因此,可以认为青藏高原东北缘尚处于地壳缩短和岩石圈变形的早期阶段,研究东北缘的岩石圈-软流圈边界(LAB)形态和上地幔变形样式,可为青藏高原隆升和侧向生长研究提供边界约束,并深化对陆-陆碰撞远程效应和陆内造山过程、机制的理解.

|
图 1 青藏高原东北缘地质构造和台站分布图 KL-昆仑地块; WQL-西秦岭造山带; BNS-班公-怒江缝合带; J S-金沙江缝合带; AKMS-阿尼玛卿-昆仑缝合带; SQ S-南祁连缝合带. Fig. 1 Regional tectonic map of the NE Tibetan plateau and location of stations KL-Kunlun block; WQL-West Qinling orogen; BNS-Bangong-Nujiang suture; JS-Jinshajiang suture; AKMS-Ayimaqin-Kunlun-Mutztagh suture; SQS-South Qilian suture |
随着地球物理观测水平的提高,近20年来,在青藏高原东北缘地区已开展了多期次的以揭示壳、幔结构为目标的地球物理探测,然而,目前关于其岩石圈结构和地幔变形样式的认识仍存在较大的争议.体波和面波层析成像研究显示昆仑断裂以北柴达木盆地和祁连山推覆带下方存在深达200km的高速异常,可能对应着较稳定的岩石圈地幔[9-13];而接收函数图像却显示东北缘地区(包括柴达木盆地)下方的岩石圈并不厚(~120km),且正自昆仑断裂带向南俯冲到了松潘-甘孜地体岩石圈之下[14-17],这与层析成像结果显示了完全不同的岩石圈结构和地幔变形样式;另外,高锐等[18]通过对深地震反射剖面的分析认为青藏高原东北缘岩石圈变形以缩短变形为主要机制;Tian等[19]通过对研究区内的接收函数分析认为高原东北缘地壳缩短主要发生在上地壳部分;常利军等[20]和王琼等[21]分别利用剪切波分裂方法得到了青藏高原东北缘的上地幔各向异性图像,其中前者结果显示各向异性快波方向基本呈NW-SE方向,后者结果还揭示出高原东北缘上地幔各向异性存在明显的块体差异,既受到古构造的影响,又受控于现今的区域构造应力场.
可见,青藏高原东北缘的岩石圈形态和上地幔变形方式,目前仍有待进一步研究和完善.本研究利用青海和甘肃区域地震台网的宽频带波形资料,得到了青藏高原东北缘的三维岩石圈厚度(即岩石圈-软流圈边界(LAB)深度)图像和上地幔各向异性特征,为研究该地区岩石圈和地幔形变样式提供了深部地球物理证据和约束.
2 资料与方法 2.1 研究资料本研究利用了青海地震台网(25个台站)和甘肃地震台网(44个台站)2007-2009年记录的远震波形资料,台站主要分布于青藏高原东北缘的柴达木-昆仑地块和祁连地块,部分位于松潘-甘孜地块北缘、阿拉善和鄂尔多斯地块南缘、西秦岭造山带(如图 1所示).在岩石圈厚度研究中,我们挑选震中距范围60°~85°,震级MS>5.8,S波初至清晰的远震S波波形提取S波接收函数.在上地幔各向异性研究中,选择震中距范围85°~130°,震级MS>6.0,SKS震相明显的远震SKS波形资料.在这个震中距范围内的SKS波是近似垂直入射的,能量较强,有很高的切向分辨率.地震事件的震中分布如图 2所示.

|
图 2 研究中所使用的地震事件的震中分布图 实心圆圈为用于提取S波接收函数的地震事件, 空心圆圈为用于SKS分裂分析的地震事件. Fig. 2 Spatial distribution of teleseismic even tsused in the study Black-filled circles represent events used to calculate S receiver functions, and the white-filled circles represent events used to analysis the SKS. |
P波接收函数方法已广泛应用于壳、幔结构和介质属性的研究,但由于P波接收函数中来自LAB的Ps转换波与来自Moho的多次波到达时间相当,因此不适合用于岩石圈结构的研究;而Sp转换波比S波传播得快,先于S波到达地震台站,多次波均滞后于S波到达,且Sp震相不会因传播路径上的介质各向异性而发生分裂,因此,利用Sp震相(即S波接收函数)研究岩石圈结构受其他震相干扰相对较小[22-25],可以得到更为可靠的、高分辨的岩石圈厚度信息.
为保证数据的可靠性,研究中我们手动截取S波初至清晰、延续时间小于15s的高信噪比S波波形记录用于计算S波接收函数;提取S波接收函数包括坐标旋转和反褶积计算两个步骤.坐标旋转的目的是分离直达S波与转换Sp波的能量,首先,将三分量地震记录由地理坐标系(Z-N-E)旋转到台站坐标系(Z-R-T)下;由于远震S波中的Sp转换波的入射角度可达45°[24],因此还需要将Z-R-T分量再次旋转到射线坐标系(P-SV-SH)以充分分离S波与Sp波.二次坐标旋转的入射角度选择以接收函数中的S波能量(“0”时刻振幅)最小为准则[22-23].如图 3b 所示,当入射角度为20°时,S波能量达极小,且Moho和LAB的转换波振幅均达极大,因此,可以选择20°为最优射线入射角度.由于Sp震相主要出现在P分量上,利用SV分量对P分量做反褶积便可得到S波接收函数;Sp震相与P s震相的极性相反,且Sp波较S波传播得快,为了使S波接收函数与传统P波接收函数看起来相似,需要将反褶积得到的时间序列的时间轴和振幅极性反向.在提取S波接收函数时,进行了0.05~0.15 Hz的带通滤波以提高信噪比.

|
图 3 确定射线入射角度的示例 (a)三分量地震波形, 图中直线标出位置为S波初至时刻; (b)利用不同入射角计算的S波接收函数, 箭头所指为理论入射角度, 圆圈所示为所选最优入射角度. Fig. 3 Determination of optimal incidence angle by rotation of R and Z components into P and SV components for various incidence angles. (a)The Z-N-E component waveforms.The vertical line demarks rise of S wave onset.(b) The S receiver functions computed using different estimated angles of incidence.The arrow indicates the theoretical angle of incidence, and the circle marks the optimum angle of incidence according to our criteria. |
SKS波从震源出发时为S波,经过液态的外核时转换为P波,当再次通过核-幔边界时又由P波转换为只有径向偏振的S波,因此,在各向同性介质中,台站接收到的SKS波只有径向分量(SV波),没有切向分量(SH波).如果从核幔边界到接收台站存在各向异性介质,SKS波将分裂成一对偏振方向正交的快、慢波,质点运动由原来的线性偏振变为椭圆偏振.一般用参数对(φ,δt)描述SKS分裂特征,其中φ表示快波偏振方向,与介质各向异性的快轴方向一致,δt表示快、慢波的到时差,由各向异性强度和层厚度决定.因此,通过对SKS波的偏振分析可以直观的了解接收区下方核-幔边界到台站间介质的各向异性特征.
本研究利用Tian等[26]提出的全局最小切向能量方法(GM)分析不同方位的单个事件,确定各向异性参数及其误差,误差估计采用95%的置信度[27],然后选择测量的偏振角度误差<20°,延迟时间误差<δt/2的事件,并以此为权系数[28],分别对多个事件的φ和δt进行加权叠加,得到台站下方平均的各向异性特征.
构造环境或磁场扰动可能会造成野外地震台站摆的水平分离偏离地理的北和东方向,使得利用传统的最小切向能量方法(SC)[29]、相关系数方法(RC)[30]和特征值方法(EV)[29]得到的SKS分裂参数不一致(如图 4所示),难以确定测量结果的可靠性. GM方法考虑了地震摆偏角信息,在传统的网格搜索过程中加入对地震摆偏角的扫描,从而得到φ-δt-θ域(θ为地震摆偏角校正量,取顺时针方向为正)切向能量最小时所对应的φ和δt.这种方法消除了地震摆偏角的影响,能够得到更为可靠的各向异性参数.

|
图 4 利用传统方法进行SKS偏振分析的示例 (a)左图为原始地震记录的径向(黑色曲线)和切向(灰色曲线)分量波形, 两条虚线之间为SKS波, 右图为SKS波的质点轨迹; (b), (c)和(d)分别为利用最小切向能量方法(SC)、相关系数方法(RC)和特征值方法(EV)进行SKS偏振分析的结果, 其中左图为切向能量谱, 中间和右图为经各向异性校正后, SKS在径向(黑色曲线)和切向(灰色曲线)分量上的波形和质点运动轨迹. Fig. 4 SKS splitting analysis by SC, RC and EV method (a)shows the original seismograms (left) with the radial (bold line) and the transverse (gray thin line) components as well as the selected time window (vertical dashed line) for the SKS phase analyzed.The right panel shows the initial particle motion.(b), (c) and (d) show splitting parameters calculated by the SC, RC and EV method.The left panel is the contour map of the transverse energy with the cross marking the best-fitting splitting parameters.The middle panel shows the corrected radial (bold line) and transverse (gray thin line) components, and the right panel is the corrected particle motion. |
为了突出SKS波的有效信息,对波形数据进行了频率为0.03~0.2Hz的带通滤波. 图 4是利用传统方法对远震SKS波(图 4a )进行分析的结果,其中S C方法测量的分裂参数为φ=84°,δt=0.6s(图 4b),RC和EV方法测量的分裂参数分别为φ=113°,δt=1.3s(图 4c )和φ=115°,δt=1.35s(图 4d),并且,经过各向异性校正后的SKS波不呈线性偏振,说明SKS波没有得到合理的校正. 图 5是本研究中利用GM方法对图 4a 的SKS波形进行分析的结果,当地震摆偏角校正量θ=15°时(表明地震摆的北分量向西偏转了15°),最小切向能量(MTE)达全局最小,得到的分裂参数为φ=100°和δt=1.4s.经过摆偏角校正后,SC方法和RC、EV方法的测量结果(图 6)与GM方法的测量结果一致,并且经过各向异性校正后的SKS波呈线性偏振,证明了GM方法的实用性.

|
图 5 利用全局最小切向能量方法进行SKS偏振分析的示例 横坐标为摆偏角校正量, 顺时针为正; 纵坐标为快波偏振方向 Fig. 5 SKS splitting analysis by GM method The horizontal coordination is sensor angle assuming a clockwise rotation of horizontal components, and the vertical coordination is fast direction. |

|
图 6 利用传统方法对经摆偏角校正后的SKS波做偏振分析的示例 (a)左图为经摆偏角校正后的地震记录的径向(黑色曲线)和切向(灰色曲线)分量波形, 两条虚线之间为SKS波, 右图为SKS波的质点轨迹; (b), (c)和(d)分别为利用最小切向能量方法(SC)、相关系数方法(RC)和特征值方法(EV)进行SKS偏振分析的结果, 其中左图为切向能量谱, 中间和右图为经各向异性校正后, SKS在径向(黑色曲线)和切向(灰色曲线)分量上的波形和质点运动轨迹. Fig. 6 SKS splitting analysis by SC, RC and EV method (a)shows the seismograms (left) with the radial (bold line) and the transverse (gray thin line)components as well as the selected time window (vertical dashed line) for the SKS phase analyzed.The seismograms are corrected with a 15o sensor correction (θ; clockwise) applied to the north and east components.The right panel shows the initial particle motion.(b), (c) and (d) show splitting parameters calculated by the SC, RC and EV method.The left panel is the contour map of the transverse energy with the cross marking the best-fitting splitting parameters.The middle panel shows the corrected radial (bold line) and transverse (gray thin line) components, and the right panel is the corrected particl emotion. |
已有的地震探测研究表明青藏高原东北缘地壳平均厚度为60±5km[18-19, 31-39],为此,本研究将IASp91模型[40]的Moho深度修正到60km,并以此作为参考模型来计算Sp震相的透射点位置和进行时-深转换计算. 图 7显示了150km深度处Sp震相的透射点位置,基本覆盖了东北缘各个块体,为研究该区岩石圈厚度提供了数据保障.

|
图 7 Sp震相在150km深度的透射点分布(十字) 图中多边形将透射点分为19个格子, 并对透射点位于同一个格子的S波接收函数进行叠加以提供信噪比. Fig. 7 Cross marks show the locations of the piercing points of Sp waves at a depth of 150 km Traces with piercing points in each of the numbered boxes have been stacked to enhance signal. |
为了提高S波接收函数的信噪比,我们将研究区划分成19个区域(图 7),并将透射点位于同一区域内的S波接收函数进行叠加. 图 8展示了每个区域的叠加S波接收函数波形,为了方便读取LAB的深度,我们还将S波接收函数由时间域转换到深度域,考虑到地壳和地幔的横向非均匀性(5%的速度扰动),时-深转换过程可能会导致±4.0km的误差,这对于岩石圈尺度的研究是可以接受的.从图 8中可以识别出两个清晰的震相:位于45~65km深度的正震相和120~200km深度的负震相.其中正震相为来自Moho界面的Sp波,负震相为来自LAB的Sp波,反映岩石圈的厚度信息.

|
图 8 每个区域内的叠加S波接收函数波形 波形顶端数字对应图 7中划分的区域号, 底端数字为叠加的数据个数. Fig. 8 Stacked S receiver functions from each box in Fig.6 Numbers on top of the traces correspond to the boxes labeled in Fig.6. Numbers below the traces show the number of S-RFs stacked to form the composite signal. |
图 9展示了研究区内的岩石圈厚度分布,其中松潘-甘孜地体东北缘和西秦岭造山带下方具有较薄的岩石圈,LAB深度为125~135km;昆仑-阿尼玛卿缝合带以北地区的岩石圈厚度存在明显的横向变化,其中昆仑和祁连块体下方大部分区域岩石圈厚度为145~175km,阿尔金断裂与祁连山断裂交汇部位岩石圈厚度约为130~140km,祁连块体东部与阿拉善地块衔接的部位岩石圈厚度约为175km;柴达木盆地北缘造山带下方岩石圈厚达175km,盆地南缘造山带下方岩石圈厚达190km;鄂尔多斯和阿拉善块体下方的岩石圈厚度分别为170km和200km.本研究得到的LAB图像与先前的层析成像研究所得的结论基本一致[9-13],层析成像研究揭示昆仑-阿尼玛卿缝合带以北的东北缘大部分区域和克拉通下方存在上地幔高速异常,而缝合带以南的松潘-甘孜地体表现上地幔低速异常.

|
图 9 青藏高原东北缘LAB深度与上地幔各向异性图像 SKS分离参数分别来自McNamara & Owens(1994)[69](棕色条榜)、Wang等(2008)[70](紫色条榜)和本研究结果(黑色和红色条榜). Fig. 9 Map of the study area showing the depth of the LAB(color coded boxes, see Fig.6) and averaged SKS splitting parameters (bars) Splitting parameters (fast directions and delay times)are from McNamara & Owens (1994)[69](brown bars), Wangetal.(2008)[70](purple bars) and this study (black and red bars for observations north and south of the Kunlun-Ayimaqin suture, respectively). |
鄂尔多斯块体一直被认为是华北克拉通的一部分[41],虽然其边缘(银川、河套和山西、陕西)裂陷区发生了岩石圈的破坏和减薄,但内部仍保留着克拉通属性[42-44],本研究得到的块体南部较厚的岩石圈图像支持这一观点.阿拉善块体的归宿问题至今未有定论,一部分研究认为它是从华北古陆上分离出的一个小块体[45-46];也有研究认为阿拉善、塔里木和柴达木块体是具有统一发展共性的克拉通-西域板块[47-49].尽管从现今地震活动图像看,阿拉善块体与相邻的鄂尔多斯块体和塔里木盆地的缺震或少震图像形成鲜明对照[45],但本研究显示其岩石圈仍可与刚性和稳定的克拉通媲美.作为青藏高原的邻区,鄂尔多斯和阿拉善刚性块体对其北东向生长具有重要意义.
昆仑和祁连地块是青藏高原东北缘地壳缩短变形最强烈的地区,且存在明显的东、西部差异.地质学研究显示高原东北缘周边断裂系的滑动速率自西向东逐渐减小[50];GPS测量的研究区内沿地壳缩短方向(~N30°E)的地表运动速率自西向东也逐渐变小[51].这些研究均表明西部地壳较东部受到更强的挤压作用,变形更为强烈,从而导致西部主要发育一系列的逆冲推覆构造(如祁连山逆冲带),而东部还发育着一系列的山间盆地(如共和盆地、陇西盆地).从图 9可以看出高原东北缘岩石圈厚度同样存在横向变化,总体上看西部较东部厚,表明块体内部的东西变形差异可能是岩石圈尺度的.本研究得到的LAB图像还显示,祁连地块东部与阿拉善地块接壤的部位岩石圈较其他区域厚.先前的人工源地震探测揭示出阿拉善地块向祁连地块下方俯冲的岩石圈结构[52],笔者推测该区域较厚的岩石圈可能与阿拉善地块的俯冲有关.
柴达木盆地下方岩石圈的变形方式问题一直饱受争议[2-3, 12, 53-54].本研究显示盆地南缘和北缘造山带下方均具有较厚的岩石圈地幔,据此,我们推测柴达木盆地可能保留了原本刚性的岩石圈.有研究提出柴达木盆地和塔里木盆地在渐新世之前同属一个块体,之后由于阿尔金断裂的左旋走滑运动而被分开[55].塔里木盆地为一稳定的克拉通地块已被地球物理探测所证实[12, 56-57],作为塔里木盆地的亚块体,柴达木盆地在走滑之后可能仍然保持着母块体的刚性岩石圈性质,从而对向北挺进的青藏高原地幔流起到了阻挡作用[58-60],这便从另一个角度解释了为何在藏北岩石圈遭受大规模破坏[61-64]的背景下,祁连地块却保留了较厚的岩石圈.
本研究还显示,在松潘-甘孜地体北缘和西秦岭造山带下方,岩石圈相对较薄,厚度大约为125~135km.这一结果与Su等[65]由西秦岭石榴石相橄榄岩包体估计的岩石圈厚度(120km)相似,同样,An & Shi[66]由上地幔温度估算该地区的岩石圈厚度也仅为130km.紧邻本研究区域,Hu等[67]和Zhang等[68]在青藏高原东缘的研究显示四川盆地西缘具有超薄的岩石圈,他们的结果分别为100~120km和70~80km.这些研究均支持我们的S波接收函数结果.另外,深地震探测发现松潘-甘孜地块和西秦岭造山带同属统一的稳定的大陆地块[35],本研究得到的该区相似的岩石圈结构支持这一观点.
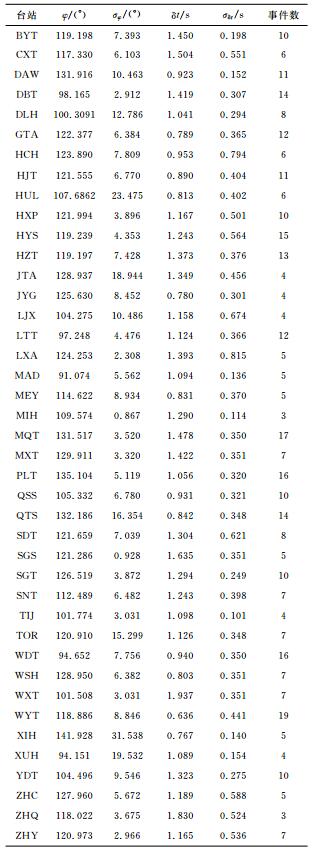
3.2 上地幔各向异性与变形样式本研究利用GM方法得到了青藏高原东北缘的SKS分裂图像(见表 1,图 9中黑色和红色条榜),从整体上看,该地区各向异性快轴方向(φ)为NW-SE方向,快、慢波延迟时间(δt)变化较大,范围为0.8~1.9s.先前,常利军等[20]和王琼等[21]曾利用甘肃区域台网资料分析了东北缘的上地幔各向异性特征,其结果在快波方向上与本研究结果基本一致.王琼等[21]在研究区东部的密集台站资料显示陇中盆地及其周缘上地幔各向异性快波偏振方向存在一定离散性,由于本研究中该区域台站覆盖较稀疏,没有观测到这一现象.
|
|
表 1 SKS分裂参数, σφ和σδt分别为φ和δt的测量误差 Table 1 SKS splitting parameters.σφ and σδtare measurement errors for φ and δt |
为了对比青藏高原内部与东北缘的地幔变形样式,我们引用了McNamara & Owens[69](图 9中棕色条榜)和Wang等[70](图 9中紫色条榜)的研究结果.可以看出,昆仑断裂带两侧的SKS快波方向存在明显差异,其南侧自高原内部呈顺时针旋转,而北侧基本沿NW-SE方向,表明高原内部与东北缘在地幔变形上存在不一致,昆仑断裂带在上地幔变形中起到了调节作用.
3.3 地幔盖层变形讨论青藏高原东北缘的地幔盖层变形样式是地学研究者关注的焦点之一,笔者通过对本研究得到的岩石圈厚度和上地幔各向异性的综合分析得到了一些新的认识.
从图 10可以看出,在昆仑-阿尼玛卿缝合带以北的昆仑和祁连地块,SKS分裂延迟时间与岩石圈厚度成正比关系,比例系数为0.007,即100km厚的各向异性层将造成0.7s的快、慢波延迟时间,表明在这些地区测量的各向异性主要来自于地幔盖层的变形.当介质各向异性程度达到4%时,100km厚的各向异性层将产生1s的快、慢波延迟时间[71],因此本研究结果显示青藏高原东北缘的地幔盖层各向异性程度不足4%.

|
图 10 SKS快、慢波延迟时间与岩石圈厚度的关系 黑色和蓝色填充的紫色圆圈对应图 9中昆仑-阿尼玛卿缝合带以北的结果; 红色圆圈对应图 9中昆仑-阿尼玛卿缝合带以南的结果; 图中虚线是对缝合带以北结果的拟合. Fig. 10 Relationship between the splitting delay times and lithospheric thickness in the study area The dashed line is fitted to observations north of the Kunlun-Ayimaqin suture from this study(black circles), and from Wang et al.(2008;purple circles; blue fill). |
上地幔各向异性被认为是由橄榄石等矿物在应力作用下的晶格优势排列导致的[72-74],通过地震波测量的快波方向与地幔形变方向一致[75].本研究通过SKS分裂测量的青藏高原东北缘地震波快波方向为NW-SE向,表明昆仑-阿尼玛卿缝合带以北地区的地幔盖层变形方向为NW-SE向,与印度-欧亚板块汇聚所产生的NE-SW向的应力方向垂直,说明该区地幔盖层发生了伸展变形,由于该地区上地幔各向异性程度不足4%,可以认为东北缘地幔盖层还处于变形的初级阶段.
与昆仑-阿尼玛卿缝合带以北不同,在松潘-甘孜地体北缘和西秦岭造山带,SKS分裂延迟时间变化相当剧烈,并且与岩石圈厚度不存在明显的相关性,这种随机关系表明这里的各向异性不可能只来源于地幔盖层的变形,而更应该来源于软流圈或更深部地幔物质的流动. Hu等[68]通过对青藏高原东缘岩石圈厚度的研究认为,在印度-欧亚板块碰撞作用的驱使下,青藏高原软流圈物质持续向东流动[38, 76],当遇到坚硬的四川盆地岩石圈[77-79]的阻挡后,一部分物质流转向了高原东南缘[60, 67, 80-81],同时,还有部分物质流沿四川盆地西缘向北流动[67];并且,Huang等[82]认为秦岭造山带下方的强地幔各向异性(SKS分裂时间≥1.80s)是由来自青藏高原的地幔流导致的.本研究中松潘-甘孜地体北缘和西秦岭造山带是这支向北流动的物质流的必经之地,该区较薄的岩石圈和强地幔各向异性特征为这一模型提供了新的证据.
4 结论本研究中,利用青海和甘肃区域地震台网的宽频带远震资料,采用S波接收函数方法和SKS波分裂分析方法,获取了青藏高原东北缘的岩石圈厚度和上地幔各向异性图像,结合该区已有的地质、地球物理研究成果,主要得到以下几点认识:
(1) 昆仑-阿尼玛卿缝合带以北的青藏高原东北缘地区保留了较厚的岩石圈,平均厚度接近160km,并向柴达木盆地(175~190km)、阿拉善地块(200km)和鄂尔多斯地块(170km)下方增厚(图 9);祁连地块东部与阿拉善地块接壤部位较厚的岩石圈反映了后者向祁连下方的俯冲.该区快、慢波延迟时间与岩石圈厚度的关系(图 10)表明SKS测量的上地幔各向异性主要来源于地幔盖层的伸展变形.
(2) 昆仑-阿尼玛卿缝合带以南的松潘-甘孜地体北缘和西秦岭造山带下方的岩石圈较薄,厚度只有125~135km(图 9).SKS快、慢波延迟时间与岩石圈厚度的关系(图 10)显示,这里上地幔各向异性主要来源于软流圈和其下方地幔的流动.
(3) 结合本研究结果和McNamara & Owens[69]与Wang等[70]的上地幔各向异性图像,我们发现昆仑断裂带两侧的SKS快波方向存在较大差异,其南侧的SKS快波方向自高原内部发生顺时针旋转,而北侧的东北缘地区基本呈统一的NW-SE方向,表明断裂两侧上地幔变形存在不一致性,这可能是导致昆仑断裂左旋走滑运动的机制之一.
致谢中国地震局地球物理研究所郑秀芬研究员和中国地震局地震预测研究所石玉涛助理研究员提供了青海和甘肃台网的地震资料;评审专家在审阅稿件的过程中提出了不少新颖的建议,在此一并表示衷心感谢.
| [1] | England P, Houseman G. Extension during continental convergence, with application to the Tibetan plateau. J. Geophys. Res. , 1989, 94(B12): 17561-17579. DOI:10.1029/JB094iB12p17561 |
| [2] | Tapponnier P, Xu Z Q, Francoise R, et al. Oblique stepwise rise and growth of the Tibet plateau. Science, 2001, 294(5547):1671-1677, doi:10.1126/science.105978. |
| [3] | Meyer B, Tapponnier P, Bourjot L, et al. Crustal thickening in Gansu-Qinghai, lithospheric mantle subduction, and oblique, strike-slip controlled growth of the Tibet plateau. Geophys. J. Int. , 1998, 135(1): 1-47. DOI:10.1046/j.1365-246X.1998.00567.x |
| [4] | Yue Y J, Liou J G. Two-stage evolution model for the Altyn Tagh fault, China. Geology, 1999, 27(3):227-230, doi:10.1030/0091-7613. |
| [5] | Fu B H, Awata Y. Displacement and timing of left-lateral faulting in the Kunlun Fault Zone, northern Tibet, inferred from geologic and geomorphic features. J. Asian Earth Sci. , 2007, 29(2-3): 253-265. DOI:10.1016/j.jseaes.2006.03.004 |
| [6] | Zheng D W, Zhang P Z, Wan J L, et al. Rapid exhumation at~8 Ma on the Liupan Shan thrust fault from apatite fission-track thermochronology:Implications for growth of the northeastern Tibetan Plateau margin. Earth Planet. Sci. Lett., 2006, 248(1-2):198-208, doi:10.1016/j.epsl.2006.05.023. |
| [7] | Li C Y, Zhang P Z, Yin J H, et al. Late Quaternary left-lateral slip rate of the Haiyuan fault, northeastern margin of the Tibetan Plateau. Tectonics, 2009, 28(5):TC5010, doi:10.1029/2008TC002302. |
| [8] | Zheng D W, Clark M K, Zhang P Z, et al. Erosion, fault initiation and topographic growth of the North Qilian Shan (Northern Tibetan Plateau). Geosphere, 2010, 6(6):937-941, doi:10.1130/GES00523.1. |
| [9] | Wittlinger G, Masson F, Poupinet G, et al. Seismic tomography of northern Tibet and Kunlun:Evidence for crustal blocks and mantle velocity contrasts. Earth Planet. Sci. Lett. , 1995, 139(1-2): 263-279. |
| [10] | 丁志峰, 何正勤, 吴建平, 等. 青藏高原地震波三维速度结构的研究. 中国地震 , 2001, 17(2): 202–209. Ding Z F, He Z Q, Wu J P, et al. Research on the 3-D seismic velocity structures in Qinghai-Xizang plateau. Earthquake Research in China (in Chinese) , 2001, 17(2): 202-209. |
| [11] | Huang Z X, Su W, Peng Y J, et al. Rayleigh wave tomography of China and adjacent regions. J. Geophys. Res., 2003, 108(B2):2073, doi:10.1029/2001JB001696. |
| [12] | Huang J L, Zhao D P. High-resolution mantle tomography of China and surrounding regions. J. Geophys. Res., 2006, 111(B9):B09305, doi:10.1029/2005JB004066. |
| [13] | Chen Y, Badal J, Hu J F. Love and Rayleigh wave tomography of the Qinghai-Tibet Plateau and surrounding areas. Pure Appl. Geophys. , 2010, 167(10): 1171-1203. DOI:10.1007/s00024-009-0040-1 |
| [14] | Kind R, Yuan X, Saul J, et al. Seismic images of crust and upper mantle beneath Tibet:Evidence for Eurasia plate subduction. Science , 2002, 298(5596): 1219-1221. DOI:10.1126/science.1078115 |
| [15] | Wittlinger G, Farra V, Vergen J. Lithospheric and upper mantle stratifications beneath Tibet:New insight from Sp conversions. Geophys. Res. Lett., 2004, 31:L19615, doi:10.1029/2004GL020955. |
| [16] | Zhao J, Yuan X, Liu H, et al. The boundary between the Indian and Asian tectonic plates below Tibet. Proc. Natl. Acad. Sci. , 2010, 107: 11229-11233. DOI:10.1073/pnas.1001921107 |
| [17] | Zhao W J, Kumar P, Mechie J, et al. Tibetan plate overriding the Asian plate in central and northern Tibet. Nature Geoscience, 2011, 4:870-873, doi:10.1038/NGEO1309. |
| [18] | 高锐, 王海燕, 王成善, 等. 青藏高原东北缘岩石圈缩短变形--深地震反射剖面再处理提供的证据. 地球学报 , 2011, 32(5): 513–520. Gao R, Wang H Y, Wang C S, et al. Lithospheric deformation shortening of the northeastern Tibetan plateau:Evidence from reprocessing of deep seismic reflection data. Acta Geoscientica Sinica (in Chinese) , 2011, 32(5): 513-520. |
| [19] | Tian X B, Zhang Z J. Crustal thickness and Vp/Vs ratios from the northeastern Tibetan Plateau:Evidence of internal crustal deformation. Gondwana Research, 2012, submitted. |
| [20] | 常利军, 王椿镛, 丁志峰, 等. 青藏高原东北缘上地幔各向异性研究. 地球物理学报 , 2008, 51(2): 431–438. Chang L J, Wang C Y, Ding Z F, et al. Seismic anisotropy of upper mantle in the northeastern margin of the Tibetan plateau. Chinese J. Geophys. (in Chinese) , 2008, 51(2): 431-438. |
| [21] | 王琼, 高原, 石玉涛等.青藏高原东北缘上地幔各向异性.地球物理学报, 2013, 待刊. Wang Q, Gao Y, Shi Y T, et al. Seismic anisotropy in the uppermost mantle beneath the northeastern margin of Qinghai-Tibet plateau. Chinese J. Geophys. (in Chinese), 2013, in press. http://www.cnki.com.cn/Article/CJFDTotal-DQWX200802016.htm |
| [22] | Kumar P, Yuang X H, Kind R, et al. Imaging the colliding Indian and Asian lithospheric plates beneath Tibet. J. Geophys. Res., 2006, 111(B6):B06308, doi:10.1029/2005JB003930. |
| [23] | Kumar P, Yuan X H, Kumar M R, et al. The rapid drift of the Indian tectonic plate. Nature, 2007, 449(7164):894-897, doi:10.1038/nature0621410.1038/nature06214 |
| [24] | Wilson D C, Angus D A, Ni J F, et al. Constraints on the interpretation of S-to-P receiver functions. Geophys. J. Int. , 2006, 165(3): 969-980. DOI:10.1111/gji.2006.165.issue-3 |
| [25] | Yuan X H, Kind R, Li X Q, et al. The S receiver functions:synthetics and data example. Geophys. J. Int. , 2006, 165(2): 555-564. DOI:10.1111/gji.2006.165.issue-2 |
| [26] | Tian X B, Zhang J L, Si S K, et al. SKS splitting measurements with horizontal component misalignment. Geophys. J. Int., 2011, 185(1):329-340, doi:10.1111/j.1365-246X.2011.04936.x. |
| [27] | Kiefer J. "Conditional Confidence Statements and Confidence Estimators (with discussion)". Journal of the American Statistical Association , 1977, 72: 789-827. |
| [28] | Wolfe C J, Silver P G. Seismic anisotropy of oceanic upper mantle:shear wave splitting methodologies and observations. J. Geophys. Res. , 1998, 103(B1): 749-771. DOI:10.1029/97JB02023 |
| [29] | Silver P G, Chan W W. Shear wave splitting and subcontinental mantle deformation. J. Geophys. Res. , 1991, 96(B10): 16429-16454. DOI:10.1029/91JB00899 |
| [30] | Bowman J R, Ando M. Shear-wave splitting in the upper-mantle wedge above the Tonga subduction zone. Geophys. J. Roy. Astr. Soc. , 1987, 88(1): 25-41. DOI:10.1111/j.1365-246X.1987.tb01367.x |
| [31] | Vergne J, Wittlinger G, Hui Q, et al. Seismic evidence for stepwise thickening of the crust across the NE Tibetan plateau. Earth Planet. Sci. Lett. , 2002, 203(1): 25-33. DOI:10.1016/S0012-821X(02)00853-1 |
| [32] | Galvé A, Hirn A, Jiang M, et al. Modes of raising northeastern Tibet probed by explosion seismology. Ear. Plan. Sci. Lett. , 2002, 203(1): 35-43. DOI:10.1016/S0012-821X(02)00863-4 |
| [33] | Li S G, Mooney W D, Fan J C. Crustal structure of mainland China from deep seismic sounding data. Tectonophysics , 2006, 420(1-2): 239-252. DOI:10.1016/j.tecto.2006.01.026 |
| [34] | Liu M G, Mooney W D, Li S D, et al. Crustal structure of the northeastern margin of the Tibetan plateau from the Songpan-Ganzi terrane to the Ordos basin. Tectonophysics , 2006, 420(1-2): 253-266. DOI:10.1016/j.tecto.2006.01.025 |
| [35] | 高锐, 王海燕, 马永生, 等. 松潘地块若尔盖盆地与西秦岭造山带岩石圈尺度的构造关系--深地震反射剖面探测成果. 地球学报 , 2006, 27(5): 411–418. Gao R, Wang H Y, Ma Y S, et al. Tectonic relationships between the Zoigê basin of the Song-Pan block and the west Qinling orogen at lithosphere scale:Results of deep seismic reflection profiling. Acta Geoscientica Sinica (in Chinese) , 2006, 27(5): 411-418. |
| [36] | 高锐, 熊小松, 李秋生, 等. 由地震探测揭示的青藏高原莫霍面深度. 地球学报 , 2009, 30(6): 761–773. Gao R, Xiong X S, Li Q S, et al. The Moho depth of Qinghai-Tibet plateau revealed by seismic detection. Acta Geoscientia Sinica (in Chinese) , 2009, 30(6): 761-773. |
| [37] | 王海燕, 高锐, 马永生, 等. 若尔盖与西秦岭地震反射岩石圈结构和盆山耦合. 地球物理学报 , 2007, 50(2): 472–481. Wang H Y, Gao R, Ma Y S, et al. Basin-range coupling and lithosphere structure between the Zoigê and the west Qinling. Chinese J. Geophys. (in Chinese) , 2007, 50(2): 472-481. |
| [38] | 滕吉文, 白登海, 杨辉, 等. 2008年汶川Ms8.0地震发生的深层过程和动力学响应. 地球物理学报 , 2008, 51(5): 1385–1402. Teng J W, Bai D H, Yang H, et al. Deep processes and dynamic responses associated with the Wenchuan Ms8.0 earthquake of 2008.. Chinese J. Geophys. (in Chinese) , 2008, 51(5): 1385-1402. |
| [39] | Zhang Z J, Klemperer S, Bai Z M, et al. Crustal structure of the Paleozoic Kunlun orogeny from an active-source seismic profile between Moba and Guide in East Tibet, China. Gond. Res., 2010, 19(4):994-1007, doi:10.1016/j.gr.2010.09.008. |
| [40] | Kennett B L N, Engdahl E R. Traveltimes for global earthquake location and phase identification. Geophys. J. Int. , 1991, 105(2): 429-465. DOI:10.1111/gji.1991.105.issue-2 |
| [41] | Zhao G C, Sun M, Wilde S A, et al. Late Archean to Paleoproterozoic evolution of the North China Craton:Key issues revisited. Precambrian Res. , 2005, 136(2): 177-202. DOI:10.1016/j.precamres.2004.10.002 |
| [42] | Tian Y, Zhao D P, Sun R M, et al. Seismic imaging of the crust and upper mantle beneath the North China Craton. Physics of the Earth and Planetary Interiors , 2009, 172(3-4): 169-182. DOI:10.1016/j.pepi.2008.09.002 |
| [43] | 陈凌, 危自根, 程骋. 从华北克拉通中、西部结构的区域差异性探讨克拉通破坏. 地学前缘 , 2010, 17(1): 212–228. Chen L, Wei Z G, Cheng C. Significant structural variations in the Central and Western North China craton and its implications for the craton destruction. Earth Science Frontiers (in Chinese) , 2010, 17(1): 212-228. |
| [44] | Tian X B, Teng J W, Zhang H S, et al. Structure of crust and upper mantle beneath the Ordos Block and the Yinshan Mountains revealed by receiver function analysis. Physics of the Earth and Planetary Interiors , 2011, 184(3-4): 186-193. DOI:10.1016/j.pepi.2010.11.007 |
| [45] | 王萍, 王增光. 阿拉善活动块体的划分及归宿. 地震 , 1997, 17(1): 103–112. Wang P, Wang Z G. Division of the Alxa block and its attribution. Earthquake (in Chinese) , 1997, 17(1): 103-112. |
| [46] | 马杏垣. 中国及邻近海域岩石圈动力学图(1:400万). 北京: 地质出版社, 1986 . Ma X Y. Lithospheric Dynamics Map of China and Adjacent Areas (in Chinese). Beijing: Geological Publishing House, 1986 . |
| [47] | 葛肖虹, 刘俊来. 被肢解的"西域克拉通". 岩石学报 , 2000, 16(1): 59–66. Ge X H, Liu J L. Broken "Western China Craton". Acta Petrologica Sinica (in Chinese) , 2000, 16(1): 59-66. |
| [48] | 葛肖虹, 任收麦, 刘永江, 等. 中国西部的大陆构造格架. 岩石学报 , 2001, 22(5): 1–5. Ge X H, Ren S M, Liu Y J, et al. Continental tectonic framework of west China. Acta Petrologica Sinica (in Chinese) , 2001, 22(5): 1-5. |
| [49] | 葛肖虹, 马文璞, 刘俊来, 等. 对中国大陆构造格架的讨论. 中国地质 , 2009, 36(5): 949–965. Ge X H, Ma W P, Liu J L, et al. A discussion on the tectonic framework of Chinese mainland. Geology in China (in Chinese) , 2009, 36(5): 949-965. |
| [50] | Kirby E, Harkins N, Wang E Q, et al. Slip rate gradients along the eastern Kunlun fault. Tectonics, 2007, 26(2), doi:10.1029/2006TC002033. |
| [51] | Gan W J, Zhang P Z, Shen Z K, et al. Present-day crustal motion within the Tibetan Plateau inferred from GPS measurements. J. Geophys. Res., 2007, 112(B8), doi:10.1029/2005JB004120. |
| [52] | 高锐, 李朋武, 李秋生, 等. 青藏高原北缘碰撞变形的深部过程--深地震探测成果之启示. 中国科学(D辑:地球科学) , 2001, 44(S1): 71–78. Gao R, Li P W, Li Q S, et al. Deep process of the collision and deformation on the northern margin of the Tibetan Plateau:Revelation from investigation of the deep seismic profiles. Science in China (Series D) (in Chinese) , 2001, 44(S1): 71-78. DOI:10.1007/BF02911973 |
| [53] | 宋仲和, 安昌强, 陈国英, 等. 中国西部三维速度结构及其各向异性. 地球物理学报 , 1991, 34(6): 694–707. Song Z H, An C Q, Chen G Y, et al. Study on 3D velocity structure and anisotropy beneath the west China from the Love wave dispersion. Acta Geophysica Sinica (Chinese J. Geophys.) (in Chinese) , 1991, 34(6): 694-707. |
| [54] | 朱仁学, 胡祥云. 格尔木-额济纳旗地学断面岩石圈电性结构的研究. 地球物理学报 , 1995, 38(S2): 46–57. Zhu R X, Hu X Y. Study on the resistivity structure of the lithosphere along the Golmud-Ejin Qi geoscience transect. Acta Geophysica Sinica (Chinese J. Geophys.) (in Chinese) , 1995, 38(S2): 46-57. |
| [55] | Meng Q R, Hu J M, Yang F Z. Timing and magnitude of displacement on the Altyn Tagh fault:constraints from stratigraphic correlation of adjoining Tarim and Qaidam basins, NW China. Terra Nova, 2001, 13(2):86-91, doi:10.1046/j.1365-3121.2001.00320.x. |
| [56] | 王良书, 李成, 杨春. 塔里木盆地岩石层热结构特征. 地球物理学报 , 1996, 39(6): 794–803. Wang L S, Li C, Yang C. The lithospheric thermal structure beneath Tarim basin, Western China. Acta Geophysica Sinica (Chinese J. Geophys.) (in Chinese) , 1996, 39(6): 794-803. |
| [57] | Xu Y, Liu F T, Liu J H, et al. Crust and upper mantle structure beneath western China from P wave travel time tomography. J. Geophys. Res., 2002, 107(B10):ESE4-1-ESE4-15, doi:1029/2001JB000402. |
| [58] | Basu A R, Wang J W, Huang W K, et al. Major element, REE, and Pb, Nd and Sr isotopic geochemistry of Cenozoic volcanic rocks of eastern China:Implications for their origin from suboceanic-type mantle reservoirs. Earth Planet. Sci. Lett. , 1991, 105(1-3): 149-169. DOI:10.1016/0012-821X(91)90127-4 |
| [59] | Flower M, Tamaki K, Hoang N. Mantle extrusion:A model for dispersed volcanism and DUPAL-like asthenosphere in East Asia and the western Pacific.//Flower M F J ed. Mantle Dynamic and Plate Interaction in East Asia. Washington:AGU. Geodyn. Ser., 1998, 27:67-88. http://onlinelibrary.wiley.com/doi/10.1029/GD027p0067/pdf |
| [60] | Liu M, Cui X, Liu F. Cenozoic rifting and volcanism in eastern China:A mantle dynamic link to the indo-Asian collision?. Tectonophysics , 2004, 393(1-4): 29-42. DOI:10.1016/j.tecto.2004.07.029 |
| [61] | Brandon C, Romanowicz B. A ''no-lid'' zone in the central Chang-Thang platform of Tibet:Evidence from pure path phase velocity measurements of long period Rayleigh waves. J. Geophys. Res. , 1986, 91(B6): 6547-6564. DOI:10.1029/JB091iB06p06547 |
| [62] | McNamara D E, Owens T J, Walter W R. Observations of regional phase propagation across the Tibetan Plateau. J. Geophys. Res. , 1995, 100(B11): 22215-22229. DOI:10.1029/95JB01863 |
| [63] | Owens T J, Zandt G. Implications of crustal property variations for models of Tibetan plateau evolution. Nature , 1997, 387(6628): 37-43. DOI:10.1038/387037a0 |
| [64] | Rodgers A J, Schwartz S Y. Lithospheric structure of the Qiangtang Terrane, northern Tibetan Plateau, from complete regional waveform modeling:Evidence for partial melt. J. Geophys. Res. , 1998, 103(B4): 7137-7152. DOI:10.1029/97JB03535 |
| [65] | Su B X, Zhang H F, Sakyi P A, et al. Compositionally stratified lithosphere and carbonatite metasomatism recorded in mantle xenoliths from the Western Qinling (Central China). Lithos. , 2010, 116(1-2): 111-128. DOI:10.1016/j.lithos.2010.01.004 |
| [66] | An M J, Shi Y L. Lithospheric thickness of the Chinese continent. Phys. Earth Planet. Inter. , 2006, 159(3-4): 257-266. DOI:10.1016/j.pepi.2006.08.002 |
| [67] | Hu J F, Xu X Q, Yang H Y, et al. S receiver function analysis of the crustal and lithospheric structures beneath eastern Tibet. Ear. Plan. Sci. Lett., 2011, 306(1-2):77-85, doi:10.1016/j.epsl.2011.03.034. |
| [68] | Zhang Z J, Yuan X H, Chen Y, et al. Seismic signature of the collision between the east Tibetan escape flow and the Sichuan Basin. Earth and Planet. Sci. Let. , 2010, 292(3-4): 254-264. DOI:10.1016/j.epsl.2010.01.046 |
| [69] | McNamara D E, Owens T J, Silver P G. Shear wave anisotropy beneath the Tibetan plateau. J. Geophys. Res. , 1994, 99(B7): 13655-13665. DOI:10.1029/93JB03406 |
| [70] | Wang C Y, Flesch L M, Silver P G, et al. Evidence for mechanically coupled lithosphere in central Asia and resulting implications. Geology, 2008, 36(5):363-366, doi:10.1130/G24450A. |
| [71] | Silver P G, Chan W W. Implications for continental structure and evolution from seismic anisotropy. Nature , 1988, 335(6185): 34-39. DOI:10.1038/335034a0 |
| [72] | Christensen N I. The magnitude, symmetry and origin of upper mantle anisotropy based on fabric analyses of ultramafic tectonites. Geophys. J. R. Astron. Soc. , 1984, 76(1): 89-111. DOI:10.1111/j.1365-246X.1984.tb05025.x |
| [73] | Nicolas A, Christensen N I. Formation of anisotropy in upper mantle peridotites-a review.//Fuchs K, Froideveaux C, eds. Composition, Structure and Dynamics of the Lithosphere-Asthenosphere System. Washington:American Geophysical Union. Geodyn. Ser., 1987, 16:111-123. http://onlinelibrary.wiley.com/doi/10.1029/GD016p0111/summary |
| [74] | Zhang S Q, Karato S I. Lattice preferred orientation of olivine aggregates deformed in simple shear. Nature , 1995, 415(6534): 777-780. |
| [75] | Long M D, Silver P G. Shear wave splitting and mantle anisotropy:measurements, interpretations, and new directions. Surv. Geophys. , 2009, 30(4-5): 407-461. DOI:10.1007/s10712-009-9075-1 |
| [76] | 滕吉文. 强烈地震孕育与发生的地点、时间及强度预测的思考与探讨. 地球物理学报 , 2010, 53(8): 1749–1766. Teng J W. Ponder and research on the genesis and occurrence of strong earthquakes and the prediction of their place, time and intensity. Chinese J. Geophys. (in Chinese) , 2010, 53(8): 1749-1766. |
| [77] | 孙若昧, 刘福田, 刘建华. 四川地区的地震层析成像. 地球物理学报 , 1991, 34(6): 708–716. Sun R M, Liu F T, Liu J H. Seismic tomography of Sichuan. Acta Geophysica Sinica (Chinese J. Geophys.) (in Chinese) , 1991, 34(6): 708-716. |
| [78] | 张雪梅, 孙若昧, 滕吉文. 青藏高原及其邻区地壳、岩石圈和软流层厚度研究. 科学通报 , 2007, 52(6): 797–804. Zhang X M, Sun R M, Teng J W. Study on crustal, lithospheric and asthenospheric thickness beneath the Qinghai-Tibet plateau and its adjacent areas. Chinese Science Bulletin (in Chinese) , 2007, 52(6): 797-804. DOI:10.1007/s11434-007-0110-7 |
| [79] | 雷建设, 赵大鹏, 苏金蓉, 等. 龙门山断裂带地壳精细结构与汶川地震发震机理. 地球物理学报 , 2009, 52(2): 339–345. Lei J S, Zhao D P, Su J R, et al. Fine seismic structure under the Longmenshan fault zone and the mechanism of the large Wenchuan earthquake. Chinese J. Geophys. (in Chinese) , 2009, 52(2): 339-345. |
| [80] | Clark M K, Royden L H. Topographic ooze:Building the eastern margin of Tibet by lower crustal flow. Geology , 2000, 28(8): 703-706. DOI:10.1130/0091-7613(2000)28<703:TOBTEM>2.0.CO;2 |
| [81] | Cook K L, Royden L H. The role of crustal strength variations in shaping orogenic plateaus, with application to Tibet. J. Geophys. Res., 2008, 113(B8):B08407, doi:10.1029/2007JB005457. |
| [82] | Huang Z C, Xu M J, Wang L S, et al. Shear wave splitting in the southern margin of the Ordos Block, north China. Geophys. Res. Lett., 2008, 35(19):l19301, doi:10.1029/2008GL035188. |