 2013, Vol. 56


2. 中国石油塔里木油田分公司勘探开发研究院,乌鲁木齐 841000
2. Research Institute of Exploration and Development, Tarim Oilfield Company, Petro China, Urumqi 841000, China
云南地区位于青藏高原、印支地块和扬子地台相互作用的交汇部位,对印度板块和欧亚板块碰撞产生的岩石圈变形及青藏块体东南向挤出变形具有重要的吸收和调节作用[1-3],是探讨印度-欧亚板块碰撞造成陆内变形及其动力学过程的关键地区.研究区内分布有怒江断裂、澜沧江断裂和红河断裂等深大断裂,这些断裂将云南地区划分成四个不同的构造块体:腾冲地块、保山地块、思茅地块和扬子地台(图 1).此外,在腾冲地块内有第四纪活火山活动,可能与印度板块东向深俯冲作用密切相关[4-5].

|
图 1 研究区大地构造背景及流动地震台站(黑边红三角)位置 F1,怒江断裂;F2,澜沧江断裂;F3,红河断裂;F4,小江断裂;Ⅰ,腾冲块体;Ⅱ,保山块体;Ⅲ,思茅块体;Ⅳ,扬子块体;无黑边红三角为腾冲火山;黑线为主要活动断裂.插图为研究区所在位置. Fig. 1 Tectonic setting of study area and portable seismic stations (red triangles with black frames) F1, Nujiang Fault; F2, Lancang River Fault; F3, Red River Fault; F4, Xiaojiang Fault; Ⅰ, Tengchong Block; Ⅱ, Baoshan Block; Ⅲ, Simao Block; Ⅳ, Yangtze Block; The red triangle without black frame denotes Tengchong volcano; Black lines denote main active faults; The insert map shows location of study region. |
目前,对本研究区陆内变形机制的研究除了使用GPS观测资料[6-8]外,地震各向异性被认为是研究地球深部介质变形特征的最为有效手段之一[9-10].譬如,利用近震S波可获得中上地壳各向异性[11-12]、Pn波可获得上地幔顶部各向异性[13-15]和SKS震相可获得上地幔各向异性[16-18].Royden等[19]提出下地壳流对青藏高原的形成和演化具有极重要意义,这一观点得到大地电磁测深[20]和地震层析成像[21-22]显示出青藏高原东缘下地壳存在着高导、低波速层结果的支持.徐震等[3]和Chen等[23]尽管利用Pms(莫霍面转换)震相对哀牢山-红河断裂带附近流动地震台站和云南固定地震台站下方的下地壳各向异性进行了研究.然而,由于研究区内山高岭峻、地形复杂、交通不便,且滑坡泥石流随处可见,致使在红河断裂两侧和腾冲火山区的地震台站分布极其稀疏,而这些地区下方是否存在下地壳流[19-22]和腾冲火山下方是否存在热物质上涌[5]及其在下地壳是否形成形变,目前我们并不清楚.然而,这些形变对于认识青藏高原的形成和演化具有重要科学意义.为此,中国地震局地壳应力研究所2010-2011年期间在云南红河断裂两侧和腾冲火山区布设了21个宽频带流动地震观测点[24],为认识青藏高原动力学演化提供了宝贵的数据资料.本研究拟使用流动地震台站记录到的远震波形资料,通过Pms震相获得中下地壳各向异性,以揭示该地区地壳变形特征和深部动力学过程.
2 资料与方法2010年4月至2011年6月,中国地震局地壳应力研究所在云南地区布设了21个宽频带流动地震台站[24],获取了宝贵的第一手地震观测资料.野外设备由中国地震科学台阵数据管理中心提供,其中的地震计为CMG-3ESPC(带宽60 s~50 Hz)、采集器为Reftek-130B.所有设备的采样率均为100 sps.通过挑选信噪比高、初至P波及Pms震相清晰的远震事件,获得震中距在30°~95°之间、震级MS>5.5级的远震事件370个(图 2a),主要分布在西太平洋俯冲带地区,但在印度洋中脊、欧洲地区也有零星分布,因此具有一定的空间方位覆盖.

|
图 2 远震事件震中(白色圆圈)分布 三角为21个台站近似中心位置.(a)具有高质量接收函数的370个远震事件分布;(b)Pms分裂所用到的183个远震事件分布.星号表示图 3所用波形的事件分布. Fig. 2 Distribution of teleseismic hypocenters (white circles) The triangle shows the center of the 21 portable seismic stations.(a) The 370 teleseismic events with good receiver functions; (b) The 183 teleseismic events that are used to the Pms splitting analysis.The star denotes the event having the waveforms used in Fig.3. |
Pms震相是指远震P波经Moho面之后转换为Sv波.当Sv波在地壳中传播时,遇到各向异性层时会分裂成偏振方向相垂直的快Pms和慢Pms. McNamara和Owens[25]在利用接收函数技术得到Moho面转换波Pms基础上,提出了获取地壳各向异性参数的方法.该方法不仅有接收函数技术横向分辨高的优点,而且还有各向异性深度范围相对明确的优势[26].在接收函数求取过程中所用的高斯参数(低通滤波器的滤波参数)较为重要,因为它不仅决定所求接收函数的稳定性,还直接影响接收函数的分辨率,因此在实际工作中需要选择适当的高斯参数.
常用的横波分裂测量方法主要有旋转相关法(RC)、特征值法(EV)和切向能量最小化方法(SC)等.由于这三种方法各有其自身优势,因此在实际工作中根据不同的研究区经反复试验选择一种适合的方法.在本研究中,我们选取由若干个地震台站记录的高信噪比的高质量波形资料,使用上述三种不同分析方法分别获得研究结果,通过统计分析从而确定本研究使用的分析方法.图 3展示了以YNL20台站记录到的2011年6月13日发生在印尼马鲁古海6.3级地震事件(如图 2b中星号所示)波形资料为例选取本研究方法的过程,可以看到在高斯参数为3.0~4.0时利用不同横波分裂分析方法所得到的分裂参数值相对稳定且基本一致,但考虑到波形的平滑性及减少高频噪声的影响,本项工作中选择了高斯滤波参数为3.0的低通滤波器.另外,由图 3还可以看到,在利用不同高斯参数选取的远震接收函数的Pms震相进行横波分裂时,利用切向能量最小化方法得到的分裂参数,无论是延迟时间还是快波偏振方向,均处于由旋转相关法与特征值法得到的结果之间,因而认为本研究采用切向能量最小化方法较为合理.

|
图 3 使用不同高斯参数和不同横波分裂分析方法研究结果对比图 (a)利用时间域迭代反褶积法和不同的高斯参数计算接收函数分离得到的Pms震相;(b,c)不同高斯参数和不同横波分裂分析方法得到的分裂时差和快波偏振方向.图中所用的波形为YNL20台站记录到的2011年6月13日发生在印尼马鲁古海的6.3级地震(如图 2b所示).SC,切向能量最小化方法;RC,旋转相关法;EV,特征值法. Fig. 3 A comparison between results inferred from different Guassian parameters and S-wave splitting techniques (a) The phase Pms inferred from iterative deconvolution in time-domain using different Guassian parameters; (b, c) The splitting time delay and the polarization direction of fast wave inferred from different techniques with different Guassian parameters.The waveform used here was recorded at the station YNL20 from the 13 June 2011 Indonesian earthquake (M6.3)(Fig.2b).SC, Minimum energy method; RC, Rotation-correlation method; EV, Eigenvalue method. |
本文使用Pms震相分裂分析方法的基本步骤如图 4所示.首先,利用时间域迭代反褶积方法[27]求取远震接收函数的径向分量和切向分量;然后挑选信噪比高且可靠的Pms震相波形,Pms震相的周期约为1 s[25].本研究利用人工识别截取Pms震相,时窗长度包含R和T分量上的整个Pms震相,且在两个分量上时窗长度均大于一个且小于两个Pms震相周期;再利用切向能量最小化方法[28]进行横波分裂分析,其中快波偏振方向以1°为步长在-90°~90°范围内搜索、快慢波延迟以0.025 s为步长在0.0~0.5 s范围内搜索;最后对同一台站的多个拾取结果采用叠加方法[29]求取平均值,并通过重新计算自由度来获得误差估计的置信区间(图 5).

|
图 4 Pms分裂分析过程实例 (a)利用时间域迭代反褶积法(高斯参数设为3.0)计算得到的远震接收函数(台站YNL12记录到的远震事件2010.097.14:32:33),其中矩形框标示出所确定的Pms横波分析窗口.(b)分析窗口内的Pms波形图.虚线对应径向分量,而实线对应切向分量.(c)分析窗口内校正后的快波(虚线)和慢波(实线)波形图.(d)校正后的径向(虚线)和切向(实线)分量波形图.(e)校正前(虚线)、后(实线)的质点运动图.(f)切向能量等值线图.直线交叉处代表最佳参数位置,而封闭的阴影部分则代表置信区间. Fig. 4 An example of Pms splitting analysis (a) The receiver functions for the teleseismic event 2010.097.14:32:33 recorded by station YNL12 that are calculated by iterative deconvolution in time-domain with a Guassian parameter of 3.0.The rectangular frame shows the analyzed window of Pms we defined.(b) Waveform in the window.The dashed line and solid line correspond to radial and transverse component, respectively.(c) The fast (dashed line) and slow (solid line) waves after correction.(d) The radial (dashed line) and transverse (solid line) waveforms after correction. (e) The particle motion of the Pms phase before (dashed line) and after (solid line) correction.(f) Isolines of transverse energy.The crossing point of the line denotes the optimal position, and the closed shadow denotes the confidence interval. |

|
图 5 台站YNL20所利用的6个远震事件切向能量叠加等值线图 直线交叉处代表最佳参数位置,而封闭的阴影部分则代表置信区间. Fig. 5 The stacking contour plot of transverse energy for all 6 events we used for station YNL20 The crossing point of the line denotes the optimal position, and the closed shadow denotes the confidence interval. |
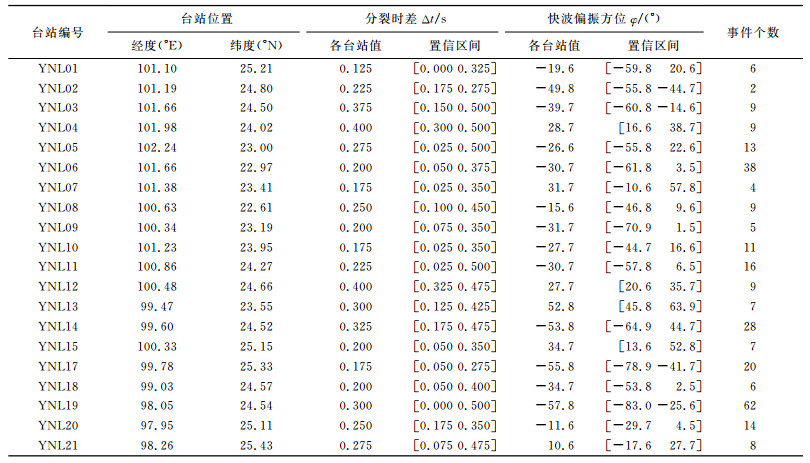
利用21个宽频带流动地震台站三分量地震记录求取远震接收函数,获得1792对高信噪比的径向和切向分量波形资料,经横波分裂分析得到了20个台站记录到的183个远震(图 2b)共283对较为理想的拾取结果.对同一台站的多个结果,采用切向能量叠加方法求取分裂参数的平均值及其误差估计(表 1和图 6).由于YNL16台记录到的波形质量的原因,未能得到有意义的研究结果.由表 1和图 6可知,云南地区各向异性强度在0.15 s到0.40 s之间变化,其平均值为0.25 s,而且其强弱分布与地表地质构造存在一定的相关性,即扬子地台和保山地块的各向异性比思茅地块强.从各向异性方向来看,除在断裂带走向变化剧烈处的YNL04和YNL12台下方各向异性快波方向与断裂带相垂直外,多数台站下方各向异性快波方向基本与断裂带走向相一致.腾冲地块的各向异性与其他几个块体均存在着差别,其快波方向基本与断裂带走向不相关,但却以腾冲火山为中心向四周发散,其强度总体上表现出北强南弱的特征.
|
|
表 1 云南地区Pms分裂参数 Table 1 The Pms splitting parameters beneath the Yunnan region |

|
图 6 云南地区地壳各向异性特征 白色圆圈中心为台站位置,各台站位置处的红色条棒为对应台站的平均分裂参数.白色圆圈大小与分裂时差成正比,具体比例参见图中左下角比例尺,红色条棒方位代表快波偏振方向.蓝色为GPS速度场. Fig. 6 The crustal anisotropy beneath the Yunnan region White circles denote seismic stations.The red bar at each station denotes the average splitting parameters.The size of the white circle is proportional to the time delay as shown on the lower left, and the orientation of the red bar denotes the polarization direction of fast wave. The blue line denotes the GPS velocity field. |
一般而言,地壳浅部裂隙较为发育,定向排列的(流体填充的)裂隙可能是上地壳各向异性存在的重要原因.剪切波在此类各向异性介质中传播会发生分裂,其快波偏振方向与裂隙的走向、最大水平压应力方向一致[30].云南地区最大主压应力方向为NNW-SSE或近N-S[31],与利用近震S波分裂获取的上地壳快波偏振方向一致[12],从而推断该地区上地壳各向异性是由定向排列的裂隙引起的.本研究获取的地壳各向异性快波方向与研究区域内断裂带走向相一致,与最大主压应力方向存在较大差异.因此,推测在中下地壳部分裂隙基本闭合,其各向异性可能主要与其造岩矿物(如云母、角闪石)晶格定向排列或者熔体的定向排列有关.
利用横波分裂分析方法获得的各向异性,尽管具有较强的横向分辨率,但其纵向分辨率较弱,因此很难确定各向异性所在的深度范围.根据中国地震局台网中心资料,经双差重新精定位,统计出云南地区的地震多发生在中上地壳的10~15 km深度以上[24],Shi等[12]和Gao等[11]在云南地区利用近震S波分裂得到的每公里平均延迟时间约为1.8±1.2 ms,从而估算出中上地壳深度范围内快慢波延迟量为0.01~0.05 s.本文由Pms震相分裂得到的反映整个地壳介质各向异性强度的慢波时间延迟量平均为0.25 s,因而认为在云南地区地壳各向异性主要是由下地壳介质形变引起.
下地壳各向异性层的厚度可由延迟时间来近似估算.假定各向异性层为单层模型,则层的厚度[32]可表示为L=dt·VS/K,其中dt为Pms震相的延迟时间,VS为该层的S波速度,K为该层的各向异性度.如果扣除上地壳各向异性延迟时间,则下地壳各向异性时间延迟为0.2~0.24 s,云南地区的下地壳各向异性度K为4.4%[33],下地壳平均S波速度为3.5 km/s[2],从而得到该地区下地壳各向异性层厚度约16~19 km.利用接收函数获取云南地区(26°N以南)不同构造分区的地壳厚度为33~49 km[34-36],如果各向异性层厚度与下地壳厚度基本一致,则中上地壳厚度为17~30 km,这与波形反演[37]和人工地震测深[38-39]所得中上地壳厚度相近,说明本文利用延迟时间计算得到的下地壳各向异性层厚度基本合理.
4.2 地壳内部及壳幔耦合/解耦变形分析为便于了解不同深度层各向异性的趋势性变化,我们将前人近震S波各向异性[12]、本研究获得的下地壳各向异性(表 1和图 6)及前人上地幔各向异性[12, 16]的快波方向在研究区内进行内插,其结果如图 7a-7c所示.需要说明的是,在无台站之处的内插结果的可靠性会低些,因此本研究主要讨论有台站分布地区的各向异性趋势性特征.由于近震各向异性结果基本代表了上地壳形变特征,Pms各向异性结果基本反映下地壳形变特征,SKS各向异性结果基本代表了上地幔形变特征,因此使用这三者之间的关系可近似讨论不同深度的圈层耦合关系.

|
图 7 云南地区不同深度范围各向异性特征 黑色条棒为对应台站的快波偏振方向,白色条棒代表插值后的快波偏振方向;色标对应的是快、慢波时间延迟量.(a)利用近震S波分裂得到的中上地壳各向异性特征[12];(b)Pms震相得到的下地壳各向异性特征(本研究结果);(c)SKS波分裂得到的上地幔各向异性特征[12,16];(d)不同深度范围各向异性快波偏振方向对比. Fig. 7 The anisotropy at different depths beneath the Yunnan region Black bars denote directions of fast wave under the stations, while white bars denote those interpolated.The color scales correspond to amounts of delay times.(a) The middle-upper crustal anisotropy inferred from local S-wave data[12]; (b) The lower crustalanisotropy inferred from Pms (the present study); (c) The upper mantle anisotropy inferred from SKS wave[12, 16]; (d) Comparison of fast polarization directions at different depths. |
由于保山地块和思茅地块均具有获得不同各向异性的地震台站分布,因而这两个地块内插后的S波各向异性、Pms各向异性和SKS各向异性快波方向相对较为可靠,因此在本研究中主要以这两个块体为例来讨论不同圈层的耦合关系.在这两个地块内,近震S波各向异性快波方向主要表现为由24°N以北的近NW向逐渐转变为24°N以南的近EW向(图 7a),Pms震相的下地壳各向异性整体上呈现为近NS向(图 7b),而SKS震相的上地幔各向异性整体上表现为近EW向(图 7c).将不同圈层快波方向叠加在同一底图上,我们会更清楚了解其差异性(图 7d).不同震相获得快波方向上的这些差异性,不仅暗示出研究区地壳上地幔存在解耦现象,而且上下地壳之间可能也存在解耦现象,这些结果有意义地改进了前人认为仅存在壳幔解耦现象[16, 40]或壳幔解耦可能发生上地幔一定深度范围内[15]的认识.
4.3 深大断裂对各向异性的影响前人曾对大型断裂带附近地壳各向异性做过一些研究,结果表明引起大型断裂带附近介质各向异性的主要原因有两种[41-44]:一是大型走滑深大断裂在运动过程中在断层面上会产生大量定向排列的裂隙,沿着裂缝方向波传播速度较快,垂直于裂缝方向波传播速度较慢,从而造成地壳各向异性;二是在构造应力场的作用下,裂隙沿某一方向发生定向排列,形成应力诱导各向异性,沿最大主压应力方向波传播速度较快.接收函数分析结果表明,红河断裂带为超壳断裂[34, 36, 45].在本研究中,多数地震台站的地壳各向异性快波偏振方向与断裂带的构造走向相近(图 6),说明研究区内各向异性尽管受下地壳流影响较大,与徐震等[3]的研究结果认为红河断裂带附近下地壳各向异性主要是由物质南东向侧向挤出所引起相一致,但还可能受断裂带走滑运动形成的变形所影响.然而,在红河断裂带和澜沧江断裂带走向变化明显的YNL04和YNL12台站下方地壳各向异性快波方向与断裂带的走向近垂直(图 6),表明这些地区构造应力场作用对下地壳形变起着主导作用.
4.4 火山区地壳变形方式腾冲火山自上新世至全新世时期马鞍山一直伴随着岩浆活动[46],是中国大陆最年轻的活火山之一.Wang等[21]和Wang & Huangfu[4]利用近震到时、人工地震测深和接收函数资料结果均展示出腾冲火山下方地壳深度范围内存在明显低波速异常. Lei等[5]利用云南地区地震台站记录到的近震和远震到时资料,获得了云南地区深部成像结果,发现腾冲火山下方存在着深至400 km的明显低波速异常.2011年3月10日云南盈江5.8级地震的发生可能与腾冲火山下方的深部流体作用于大盈江断裂带密切相关[47].接收函数研究结果显示出腾冲火山下方泊松比较大、地壳相对周边明显增厚[34, 36].这些结果均说明,腾冲火山下方可能存在着地幔热物质上涌,与印度板块东向深俯冲至地幔转换带并滞留脱水等动力学过程[5, 48]密切相关.图 6显示出Pms震相各向异性快波方向近似以火山为中心向四周发散,可能暗示出上地幔热物质上涌在到达地壳后由于受上地壳介质的阻挠后向四周发散的原因.另外,以火山中心为界地震台站的各向异性强度显示出明显的北强南弱分界线,可能说明青藏高原东缘下地壳流对腾冲火山热物质上涌在下地壳的变形造成了一定影响.
5 结论本文使用中国地震局地壳应力研究所2010-2011年期间在云南地区布设的21个野外流动地震台站资料和切向能量最小化方法,获得了20个台站下方地壳各向异性结果.结果显示,研究区内各向异性快慢波延迟时间可达0.40 s左右,各向异性快波方向变化明显,且与构造块体密切相关.扬子地台与思茅地块除了在红河断裂和澜沧江断裂走向变化明显外,其各向异性与大型断裂带走向相一致,可能说明断层对下地壳流具有明显控制作用,而腾冲地块各向异性快波方向呈现出以火山为中心向四周发散,说明地幔热物质上涌在到达下地壳后受上地壳阻挡影响向四周扩散.
致谢中国地震局地球物理勘探中心和云南省地震局对野外流动地震观测给予了大力支持和帮助,黎源参加了野外流动地震观测工作,在此表示由衷的感谢.
| [1] | 钟大赉. 滇川西部古特提斯造山带. 北京: 科学出版社, 1998 . Zhong D L. Yunnan Western Parts of Paleotethysides (in Chinese). Beijing: Science Press, 1998 . |
| [2] | 胡家富, 胡毅力, 夏静瑜, 等. 缅甸弧及邻区的壳幔S波速度结构与动力学过程. 地球物理学报 , 2008, 51(1): 140–148. Hu J F, Hu Y L, Xia J Y, et al. Crust-mantle velocity structure of S wave and dynamic process beneath Burma Arc and its adjacent regions. Chinese J. Geophys (in Chinese) , 2008, 51(1): 140-148. |
| [3] | 徐震, 徐鸣洁, 王良书, 等. 用接收函数Ps转换波研究地壳各向异性:以哀牢山-红河断裂带为例. 地球物理学报 , 2006, 49(2): 438–448. Xu Z, Xu M J, Wang L S, et al. A study on crustal anisotropy using P to S converted phase of the receiver function: Application to Ailaoshan-Red River fault zone. Chinese J. Geophys (in Chinese) , 2006, 49(2): 438-448. |
| [4] | Wang C Y, Huangfu G. Crustal structure in Tengchong volcano-geothermal area, western Yunnan, China. Tectonophysics , 2004, 380(1-2): 69-87. DOI:10.1016/j.tecto.2003.12.001 |
| [5] | Lei J S, Zhao D P, Su Y J. Insight into the origin of the Tengchong intraplate volcano and seismotectonic in southwest China from local and teleseismic data. J. Geophys. Res. , 2009, 113: B05302. DOI:10.1029/2008JB005881 |
| [6] | Wang Q, Zhang P Z, Freymueller J F, et al. Present-day crustal deformation in China constrained by global positioning system measurements. Science , 2001, 294(5542): 574-577. DOI:10.1126/science.1063647 |
| [7] | Zhang P Z, Shen Z K, Wang M, et al. Continuous deformation of the Tibetan Plateau from global positioning system data. Geology , 2004, 32(9): 809-812. DOI:10.1130/G20554.1 |
| [8] | Gan W J, Zhang P Z, Shen Z K, et al. Present-day crustal motion within the Tibetan Plateau inferred from GPS measurements. J. Geophys. Res. , 2007, 112: B08416. DOI:10.1029/2005JB004120 |
| [9] | Savage M K. Seismic anisotropy and mantle deformation: what have we learned from shear wave splitting. Rev. Geophys. , 1999, 37(1): 65-106. DOI:10.1029/98RG02075 |
| [10] | Long M D, Becker T W. Mantle dynamics and seismic anisotropy. Earth Planet. Sci. Lett. , 2010, 297(3-4): 341-354. DOI:10.1016/j.epsl.2010.06.036 |
| [11] | Gao Y, Shi Y, Wu J, et al. Shear-wave splitting in the crust: Regional compressive stress from polarizations of fast shear-waves. Earthq. Sci. , 2012, 25(1): 35-45. DOI:10.1007/s11589-012-0829-3 |
| [12] | Shi Y T, Gao Y, Su Y, et al. Shear-wave splitting beneath Yun'nan area of southwest China. Earthq. Sci. , 2012, 25(1): 25-34. DOI:10.1007/s11589-012-0828-4 |
| [13] | 崔忠雄, 裴顺平. 青藏高原东构造结及周边地区上地幔顶部Pn速度结构和各向异性研究. 地球物理学报 , 2009, 52(9): 2245–2254. Cui Z X, Pei S P. Study on Pn velocity and anisotropy in the uppermost mantle of the Eastern Himalayan Syntaxis and surrounding regions. Chinese J. Geophys (in Chinese) , 2009, 52(9): 2245-2254. |
| [14] | 李飞, 周仕勇, 苏有锦, 等. 川滇及邻区Pn波速度结构和各向异性研究. 地球物理学报 , 2011, 54(1): 44–54. Li F, Zhou S Y, Su Y J, et al. Study on Pn wave velocity structure and anisotropy in the Sichuan-Yun'nan and its adjacent areas. Chinese J. Geophys (in Chinese) , 2011, 54(1): 44-54. |
| [15] | 黎源, 雷建设. 青藏高原东缘上地幔顶部Pn波速度结构及各向异性研究. 地球物理学报 , 2012, 55(11): 3615–3624. Li Y, Lei J S. Velocity and anisotropy structure of the uppermost mantle under the eastern Tibetan plateau inferred from Pn tomography. Chinese J. Geophys (in Chinese) , 2012, 55(11): 3615-3624. |
| [16] | Wang C, Flesch L, Silver P, et al. Evidence for mechanically coupled lithosphere in central Asia and resulting implications. Geology , 2008, 36(5): 363-365. DOI:10.1130/G24450A.1 |
| [17] | Tian X B, Zhang J L, Si S K, et al. SKS splitting measurements with horizontal component misalignment. Geophys. J. Int. , 2011, 185(1): 329-340. DOI:10.1111/gji.2011.185.issue-1 |
| [18] | 张建利, 田小波, 张洪双, 等. 贝加尔裂谷区地壳上地幔复杂的各向异性及其动力学意义. 地球物理学报 , 2012, 55(8): 2523–2538. Zhang J L, Tian X B, Zhang H S, et al. The crust and upper mantle anisotropy in Baikal Rift Zone and its dynamic significance. Chinese J. Geophys (in Chinese) , 2012, 55(8): 2523-2538. |
| [19] | Royden L H, Burchfiel B C, King R W, et al. Surface deformation and lower crustal flow in eastern Tibet. Science , 1997, 276(5313): 788-790. DOI:10.1126/science.276.5313.788 |
| [20] | Bai D H, Unsworth M J, Meju M A, et al. Crustal deformation of the eastern Tibetan plateau revealed by magnetotelluric imaging. Nature Geosci. , 2010, 3(5): 359-362. |
| [21] | Wang C Y, Chan W W, Mooney W D. Three-dimensional velocity structure of crust and upper mantle in southwestern China and its tectonic implications. J. Geophys. Res. , 2003, 108: B92442. DOI:10.1029/2002JB001973 |
| [22] | Lei J S, Zhao D P. Structural heterogeneity of the Longmenshan fault zone and the mechanism of the 2008 Wenchuan earthquake (Ms8). Geochemistry Geophysics Geosystems , 2009, 10: Q10010. |
| [23] | Chen Y, Zhang Z J, Sun C Q, et al. Crustal anisotropy from Moho converted Ps wave splitting analysis and geodynamic implications beneath the eastern margin of Tibet and surrounding regions. Gondwana Research , 2013, 24(3-4): 946-957. DOI:10.1016/j.gr.2012.04.003 |
| [24] | Lei J S, Zhang G W, Xie F R, et al. Relocation of the 10 March 2011 Yingjiang, China, earthquake sequence and its tectonic implications. Earthq. Sci. , 2012, 25(1): 103-110. DOI:10.1007/s11589-012-0836-4 |
| [25] | McNamara D E, Owens T J. Azimuthal shear wave velocity anisotropy in the Basin and Range Province using Moho Ps converted phases. J. Geophys. Res. , 1993, 98(B7): 12003-12017. DOI:10.1029/93JB00711 |
| [26] | 孙长青, 陈赟, 高尔根. 青藏高原东缘强烈盆山相互作用区的地壳各向异性特征及其动力学意义探讨. 地球物理学报 , 2011, 54(5): 1205–1214. Sun C Q, Chen Y, Gao E G. The crustal anisotropy and its geodynamical significance of the strong basin-range interaction zone beneath the east margin of Qinghai-Tibet plateau. Chinese J. Geophys (in Chinese) , 2011, 54(5): 1205-1214. |
| [27] | Ligorría J P, Ammon C J. Iterative deconvolution and receiver-function estimation. Seismol. Soc. Am. , 1999, 89(5): 1395-1400. |
| [28] | Silver P G, Chan W W. Shear wave splitting and sub-continental mantle deformation. J. Geophys. Res. , 1991, 96(B10): 16429-16454. DOI:10.1029/91JB00899 |
| [29] | Restivl A, Helffrich G. Teleseismic shear wave splitting measurements in noisy environments. Geophys. J. Int. , 1999, 137(3): 821-830. DOI:10.1046/j.1365-246x.1999.00845.x |
| [30] | Crampin S, Atkinson B K. Microcracks in the Earth's crust. First Break , 1985, 3(3): 16-20. |
| [31] | 许忠淮, 汪素云, 黄雨蕊, 等. 由多个小震推断的青甘和川滇地区地壳应力场的方向特征. 地球物理学报 , 1987, 30(5): 476–486. Xu Z H, Wang S Y, Huang Y R, et al. Directions of mean stress axes in southwestern China deduced from microearthquake data. Chinese J. Geophys (in Chinese) , 1987, 30(5): 476-486. |
| [32] | Silver P G, Chan W W. Implications for continental structure and evolution from seismic anisotropy. Nature , 1988, 335(6185): 34-39. DOI:10.1038/335034a0 |
| [33] | Zhang X, Wang Y H. Crustal and upper mantle velocity structure in Yunnan, Southwest China. Tectonophysics , 2009, 471(3-4): 171-185. DOI:10.1016/j.tecto.2009.02.009 |
| [34] | 李永华, 吴庆举, 田小波, 等. 用接收函数方法研究云南及其邻区地壳上地幔结构. 地球物理学报 , 2009, 52(1): 67–80. Li Y H, Wu Q J, Tian X B, et al. Crustal structure in the Yunnan region determined by modeling receiver functions. Chinese J. Geophys (in Chinese) , 2009, 52(1): 67-80. |
| [35] | 张洪双, 田小波, 滕吉文. 接收函数方法估计Moho倾斜地区的地壳速度比. 地球物理学报 , 2009, 52(5): 1243–1252. Zhang H S, Tian X B, Teng J W. Estimation of crustal Vp/Vs with dipping Moho from receiver functions. Chinese J. Geophys (in Chinese) , 2009, 52(5): 1243-1252. |
| [36] | 查小惠, 雷建设. 云南地区地壳厚度和泊松比研究. 中国科学D辑:地球科学 , 2013, 56(4): 693–702. Zha X H, Lei J S. Crustal thickness and Poisson's ratio beneath the Yunnan region. Science China: Earth Sciences (in Chinese) , 2013, 56(4): 693-702. DOI:10.1007/s11430-013-4583-8 |
| [37] | 吴建平, 明跃红, 王椿镛. 川滇地区速度结构的区域地震波形反演研究. 地球物理学报 , 2006, 49(5): 1369–1376. Wu J P, Ming Y H, Wang C Y. Regional waveform inversion for crustal and upper mantle velocity structure below Chuandian region. Chinese J. Geophys (in Chinese) , 2006, 49(5): 1369-1376. |
| [38] | 张中杰, 白志明, 王椿镛, 等. 三江地区地壳结构及其动力学意义:云南遮放-宾川宽角地震资料的启示. 中国科学(D辑) , 2005, 35(4): 314–319. Zhang Z J, Bai Z M, Wang C Y, et al. The crustal structure under Sanjiang and its dynamic implications: Revealed by seismic reflection/refraction profile between Zhefang and Binchuan, Yunnan. Science in China (Ser. D) (in Chinese) , 2005, 35(4): 314-319. |
| [39] | 张中杰, 白志明, 王椿镛, 等. 冈瓦纳型和扬子型地块地壳结构:以滇西孟连-马龙宽角反射剖面为例. 中国科学(D辑) , 2005, 35(5): 387–392. Zhang Z J, Bai Z M, Wang C Y, et al. Crustal structure of Gondwana and Yangtze typed blocks: An example by wide-angle seismic profile from Menglian to Malong in Western Yun'nan. Science in China (Ser. D) (in Chinese) , 2005, 35(5): 387-392. |
| [40] | Flesch L M, Holt W E, Silver P G, et al. Constraining the extent of crust-mantle coupling in central Asia using GPS, geologic, and shear-wave splitting data. Earth Planet. Sci. Lett. , 2005, 238(1): 248-268. |
| [41] | Boness N L, Zoback M D. Stress-induced seismic velocity anisotropy and physical properties in the SAFOD Pilot Hole in Parkfield, CA. eophys. Res. Lett. , 2004, 31: L15S17. DOI:10.1029/2003GL019020 |
| [42] | Boness N L, Zoback M D. A multiscale study of the mechanisms controlling shear velocity anisotropy in the San Andreas Fault Observatory at depth. Geophysics , 2006, 71(5): F131-F146. DOI:10.1190/1.2231107 |
| [43] | Zhang H, Liu Y, Thurber C, et al. Three-dimensional shear-wave splitting tomography in the Parkfield, California, region. Geophys. Res. Lett. , 2007, 34: L24308. DOI:10.1029/2007GL031951 |
| [44] | Liu Y, Zhang H, Thurber C, et al. Shear wave anisotropy in the crust around the San Andreas fault near Parkfield: spatial and temporal analysis. Geophys. J. Int. , 2008, 172(3): 957-970. DOI:10.1111/gji.2008.issue-3 |
| [45] | 徐鸣洁, 王良书, 刘建华, 等. 利用接收函数研究哀牢山-红河断裂带地壳上地幔特征. 中国科学D辑:地球科学 , 2005, 49(10): 1043–1052. Xu M J, Wang L S, Liu J H, et al. Crust and uppermost mantle structure of the Ailaoshan-Red River fault from receiver function analysis. Science in China (Series D): Earth Sciences (in Chinese) , 2005, 49(10): 1043-1052. |
| [46] | 李大明, 李齐, 陈文寄. 腾冲火山区上新世以来的火山活动. 岩石学报 , 2000, 16(3): 362–370. Li D M, Li Q, Chen W J. Volcanic activities in the Tengchong volcano area since Pliocene. Acta Petrologica Sinica (in Chinese) , 2000, 16(3): 362-370. |
| [47] | Lei J S, Xie F R, Mishra O P, et al. The 2011 Yingjiang, China, earthquake: A volcano-related fluid-driven earthquake? Bull. Seismol. Soc. Am. , 2012, 102(1): 417-425. DOI:10.1785/0120110143 |
| [48] | Lei J S, Xie F R, Fan Q C, et al. Seismic imaging of the deep structure under the Chinese volcanoes: An overview. Earth Planet. Inter. , 2013, 224: 104-123. DOI:10.1016/j.pepi.2013.08.008 |