Xu L S, Yan C, Zhang X, et al.
A method for determination of earthquake hypocentroid:Time-reversal imaging technique—An examination based on people-made earthquakes. Chinese J. Geophys. (in Chinese), 2013, 56(12): 4009-4027,
doi: 10.6038/cjg20131207.
A method for determination of earthquake hypocentroid:Time-reversal imaging technique—An examination based on people-made earthquakes
XU Li-Sheng, YAN Chuan, ZHANG Xu, LI Chun-Lai
Institute of Geophysics, China Earthquake Administration, Beijing 100081, China
Abstract: Origin times and locations of people-made earthquakes are known, so examining an earthquake-location technology using seismic recordings from the people-made earthquakes is one of the convincing ways. In order to examine the TRIT (Time Reversal Imaging Technique), we collect seismic recordings from 10 people-made earthquakes, 5 air-guns and 5 chemical explosions. The seismogragh network for the air-guns is smaller, about 20 km across and the one for the chemical explosions is larger, about 200 km across. At first, two better velocity models were chosen out from the models available in literatures by comparing the measured values with the true ones. Then, the best one was decided further, while the final measured values for the 10 events were determined based on the two models, by comparing the measured values with the true ones, as well as the uncertainties of the measured values. The results show that, with the best velocity model, the epicenter biases for both the air-guns and chemical explosions are around 500 m; the depth biases of the air-guns are around 100 m while those of the chemical ones are around 200 m; the origin time biases of the chemical ones are around 0.06 s, but those of the air-guns are larger, reaching about 0.4 s, which might be explained by the lower velocity of local water region. As a conclusion, origin times and hypocenters, including even focal depths, are able to be determined at reasonable accuracy and precision by the TRIT..
图 2
川滇地区的P波速度模型
M1和M2来自朱碚定等[12],M3来自熊绍柏等[13-14],M4来自王椿镛等[15]和Wang等[16],M5来自白志明和王椿镛[17],M6来自IASPEI91模型,M7来自CRUST2.0(具体数据见附录).
Fig. 2
P-velocity models of the Chuan-Dian area
M1 and M2 are from Zhu et al.[12], M3, from Xiong et al.[13-14], M4, from Wang et al.[15] and Wang et al.[16], M5, from Bai and Wang[17], M6, from IASPEI91, M7, from CRUST2.0 (see appendix for numerical values).
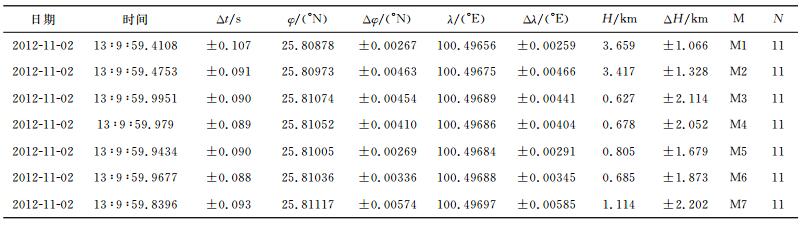
表 3
利用相同的观测资料但不同的速度模型确定的事件Q1的震源参数及其不确定性
Table 3
Hypocentroid parameters of the Q1 and their uncertainties determined using the same data but various models
表 3
利用相同的观测资料但不同的速度模型确定的事件Q1的震源参数及其不确定性
Table 3
Hypocentroid parameters of the Q1 and their uncertainties determined using the same data but various models
表 4(Table 4)
表 4
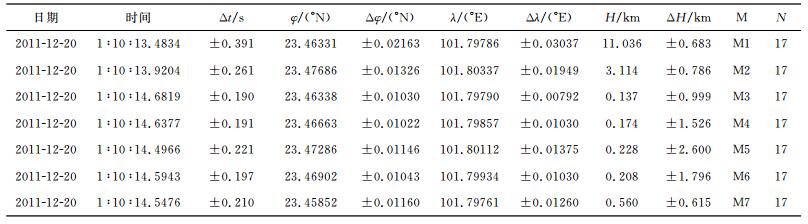
利用相同的观测资料但不同的速度模型确定的事件Q2的震源参数及其不确定性
Table 4
Hypocentroid parameters of the Q2 and their uncertainties determined using the same data but various models
表 4
利用相同的观测资料但不同的速度模型确定的事件Q2的震源参数及其不确定性
Table 4
Hypocentroid parameters of the Q2 and their uncertainties determined using the same data but various models
表 5(Table 5)
表 5
利用相同的观测资料但不同的速度模型确定的事件Q3的震源参数及其不确定性
Table 5
Hypocentroid parameters of the Q3 and their uncertainties determined using the same data but various models
表 5
利用相同的观测资料但不同的速度模型确定的事件Q3的震源参数及其不确定性
Table 5
Hypocentroid parameters of the Q3 and their uncertainties determined using the same data but various models
表 6(Table 6)
表 6
利用相同的观测资料但不同的速度模型确定的事件Q4的震源参数及其不确定性
Table 6
Hypocentroid parameters of the Q4 and their uncertainties determined using the same data but various models
表 6
利用相同的观测资料但不同的速度模型确定的事件Q4的震源参数及其不确定性
Table 6
Hypocentroid parameters of the Q4 and their uncertainties determined using the same data but various models
表 7(Table 7)
表 7
利用相同的观测资料但不同的速度模型确定的事件Q5的震源参数及其不确定性
Table 7
Hypocentroid parameters of the Q5 and their uncertainties determined using the same data but various models
表 7
利用相同的观测资料但不同的速度模型确定的事件Q5的震源参数及其不确定性
Table 7
Hypocentroid parameters of the Q5 and their uncertainties determined using the same data but various models
表 8(Table 8)
表 8
利用相同的观测资料但不同的速度模型确定的事件B1的震源参数及其不确定性
Table 8
Hypocentroid parameters of the B1 and their uncertainties determined using the same data but various models
表 8
利用相同的观测资料但不同的速度模型确定的事件B1的震源参数及其不确定性
Table 8
Hypocentroid parameters of the B1 and their uncertainties determined using the same data but various models
表 9(Table 9)
表 9
利用相同的观测资料但不同的速度模型确定的事件B2的震源参数及其不确定性
Table 9
Hypocentroid parameters of the B2 and their uncertainties determined using the same data but various models
表 9
利用相同的观测资料但不同的速度模型确定的事件B2的震源参数及其不确定性
Table 9
Hypocentroid parameters of the B2 and their uncertainties determined using the same data but various models
表 10(Table 10)
表 10
利用相同的观测资料但不同的速度模型确定的事件B3的震源参数及其不确定性
Table 10
Hypocentroid parameters of the B3 and their uncertainties determined using the same data but various models
表 10
利用相同的观测资料但不同的速度模型确定的事件B3的震源参数及其不确定性
Table 10
Hypocentroid parameters of the B3 and their uncertainties determined using the same data but various models
表 11(Table 11)
表 11
利用相同的观测资料但不同的速度模型确定的事件B4的震源参数及其不确定性
Table 11
Hypocentroid parameters of the B4 and their uncertainties determined using the same data but various models
表 11
利用相同的观测资料但不同的速度模型确定的事件B4的震源参数及其不确定性
Table 11
Hypocentroid parameters of the B4 and their uncertainties determined using the same data but various models
表 12(Table 12)
表 12
利用相同的观测资料但不同的速度模型确定的事件B5的震源参数及其不确定性
Table 12
Hypocentroid parameters of the B5 and their uncertainties determined using the same data but various models
表 12
利用相同的观测资料但不同的速度模型确定的事件B5的震源参数及其不确定性
Table 12
Hypocentroid parameters of the B5 and their uncertainties determined using the same data but various models
图 3
Fig. 3
图 3
基于7种不同的速度模型测定的5次气枪震源位置和激发时间与真实值的比较
(a), (b), (c), (d)和(e)分别对应于事件Q1,Q2,Q3,Q4和Q5.在每个子图中,左边为震源位置的偏差,右边为激发时间的偏差.
Fig. 3
Comparison of the true values with the measured ones of the hypocentroid locations and origin times of the 5 air-guns based on the 7 various velocity models
(a), (b), (c), (d) and (e) corresponds to Q1, Q2, Q3, Q4 and Q5, respectively. In each subplot, the lettshows the biases of hypocentroid locations, and the right, the biases of origin times.
图 4
Fig. 4
图 4
基于7种不同的速度模型测定的5次爆破震源位置和激发时间与真实值的比较
(a),(b),(c),(d)和(e)分别对应于事件B1,B2,B3,B4和B5.其他说明同图 3.
Fig. 4
Comparison of the true values with the measured ones of the hypocentroid locations and origin times of the 5 chemical explosions based on the 7 various velocity models
(a), (b), (c), (d) and (e) corresponds to B1, B2, B3, B4 and B5, respectively. The others are the same as in Fig. 3.
图 5
Fig. 5
图 5
基于7种不同的速度模型测定的5次气枪和5次爆破的震源位置和激发时间相对于真实值的偏差的平均值的比较
(a)和(b)分别对应于气枪事件和爆破事件.其他说明同图 3.
Fig. 5
Comparison of the average bias of the hypocentroid locations and origin times of the 5 air-guns and the 5 chemical explosions based on the 7 various velocity models
(a) is for the air-guns and (b), for the chemical explosions. The others are the same as in Fig. 3.
表 13
基于M3模型确定的5次气枪的激发时间和位置及其不确定性
Table 13
Hypocentroid parameters of the 5 air-guns and their uncertainties determined based on the model
表 13
基于M3模型确定的5次气枪的激发时间和位置及其不确定性
Table 13
Hypocentroid parameters of the 5 air-guns and their uncertainties determined based on the model
表 14(Table 14)
表 14
基于M3模型确定的5次化学爆破的激发时间和位置及其不确定性
Table 14
Hypocentroid parameters of the 5 chemical explosions and their uncertainties determined based on the model M3
表 14
基于M3模型确定的5次化学爆破的激发时间和位置及其不确定性
Table 14
Hypocentroid parameters of the 5 chemical explosions and their uncertainties determined based on the model M3
图 6
Fig. 6
图 6
基于M3模型测定的5次气枪(a)和5次爆破(b)的激发时间和位置与真实值的比较
在每个子图中,从左向右依次为激发时刻的差异(TC)、震中位置的差异(EC)、震源深度的差异(DC)和震源位置的差异(SC).
Fig. 6
Comparison of the true values with the measured ones determined based on the model M3
(a) is for 5 air-guns and (b), for 5 chemical explosions. In each subplot, the changes of the origin times (TC), epicenters (EC), depths (DC) and source locations (SC) are shown from left to right, respectively.
表 15
基于M4模型确定的5次气枪的激发时间和位置及其不确定性
Table 15
Hypocentroid parameters of the 5 air-guns and their uncertainties determined based on the model M4
表 15
基于M4模型确定的5次气枪的激发时间和位置及其不确定性
Table 15
Hypocentroid parameters of the 5 air-guns and their uncertainties determined based on the model M4
表 16(Table 16)
表 16
基于M4模型确定的5次化学爆破的激发时间和位置及其不确定性
Table 16
Hypocentroid parameters of the 5 chemical explosions and their uncertainties determined based on the model M4
表 16
基于M4模型确定的5次化学爆破的激发时间和位置及其不确定性
Table 16
Hypocentroid parameters of the 5 chemical explosions and their uncertainties determined based on the model M4
图 7
Fig. 7
图 7
基于M4模型测定的5次气枪(a)和5次爆破(b)的激发时间和位置与真实值的比较.其他说明同图 6.
Fig. 7
Comparison of the true values with the measured ones determined based on the model M3. (a) is for 5 air-guns and (b), for 5 chemical explosions. The others are the same as in Fig. 6.
根据朱碚定等[12]建立的具有低速夹层的速度模型[M1]
Velocity model with a velocity-low layer from Zhu et al. [12][M1]
根据朱碚定等[12]建立的无低速夹层的速度模型[M2]
Velocity model without a velocity-low layer from Zhu et al.[12] [M2]
根据熊绍柏等[13-14]建立的速度模型[M3]
Velocity model from Xiong et al.[13-14] [M3]
5次气枪定位使用的台站分布、定位结果及其模糊度
Stations, hypocenters and their ambiguities of the 5 air-guns
(a)-(e)依次对应于表 15中的5次事件.在每个子图中,左上为震中与台站分布,右上为震中及其模糊度在水平面内的投影,左下为震源及其模糊度在纬度-深度剖面上的投影,右下为震源及其模糊度在经度-深度剖面上的投影. (a) -(e) correspond to the 5 events listed in Table 15, respectively. In each subplot, the upper-lett shows epicenter and stations, the upper-right, hypocenter and its ambiguity on ground surface, the lower-left, hypocenter and its ambiguity on cross-section of latitude and depth, and hypocenter and ts ambiguity on cross-section of longitude and depth.
根据王椿镛等[15-16]建立的速度模型[M4]
Velocity model from Wang et al.[15-16] [M4]
根据白志明和王椿镛[17]建立的速度模型[M5]
Velocitymodel from Bai and Wang [17][M5]
IASPEI91速度模型[M6]
Velocity model of the IASPEI91[M6]
CRUST2.0速度模型[M7]
Velocity model of the CURST2.0[M7]
5次爆破定位使用的台站分布、震源位置及其模糊度
Stations, hypocenters and their ambiguities of the 5 chemical explosions
(a)-(e)依次对应于表 16中的5次事件.其他说明同图 8. (a)-(e) correspond to the 5 events listed in Table 16, respectively. The others are the same as in Fig. 8.
Rowlett H, Forsyth D W.
Recent faulting and microearthquakes at the intersection of the Vema Fracture Zone and the Mid-Atlantic Ridge. J. Geophys. Res. , 1984, 89(B7): 6079-6094.
DOI:10.1029/JB089iB07p06079
朱碚定, 李幼铭, 张立敏, 等.
川南、滇北地震台网区域壳幔介质分层结构的初步研究. 地球物理学报 , 1986, 29(3): 245–254.
Zhu P D, Li Y M, Zhang L M, et al.
On the study of the crust and upper mantle structure beneath the seismic telemetry network in south Sichuan and north Yunnan provinces. Acta Geophysica Sinica (in Chinese) , 1986, 29(3): 245-254.
熊绍柏, 膝吉文, 尹周勋, 等.
攀西构造带南部地壳与上地慢结构的爆炸地震研究. 地球物理学报 , 1986, 29(3): 235–244.
Xiong S B, Teng J W, Yin Z X, et al.
Explosion seismological study of the structure of the crust and upper mantle at southern part of the Panxi tectonic belt. Acta Geophysica Sinica (in Chinese) , 1986, 29(3): 235-244.
熊绍柏, 郑晔, 尹周勋, 等.
丽江-攀枝花-者海地带二维地壳结构及其构造意义. 地球物理学报 , 1993, 36(4): 434–444.
Xiong S B, Zheng Y, Yin Z X, et al.
The 2-D structure and it's tectonic implications of the crust in the Lijiang-Panzhihua-Zhehai region. Acta Geophysica Sinica (in Chinese) , 1993, 36(4): 434-444.
王椿镛, MooneyW D, 王溪莉, 等.
川滇地区地壳上地幔三维速度结构研究. 地震学报 , 2002, 24(1): 1–16.
Wang C Y, Mooney W D, Wang X L, et al.
Study on 3-D velocity structure of crust and upper mantle in sichuan-yunnan region, China. Acta Seismologica Sinica (in Chinese) , 2002, 24(1): 1-16.
Wang C Y, Chan W W, Mooney W D.
Three-dimensional velocity structure of crust and upper mantle in southwestern China and its tectonic implications. J. Geophys. Res. , 2003, 108(B9).
DOI:10.1029/2002JB001973
白志明, 王椿镛.
云南遮放-宾川和孟连-马龙宽角地震剖面的层析成像研究. 地球物理学报 , 2004, 47(2): 257–267.
Bai Z M, Wang C Y.
Tomography research of the Zhefang-Binchuan and Menglian-Malong wide-angle seismic profiles in Yunnan province. Chinese J. Geophys. (in Chinese) , 2004, 47(2): 257-267.
 2013, Vol. 56