 2012, Vol. 55


2. 中国地质科学院地质研究所,北京 100037
2. Institute of Geology, Chinese Academy of Geological Sciences, Beijing 100037, China
大陆动力学已经成为当今固体地球物理各领域研究的主导方向.大陆动力学涉及问题非常广泛,但核心问题是大陆变形及动力学.地震各向异性被普遍认为是理解地球动力学过程的有效工具[1],因此,通过研究地震各向异性有助于了解地球介质的应变、应力状态及地球的演化过程.
地球介质各向异性的成因比较复杂,岩石组分和构造环境不同,地震各向异性成因也不尽相同.地震波各向异性具有多种成因,它可能与岩石中的各向异性结构背景有关,也可能与地球中矿物的固有各向异性有关.这些因素总体而言可分为两类,即形状优势排列(SPO)和晶格优势排列(LPO).地壳各向异性形成的主要原因是SPO,而上地幔各向异性形成的主要原因是LPO[2].岩石实验和数值模拟研究表明,简单的剪切应力作用下,橄榄石a轴趋于主张应力方向,中度变形的橄榄石聚合体趋于在最大的形变方向上排列,可以产生2% ~6% 的各向异性[3-5].在强大的应力作用下,岩石中晶体颗粒发生塑性变化,在垂直于应力方向上伸长,也会使岩石表现出各向异性[6].当大洋中脊、岛弧、俯冲带、火山带等高活动性地区地幔在高温下流动时,橄榄石晶体定向排列,长轴沿流动方向展布,在局部范围内会形成较强的各向异性.由于LPO 与岩石形变有关,因此可以根据上地幔各向异性结构推测上地幔流动图像[3, 7].尽管在岩石含水[8-9]或其它各向异性矿物(如长石)的情况下,各向异性方向与应力或应变的关系会变得非常复杂[10],但地震各向异性仍然可以作为地幔流动的指示器[11-15].
上地幔地震各向异性研究方法有很多种[16],其中最常用的方法是SKS 波偏振分析和面波各向异性.SKS偏振分析方法是研究上地幔各向异性的主要方法[17-20],在世界各个地区都进行过SKS波偏振分析研究[21].SKS波偏振分析方法的主要特点是横向分辨率较高,受介质的非均匀性的影响较小.其缺点是不能确定具体的深度和各向异性的垂直分量[22],当存在多层各向异性时,观测到的各向异性方向趋向于浅层介质的方向,从而掩盖了深部的各向异性特征[21-23].另外,SKS 波偏振分析方法对于地震的震中距和记录质量要求较为严格,需要较长时间观测才能获得充足的数据.面波分析的结果可以提供~1/3波长深度范围内的径向各向异性[24]及方位各向异性[25-29].面波各向异性分析方法具有较好的垂向分辨率,但横向分辨率较差(在密集台阵情况下约100km).上述两种方法都只能得到方位各向异性而忽略各向异性的倾角.P 波走时方法是根据区域地震或远震的走时残差随方位和入射角的分布确定快波轴的方向,进而确定各向异性的对称轴方向.当P波走时数据的入射角范围覆盖较全时还可以确定对称轴的倾角.BabuŠka等[30]最早通过校正地球的椭率、台站高程、沉积层厚度以及Moho面深度来计算台站的相对走时残差,并根据相对走时残差的分布特征确定P 波快轴的方位.Martynov等[31]、Plomerová等[32-33]和Środa[34]也采用了类似的方法.利用远震P 波走时确定介质各向异性主要有以下几个优点:1)体波数据易于获取;2)与波形信息相比,体波走时数据精度和信噪比较高;3)体波射线在地壳上地幔分布较为均匀.但其缺点是难以与非均匀效应分离.相对于SKS 波偏振分析,体波走时方法基于不同的数据集,能提供独立的地震各向异性观测证据,对于认识地球的结构及动力学过程都具有非常重要的意义.
中国大陆位于欧亚板块的东部,是研究大陆构造变形的典型区域.晚新生代以来,中国大陆经历了多旋回的典型构造事件,包括西部的青藏高原和天山的隆升及东部地区的盆地扩张及火山活动[35].关于中国大陆构造变形的动力学特征,一般认为是由于太平洋板块俯冲引起的大陆裂谷、克拉通裂解[36],以及由于印度板块向中国大陆俯冲引起的中国大陆内块体向东南挤出[37].研究太平洋和印度板块的俯冲对中国大陆构造变形还需要上地幔形变的地震学证据.已有很多学者利用Pn 波走时[38-39],SKS波偏振[40-41]以及面波频散[42-44]等方法研究了中国大陆上地幔各向异性.这些各向异性研究一般基于HTI或VTI假设[24],但真实地球介质在不同深度上存在不同类型的各向异性,并且对称轴为任意方向.Savage[45]指出在假定对称轴方向的基础上获得的各向异性参数很可能与实际情况不符.本文在弱各向异性假设基础上,根据Backus[46]的qP 波速度扰动的近似表达式和分布在中国大陆周边的213个地震台站记录到的远震P 波走时数据,反演了中国大陆上地幔P 波各向异性结构.利用远震P波走时不仅可以研究方位各向异性,同时还可以给出各向异性对称轴的倾角,避免了由于倾斜各向异性造成的误差[16].本研究根据远震P 波走时反演得到的上地幔各向异性图像可以为研究中国大陆构造演化和上地幔形变特征提供深部地球物理证据.
2 走时数据与预处理利用远震P 波走时研究上地幔各向异性要求比较全的震中距和方位角覆盖,因此本文所用的走时数据选自中国大陆周边长期稳定运行的固定地震台.这些台站包括中国地震台网(记录时间1996 年至2008 年)和国际地震数据中心(ISC)的台站(记录时间1960年至2009年).我们根据以下原则选取数据:1)台站范围为70°E—135°E,10°N—50°N;2)震中距范围在20°~100°之间;3)走时残差小于4s;4)每个台站所记录到的地震数量大于800个,地震的方位覆盖大于270°,震中距覆盖大于30°.最终选定213个台站和约680000条远震P波走时数据,其中ISC 台站的记录时间较长(约40年),数据的方位和震中距覆盖较好,而中国地震台网的记录时间较短(约12年),数据方位覆盖较差.
图 1给出了本研究所用地震台站的分布.由图 1所示,地震台站在中国大陆中东部、印度大陆和东南半岛分布较为均匀,而在西藏、塔里木及蒙古地区地震台站分布较为稀疏.

|
图 1 中国大陆及邻区板块构造及地震台站分布 红色三角表示ISC台站;绿色三角表示中国地震台网的台站;线段表示板块边界(据文献[47]). Fig. 1 Boundaries of plates and seismic stations distribution in China mainland and adjacent areas The red triangles denote ISC stations; the green triangles denote CENC stations; the solid lines denote boundaries of plates (after Ref. [47]). |
为了尽量消除地球介质的非均匀结构、地震定位误差等因素的影响,在反演前我们先对走时数据进行预处理:1)首先,根据Crust2.0地壳模型[48]校正了高程和地壳厚度的影响,并做了椭率校正;2)采用台站相对走时残差代替绝对走时残差.台站相对走时残差定义为某一个地震的走时残差减去该台站所有地震走时残差的平均值.
|
(1) |
其中,${{{\bar{R}}}_{i}}$为第i地震的台站相对走时残差,Ri为第i地震的绝对走时残差.3)为了进一步消除震源区结构的影响,我们对走时残差进行分组叠加.首先以台站为中心,在入射角为0°~60°范围和反方位角0°~360°范围内分别以10°和15°为步长将该台站记录到的地震分为144个投影区,每个区域内的地震进行分组叠加.
根据上面所述的方法,我们计算得到中国大陆及邻区内213 个地震台的台站相对走时残差的分布.作为例子,图 2a给出了9个地震台站远震相对走时残差分布,图 2b给出了这9 个台站的位置.如图 2a所示,分组叠加后的台站相对走时残差投影到极坐标下呈一定规律的分布,其反映了台站下方上地幔的各向异性性质.

|
图 2 (a)台站相对走时残差的分布;(b)台站位置 数字表示反方位角,0°表示北,顺时针方向为正;同心圆的内圈表示入射角为10°最外圈表示入射角为40°每个小图下方的英文字母为台站名称,台站的位置显示在图 2b中. Fig. 2 (a) Distribution of station relative traveltime residuals; (b) Locations of seismic stations The numbers denote back azimuth,0° denotes North direction and clockwise is positive; the tnner cycle represents 10° of incident angle,while the outer cycle represents 40° of incident angle. The string under subfigure is the station name,and the locations of stations are shown in Fig. 2b. |
各向异性介质非常复杂,理论上描述任意各向异性介质需要21个弹性参数,在现有的观测条件下很难反演如此多的参数.因此,各向异性研究大多都假定介质为弱各向异性或为某一种简单的各向异性类型(如TI介质),从而减少描述各向异性介质参数的个数.Backus[46]利用弹性张量调和展开理论,导出了弱各向异性介质中的P 波相速度扰动调和展开公式.该公式是目前大部分各向异性研究方法的基础,下面简单介绍该理论及其在本文中的应用.
3.1 P波速度扰动的近似表达式在弱各向异性条件下,弹性张量可以表示为各向同性张量与很小的扰动张量之和:

|
(2) |
这里,Cijkl为各向异性弹性张量,Cijkl0为各向同性张量,γijkl为扰动张量,且有γijkl<<cS2(cS 为S 波速度).根据扰动理论,qP波的相速度扰动可以表示为
|
(3) |
其中,ρ 为密度,cP 为各向同性介质的P 波速度,vi为射线的方位余弦.我们注意到式(3)右边为张量展开的多项式.根据张量调和展开理论[46]可得
|
(4) |
略去高角度项[49],式(4)可进一步简化为
|
(5) |
其中,θ,λ 分别为射线的入射角和方位角,A—W为各向异性系数.式(5)共有8 个参数,但其中只有6个独立参数.可以进一步写为
|
(6) |
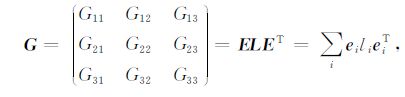
其中,xi表示射线的方向余弦.根据文献[49],公式(6)中系数矩阵G可表示为
|
(7) |
系数矩阵G的三个特征值分别为l1,l2,l3,相应的特征矢量分别为e1,e2,e3.其中最大特征值对应的是qP 波快波的速度扰动,相应的特征矢量对应的是qP波快波轴的方向.
公式(6)表明在弱各向异性条件下各向异性P波速度扰动可以近似地用6 个参数来描述.为了测试公式(6)描述P 波速度扰动的误差,我们利用公式(6)拟合了Pyrolite模型[50]qP 波相速度.如图 3所示,与精确值相比,qP 波相速度最大速度误差约为1.2%,平均速度误差小于0.3%.Bokelmann[49]研究认为四次以上的高角度项产生的速度误差不会大于2%.因此可以用8个球谐展开系数(6个独立参数)描述上地幔的三维各向异性.

|
图 3 PyroUte模型P波相速度调和展开近似 图中横坐标和纵坐标分别为相对于主对称轴的方位角和倾角. (a)利用8个调和展开系数拟合PyrUe模型的速度分布; (b)拟合误差. Fig. 3 Phase velocity variation of Pyrolite model The horizontal and vertical coordinates are azimuth and incident angle relative to the symmetry axis. (a) The phase velocity distribution of Pyrolite model (using 8 coefficients) ; (b) Phase velocity errors. |
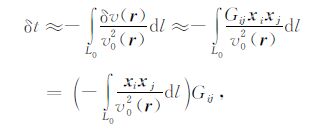
假设经过校正的台站相对走时残差(见第2节)的变化主要由介质的各向异性引起的,在一阶近似条件下并根据公式(6),走时扰动与各向异性参数的关系可以写为
|
(8) |
式中,v(r)为真实速度,v0(r)为各向同性参考速度,L0 为参考模型下的射线路径,x(r)= dr/ds为射线方向,G为介质的各向异性参数.公式(8)可以进一步简写为矩阵形式:

|
(9) |
式中D为相对走时残差组成的数据向量,G为介质的各向异性参数,A为反演核,其元素根据公式(8)右侧括号部分计算得到.
实验研究认为地幔各向异性主要存在于600km范围内,而在这个深度以下,岩石矿物不会再有优势排列[51].岩石学研究表明[50, 52],上地幔的各向异性强度约为3%~17%,平均约为6.6%.因此,本研究仅反演台站下方600km 范围内的各向异性.完整的反演步骤如下:首先根据Crust2.0模型和IASPEI91模型构建地震台站下方600km 深度范围内的一维P波速度模型;然后根据该速度模型计算远震P 波在台站下方的射线路径,并根据公式(8)计算反演核A;最后,求解线性方程组(9)即可以得到各向异性参数G,并根据公式(7)得到P波快波的方向.
4 结 果根据3节的数据预处理和各向异性反演方法,我们反演得到了分布在中国大陆及邻区内213个地震台站下方上地幔介质P 波快波方位、倾角和各向异性强度的分布情况.图 4 给出了中国大陆上地幔P波各向异性结构,图中红色线段的方位和长度分别表示台站下方600km 范围内平均P 波快波轴方向和各向异性强度.由于各向异性强度与非均匀结构强烈耦合[53],因此本文不讨论各向异性强度的结果.如图 4所示,中国大陆及邻区各向异性结构具有明显的分区特征,并与区域地质构造特征相吻合.下面我们详细介绍各构造单元内的各向异性特征.

|
图 4 中国大陆上地幔各向异性P波快波方向分布 图中红色线段为P波快波走向;蓝色箭头为相对于西伯利亚的GPS运动速率;背景为P波快波轴的倾角. Fig. 4 Distribution of fast P-wave directions in China mainland The red lines denote fast P-wave direction; blue arrows denote movement speed relative to Siberia; the background denote dip angle of fast P-wave. |
印度大陆的P 波快波方向总体为NNE 方向,与绝对板块运动方向[54]一致,这表明印度大陆上地幔流动方向与板块运动方向一致.在印度大陆北部和青藏高原南缘逐渐转向EW 方向,这与该区强烈挤压变形有关[55].在青藏高原内部数据较少,仅有拉萨台数据较为可靠.在青藏的北部及东北缘P快波方向转为SSE方向,这与SKS的结果相差约为45°[56],与该区的主压应力方向[57]垂直.我们推测这是由于受四川盆地和鄂尔多斯地块的阻挡,上地幔物质的晶轴沿垂直于主压应力方向展布.SKS研究观测到在该区的快波偏振方向依赖于数据的反方位角,推测可能存在倾斜各向异性[58].在青藏的东缘地区,我们的结果则与SKS的结果[56, 59]较为相近并垂直于主压应力方向.
4.2 天山造山带东天山的P波快波方向为NNE,与该区的主压应力方向一致,但与SKS的结果垂直.该区的SKS结果大体平行于天山山脉的走向.我们推测SKS的结果可能反映的是浅部岩石圈的结构,而我们的结果更多的是反映上地幔的结构.西天山、帕米尔的P波快波方向为NEE 向,垂直于该区的主压应力方向,推测该区东西天山的动力学机制不同.
4.3 华南地块在华南地块内部P 波快波方向为SE 方向,这与绝对板块的运动方向一致,与该区的主构造线垂直.该区域的SKS 波偏振分析结果相互矛盾,有NNE 方向[60],有SEE 方向[61]和SE 向[56].
4.4 华北和阿穆尔地块华北地块的各向异性结构较为复杂,华北平原P波快波的主体方向为SE 向,与SKS 的结果较为一致.在郯庐断裂带和太行山中央隆起带则平行于山体走向.中国大陆东北的东部平均方向为SE,而在兴安岭一侧为SSW 方向,即平行于构造线方向.
4.5 各向异性的倾角分布图 4 的背景显示为P 波快波轴与水平面的夹角.根据各向异性的倾角,中国大陆及邻区上地幔各向异性结构大体可分为三块:1)青藏新疆地区;2)南北带地区;3)中国东部地区.青藏新疆地区的各向异性倾角接近水平,推测该区形变力源主要为水平拖曳力,即上地幔水平流动的推动力.南北带地区的各向异性倾角较大,特别是在青藏东缘地区的倾角约为40°.这可能是由于青藏物质向东挤出过程中受华南地块和鄂尔多斯地块的阻挡在边界地带产生垂直变形引起的[62].中国东部地区各向异性结构较为复杂,在中国大陆东北部各向异性倾角接近水平,这可能是由于该区受到太平洋俯冲板块的影响上地幔以水平流动为主.在太行山、大别—苏鲁地区各向异性倾角较大,这可能是由于该区以垂直变形为主.
5 结论与讨论(1) 对于远震体波射线,其在地壳内的路径远小于其在地幔内的路径,因此地壳的各向异性可以忽略不计.据此,我们可以假设远震体波走时残差主要是由于非均匀结构和上地幔的各向异性引起的.非均匀结构只能引起速度的扰动,而只有各向异性才能引起速度的有规律的变化[34].当上地幔存在对称的高低速异常体的分布时可能会错误地解释为各向异性[63],但这种大尺度对称的速度异常分布较为少见.通过数值测试研究表明,在射线方位覆盖较全的情况下(大于270°)非均匀结构对反演结果的各向异性的方向影响较小,仅对各向异性的强度影响较大[53].
(2) 根据中国大陆及邻区上地幔P 波各向异性结构,我们可以推测中国大陆上地幔变形主要受印度板块、菲律宾及太平洋板块俯冲的影响.图 5给出了中国大陆变形的示意图.印度板块与青藏碰撞东边界表现为B型各向异性[64],即各向异性方向垂直于主压应力方向;而在西部边界则表现为A 型或C型各向异性[64],即各向异性方向平行于主压应力方向.同样,在东天山和西天山帕米尔也表现为不同的形变机制.印度板块向青藏下方俯冲造成了青藏的抬升并向东挤出,由于鄂尔多斯和华南地块的阻挡,在青藏东北缘表现为B 型各向异性;青藏物质绕喜马拉雅构造节向东南挤出,则该区上地幔各向异性表现为A 型或C 型.扬子地块的各向异性与上地幔流动及绝对板块运动方向一致.华北地块可能受到太平洋板块俯冲的影响在华北平原形成A 或C 形变,而受鄂尔多斯地块的阻挡在太行山前形成B 型变形.阿莫斯地块与华北地块类似,形变特征也主要受太平洋板块俯冲的影响.

|
图 5 中国大陆上地幔变形示意图 白色箭头表示上地幔流动方向与主压应力方向及观测到的各向 异性方向一致;工色箭头表示主压应力方向,且垂直于观测到的 各向异性方向. Fig. 5 Upper-mantle deformation of China mainland The white arrows imply that the upper mantle flow directions are consistent with the principal stress and anisotropic directions; the red arrows denote the principal stress direction and perpendicular to the anisotropic direction. |
(3) 在比较根据不同方法获得的各向异性结果时一定要考虑如下因素:数据类型和信息(体波、面波、走时信息、偏振信息等)、深度敏感度、频率的依赖及初始各向异性假设.P 波走时方法获得的结果反映的是P 波快波轴的方向,而偏振分析方法(如SKS)得到的结果是S波快波的偏振方向.在不同类型的各向异性介质情况下,这两个的方向可能不同[65].P波偏振反映1/2 波深度范围内的各向异性,SKS波偏振主要敏感区为~1 波长深度范围内的各向异性,而远震P 波走时则反映射线路径上平均结果[16].如果地下介质由多层各向异性介质构成,则SKS的偏振方向趋于浅层介质的偏振方向.S波分裂方法一般是假定上地幔为HTI介质,但如果任意倾向的各向异性介质,S 波分裂方法可能给出相互矛盾的结果[16, 63].为了便于处理和减少反演的不确定性,很多研究假设介质为TI介质,这种假定在远离构造边界地区可能是合理的,但在大洋中脊、热点和俯冲带就不一定合理,在这些地区地幔对流在较小的尺度上能产生较大的变化[9].图 6给出了倾斜的TI和正交各向异性介质情况下,P波走时方法和S波分裂方法的对比.如图 6所示,对于倾斜对称轴情况下正交各向异性介质,由于投影关系的不同,S波分裂方法和P波走时方法给出的结果可能相互垂直.因此对于可能存在倾斜各向异性的复杂构造区(如俯冲带、造山带等地区),P 波走时方法能给出相对真实的各向异性结果.

|
图 6 P波视速度与S波偏振的关系(根据文献[16, 62]修改) 图中的正负号表示P波走时残差分布,白色箭头表示观测到的SKS偏振方向;(a)表示倾斜TI介质,(b)表示倾斜的正交各向异性介质. Fig. 6 Relationship between P-wave apparent velocity and S-wave polarization (modified from Refs.[16, 62]) The positive and negative symbols represent the distribution of P-wave traveltime residuals,and the white arrows denote SKS polarization direction; (a)represents TTI media,and (b) represents orthotropic media with tilt symmetric axis. |
(4) 由于各向异性的成因比较复杂,在相同的构造应力作用下,裂隙和晶体排列方向可能不同,在某些情况下,也可能存在垂直于应力方向的裂隙,这种反向构造作用使各向异性信息非常难于解释[66].岩石学实验表明[3]快波轴方向趋于主张应力方向或最大变形方向,而不是剪切方向.这意味着即使在板块底部的单剪应力作用下也可以产生倾斜的各向异性对称轴.在水平纯剪应力作用下,例如裂谷扩张或造山压缩地区快波对称轴方向与流动方向一致.由于热对流引起的单剪应力条件下,快波对称轴方向也与流动方向一致.但是当有水时会改变橄榄石滑移平面的强度和形变方式,例如俯冲带和岛弧地区在这种情况下,对称轴方向与流动方向的关系变得非常复杂,甚至出现相互垂直的关系[67].
致谢两位匿名评审专家对本文提出了宝贵意见,文中图 1—5 使用GMT[68]绘图软件包绘制,研究使用的走时数据来源于中国地震局台网中心和国际地震数据中心(ISC),在此一并表示感谢.
| [1] | Montagner J P, Griot-Pommera D A, Lavé J. How to relate body wave and surface wave anisotropy?. J. Geophys. Res., , 2000, 105(B8): 19015-19027. DOI:10.1029/2000JB900015 |
| [2] | Babuska V, Cara M. Seismic Anisotropy in the Earth. Boston: Kluwer Academic Publishers , 1991. |
| [3] | Zhang S Q, Karato S I. Lattice preferred orientation of olivine aggregates deformed in simple shear. Nature , 1995, 375(6534): 774-777. DOI:10.1038/375774a0 |
| [4] | Tommasi A. Forward modeling of the development of seismic anisotropy in the upper mantle. Earth Planet. Sci. Lett. , 1998, 160(1-2): 1-13. DOI:10.1016/S0012-821X(98)00081-8 |
| [5] | Park J, Levin V. Seismic anisotropy: Tracing plate dynamics in the mantle. Science , 2002, 296(5567): 485-489. DOI:10.1126/science.1067319 |
| [6] | Okaya D A, McEvilly T V. Elastic wave propagation in anisotropic crustal material possessing arbitrary internal tilt. Geophys. J. Int. , 2003, 153(2): 344-358. DOI:10.1046/j.1365-246X.2003.01896.x |
| [7] | Ribe N M. On the relation between seismic anisotropy and finite strain. J. Geophys. Res. , 1992, 97(B6): 8737-8747. DOI:10.1029/92JB00551 |
| [8] | Jung H, Karato S I. Water-induced fabric transitions in olivine. Science , 2001, 293(5534): 1460-1463. DOI:10.1126/science.1062235 |
| [9] | Kaminski , Ribe N M. Timescales for the evolution of seismic anisotropy in mantle flow. Geochem. Geophys. Geosyst. , 2002, 3: 1051. DOI:10.1029/2001GC000222 |
| [10] | Beghein C, Trampert J. Probability density functions for radial anisotropy from fundamental mode surface wave data and the Neighbourhood Algorithm. Geophys. J. Int. , 2004, 157(3): 1163-1174. DOI:10.1111/gji.2004.157.issue-3 |
| [11] | McKenzie D. Finite deformation during fluid flow. Geophys. J. R. Astr. Soc. , 1979, 58(3): 687-715. |
| [12] | Ribe N M. Seismic anisotropy and mantle flow. J. Geophys. Res. , 1989, 94(B4): 4213-4223. DOI:10.1029/JB094iB04p04213 |
| [13] | Becker T W, Kellogg J B, Ekström G, et al. Comparison of azimuthal seismic anisotropy from surface waves and finite strain from global mantle-circulation models. Geophys. J. Int. , 2003, 155(2): 696-714. DOI:10.1046/j.1365-246X.2003.02085.x |
| [14] | Gaboret C, Forte A M, Montagner J P. The unique dynamics of the Pacific Hemisphere mantle and its signature on seismic anisotropy. Earth Planet. Sci. Lett. , 2003, 208(3-4): 219-233. DOI:10.1016/S0012-821X(03)00037-2 |
| [15] | Blackman D K, Wenk H R, Kendall J M. Seismic anisotropy of the upper mantle: 1.Factors that affect mineral texture and effective elastic properties. Geochem. Geophys. Geosyst , 2002, 3: 8601. DOI:10.1029/2001GC000248 |
| [16] | Schulte-Pelkum V, Blackman D K. A synthesis of seismic P and S anisotropy. Geophys. J. Int. , 2003, 154(1): 166-178. DOI:10.1046/j.1365-246X.2003.01951.x |
| [17] | Silver P G, Chan W W. Implications for continental structure and evolution from seismic anisotropy. Nature , 1988, 335(6185): 34-39. DOI:10.1038/335034a0 |
| [18] | Vinnik L P, Farra F, Romanowicz B. Azimuthal anisotropy in the Earth from observations of SKS at GEOSCOPE and NARS broadband stations. Bull. Seism. Soc. Am. , 1989, 79(6): 1542-1558. |
| [19] | Savage M K, Silver P G, Meyer R P. Observations of teleseismic shear-wave splitting in the Basin and Range from portable and permanent stations. Geophys. Res. Lett. , 1990, 17(1): 21-24. DOI:10.1029/GL017i001p00021 |
| [20] | Fouch M J, Fischer K M, Parmentier E M, et al. Shear wave splitting, continental keels, and patterns of mantle flow. J. Geophys. Res. , 2000, 105(B3): 6255-6275. DOI:10.1029/1999JB900372 |
| [21] | Silver P G. Seismic anisotropy beneath the continents: Probing the depths of geology. Annu. Rev. Earth Plant. Sci. , 1996, 24: 385-432. DOI:10.1146/annurev.earth.24.1.385 |
| [22] | Chen Y, Zhang Z J, Sun C Q, et al. Crustal anisotropy from Moho converted Ps wave splitting analysis and geodynamic implications beneath the eastern margin of Tibet and surrounding regions. Gondwana Res. , 2012. DOI:10.1016/j.gr.2012.04.003 |
| [23] | Vinnik L P, Makeyeva L I, Milev A, et al. Global patterns of azimuthal anisotropy and deformations in the continental mantle. Geophys. J. Int. , 1992, 111(3): 433-447. DOI:10.1111/gji.1992.111.issue-3 |
| [24] | Chen Y, Badal J, Zhang Z J. Radial anisotropy in the crust and upper mantle beneath the Qinghai-Tibet Plateau and surrounding regions. J. Asian Earth Sci. , 2009, 36(4-5): 289-302. DOI:10.1016/j.jseaes.2009.06.011 |
| [25] | Montagner J P, Nataf H C. A simple method for inverting the azimuthal anisotropy of surface waves. J. Geophys. Res. , 1986, 91(B1): 511-520. DOI:10.1029/JB091iB01p00511 |
| [26] | Trampert J, Woodhouse J H. Global anisotropic phase velocity maps for fundamental mode surface waves between 40 and 150 s. Geophys. J. Int. , 2003, 154(1): 154-165. DOI:10.1046/j.1365-246X.2003.01952.x |
| [27] | Boschi L, Ekstrom G. New images of the Earth’s upper mantle from measurements of surface wave phase velocity anomalies. J. Geophys. Res. , 2002, 107(B4): 1-20. |
| [28] | Shapiro N M, Ritzwoller M H. Monte-Carlo inversion for a global shear velocity model of the crust and upper mantle. Geophys. J. Int. , 2002, 151(1): 88-105. DOI:10.1046/j.1365-246X.2002.01742.x |
| [29] | Forsyth D W, Li A. Array-analysis of two-dimensional variations of surface wave phase velocity and azimuthal anisotropy in the presence of multipathing interference. // Levander A, Nolet G. Seismic Data Analysis and Imaging with Global and Local Arrays. Washington, DC: AGU, 2005. |
| [30] | Babuka V, Plomerová J, ileny J. Spatial variations of P residuals and deep structure of the European lithosphere. Geophys. J. R. Astr. Soc. , 1984, 79(1): 363-383. DOI:10.1111/j.1365-246X.1984.tb02863.x |
| [31] | Martynov V G, Vernon F L, Kilb D L, et al. Directional variations in travel-time residuals of teleseismic P Waves in the crust and mantle beneath northern Tien Shan. Bull. Seism. Soc. Am. , 2004, 94(2): 650-664. DOI:10.1785/0120030015 |
| [32] | Plomerová J, Babuka V, íleny J, et al. Seismic anisotropy and velocity variations in the mantle beneath the Saxothuringicum-Moldanubicum contact in central Europe. Pure Appl. Geophys. , 1998, 151(2-4): 365-394. |
| [33] | Plomerová J, Margheriti L, Park J, et al. Seismic anisotropy beneath the Northern Apennines (Italy): Mantle flow or lithosphere fabric?. Earth Planet. Sci. Lett. , 2006, 247(1-2): 157-170. DOI:10.1016/j.epsl.2006.04.023 |
| [34] | S'roda P. Seismic anisotropy of the upper crust in southeastern Poland-effect of the compressional deformation at the EEC margin: results of CELEBRATION 2000 seismic data inversion. Geophys. Res. Lett. , 2006, 33: L22302.. DOI:10.1029/2006GL027701 |
| [35] | Yin A. Cenozoic tectonic evolution of Asia: a preliminary synthesis. Tectonophysics , 2010, 488(1-4): 293-325. DOI:10.1016/j.tecto.2009.06.002 |
| [36] | Zhu R X, Chen L, Wu F Y, et al. Timing, scale and mechanism of the destruction of the North China Craton. Sci. China Earth Sci. , 2011, 54(6): 789-797. DOI:10.1007/s11430-011-4203-4 |
| [37] | Tapponnier P, Peltzer G, Le Dain A Y, et al. Propagating extrusion tectonics in Asia: New insights from simple experiments with plasticine. Geology , 1982, 10(12): 611-616. DOI:10.1130/0091-7613(1982)10<611:PETIAN>2.0.CO;2 |
| [38] | Liang C T, Song X D, Huang J L. Tomographic inversion of Pn travel times in China. J. Geophys. Res. , 2004, 109: B11304. DOI:10.1029/2003JB002789 |
| [39] | Pei S P, Zhao J M, Sun Y S, et al. Upper mantle seismic velocities and anisotropy in China determined through Pn and Sn tomography. J. Geophys. Res. , 2007, 112: B05312,. DOI:10.1029/2006JB004409 |
| [40] | 罗艳, 黄忠贤, 彭艳菊, 等. 中国大陆及邻区SKS波分裂研究. 地球物理学报 , 2004, 47(5): 812–821. Luo Y, Huang Z X, Peng Y J, et al. A study on SKS wave splitting beneath the China mainland and adjacent regions. Chinese J. Geophys. (in Chinese) , 2004, 47(5): 812-821. |
| [41] | Fu Y Y, Chen Y S, Li A B. Seismic anisotropy beneath the Chinese mainland. Earthquake Science , 2010, 23(6): 583-595. DOI:10.1007/s11589-010-0758-y |
| [42] | 彭艳菊, 黄忠贤, 苏伟, 等. 中国大陆及邻区海域地壳上地幔各向异性研究. 地球物理学报 , 2007, 50(3): 751–759. Peng Y J, Huang Z X, Su W, et al. Anisotropy in crust and upper mantle beneath China continent and its adjacent seas. Chinese J. Geophys. (in Chinese) , 2007, 50(3): 751-759. |
| [43] | 易桂喜, 姚华建, 朱介寿, 等. 用Rayleigh面波方位各向异性研究中国大陆岩石圈形变特征. 地球物理学报 , 2010, 53(2): 256–268. Yi G X, Yao H J, Zhu J S, et al. Lithospheric deformation of continental China from Rayleigh wave azimuthal anisotropy. Chinese J. Geophys. (in Chinese) , 2010, 53(2): 256-268. |
| [44] | Huang Z X, Peng Y J, Luo Y, et al. Azimuthal anisotropy of Rayleigh waves in East Asia. Geophys. Res. Lett. , 2004, 31: L15617. DOI:10.1029/2004GL020399 |
| [45] | Savage M K. Seismic anisotropy and mantle deformation: what have we learned from shear wave splitting?. Rev. Geophys. , 1999, 37(1): 65-106. DOI:10.1029/98RG02075 |
| [46] | Backus G E. Possible forms of seismic anisotropy of the uppermost mantle under oceans. J. Geophys. Res. , 1965, 70(14): 3429-3439. DOI:10.1029/JZ070i014p03429 |
| [47] | Bird P. An updated digital model of plate boundaries. Geochem. Geophys. Geosyst. , 2003, 4: 1027. DOI:10.1029/2001GC000252 |
| [48] | Bassin C, Laske G, Masters G. The current limits of resolution for surface wave tomography in North America. EOS Trans. AGU , 2000, 81: F897. |
| [49] | Bokelmann G H R. Convection-driven motion of the North American craton: evidence from P-wave anisotropy. Geophys. J. Int. , 2002, 148(2): 278-287. |
| [50] | Ringwood A E. Composition and Petrology of the Earth’s Mantle. New York: McGraw-Hill , 1975. |
| [51] | Karato S I, Li P. Diffusion creep in perovskite: Implications for the rheology of the lower mantle. Science , 1992, 255(5049): 1238-1240. DOI:10.1126/science.255.5049.1238 |
| [52] | Ismail W B, Mainprice D. An olivine fabric database: An overview of upper mantle fabrics and seismic anisotropy. Tectonophysics , 1998, 296(1-2): 145-157. DOI:10.1016/S0040-1951(98)00141-3 |
| [53] | 郭飚. 非均匀各向异性介质的地震P波走时层析成像研究. 北京: 中国地震局地质研究所 , 2009. Guo B. Seismic P-wave travel-time tomography in heterogeneous and anisotropic media (in Chinese). Beijing: Institute of Geology, CEA (in Chinese) , 2009. |
| [54] | Gripp A E, Gordon R G. Young tracks of hotspots and current plate velocities. Geophys. J. Int. , 2002, 150(2): 321-361. DOI:10.1046/j.1365-246X.2002.01627.x |
| [55] | McNamara D E, Owens T J, Silver P G, et al. Shear wave anisotropy beneath the Tibetan Plateau. J. Geophys. Res. , 1994, 99(B7): 13655-13665. DOI:10.1029/93JB03406 |
| [56] | Huang Z C, Wang L S, Zhao D P, et al. Seismic anisotropy and mantle dynamics beneath China. Earth Planet. Sci. Lett. , 2011, 306(1-2): 105-117. DOI:10.1016/j.epsl.2011.03.038 |
| [57] | Heidbach O, Tingay M, Barth A, et al. Global crustal stress pattern based on the World Stress Map database release 2008. Tectonophysics , 2010, 482(1-4): 3-15. DOI:10.1016/j.tecto.2009.07.023 |
| [58] | Zhao L, Zheng T Y, Lu G, et al. No direct correlation of mantle flow beneath the North China Craton to the India-Eurasia collision: constraints from new SKS wave splitting measurements. Geophys. J. Int. , 2011, 187(2): 1027-1037. DOI:10.1111/gji.2011.187.issue-2 |
| [59] | Lev E, Long M D, van der Hilst R D. Seismic anisotropy in Eastern Tibet from shear wave splitting reveals changes in lithospheric deformation. Earth Planet. Sci. Lett. , 2006, 251(3-4): 293-304. DOI:10.1016/j.epsl.2006.09.018 |
| [60] | Zhao L, Zheng T Y, Chen L, et al. Shear wave splitting in eastern and central China: implications for upper mantle deformation beneath continental margin. Phys. Earth Planet. Int. , 2007, 162(1-2): 73-84. DOI:10.1016/j.pepi.2007.03.004 |
| [61] | Chang L J, Wang C Y, Ding Z F. Seismic anisotropy of upper mantle in eastern China. Sci. China (Ser D-Earth Sci.) , 2009, 52(6): 774-783. DOI:10.1007/s11430-009-0073-4 |
| [62] | Zhang Z J, Yuan X H, Chen Y, et al. Seismic signature of the collision between the east Tibetan escape flow and the Sichuan Basin. Earth Planet. Sci. Lett. , 2010, 292(3-4): 254-264. DOI:10.1016/j.epsl.2010.01.046 |
| [63] | Savage M K, Sheehan A F. Seismic anisotropy and mantle flow from the Great Basin to the Great Plains, western United States. J. Geophys. Res. , 2000, 105(B6): 13715-13734. DOI:10.1029/2000JB900021 |
| [64] | Karato S I, Jung H, Katayama I, et al. Geodynamic significance of seismic anisotropy of the upper mantle: new insights from laboratory studies. Annu. Rev. Earth Plant. Sci. , 2008, 36: 59-95. DOI:10.1146/annurev.earth.36.031207.124120 |
| [65] | Anderson D L. Theory of the Earth. Boston: Blackwell Scientific Publication , 1989. |
| [66] | Fouch M J, Rondenay S. Seismic anisotropy beneath stable continental interiors. Phys. Earth Planet. Int. , 2006, 158(2-4): 292-320. DOI:10.1016/j.pepi.2006.03.024 |
| [67] | Park J, Levin V. Seismic anisotropy: Tracing plate dynamics in the mantle. Science , 2002, 296(5567): 485-489. DOI:10.1126/science.1067319 |
| [68] | Wessel P, Smith W H F. New version of the Generic Mapping Tools released. Eos Trans. AGU , 1995, 76: 329. |