 2012, Vol. 55


2. 武汉大学测绘学院, 武汉 430079
2. School of Geodesy and Geomatics, Wuhan University, Wuhan 430079, China
由于近年来随着大地震的频发,导致地壳垂直形变和物质迁移之间的关系的问题越来越成为科学研究的热点[1-3].传统的研究方法采用的是流动重力测量方法对某地区进行多年反复重力联测,对多年来重力和地壳垂直位移的观测数据进行分析获得两者之间的相互变化规律[4].然而随着GPS技术的不断进步,绝对重力测量精度不断提高,该热点问题又有了新的解决方案.中国科学院利用绝对重力测量、GPS观测、GRACE 等现代大地测量的方式证实了青藏高原隆升和阿拉斯加东南部冰后回弹等的地球动力学事件[5-6].然而无论是上述的相对重力联测法还是绝对重力测定法,都不可避免地遇到时间分辨率和观测精度低下的问题,以至于无法精细描述测量周期内的物质迁移过程的问题.这些都给地球物理解释带来了极大的障碍和困扰.随着生产工艺不断进步,一种高精度和高稳定度的连续重力观测仪-超导重力仪生产出来.中国科学院利用早期的超导重力仪检测出海潮、极移、气压[7-8]对重力的影响,而且利用改正后的重力残差来探测例如地球自由震荡、Slichter模等可能加杂在环境噪声内的微弱信号[9-13].与此同时,在GPS、绝对重力、卫星重力和全球水储量模型[14-16]等现代大地测量方法和全球环境监测技术的不断应用,超导重力仪不仅能连续稳定地观测到某地区的重力季节性变化,而且能够分析该地区的地壳形变和重力变化之间中长期[17]相互关系.这为研究地壳运动和物质迁移之间关系这一热点问题又提供了新的观测手段和分析方法.
本文利用SGC053超导重力仪上正式观测到首次进行冷头维护的超过1年半的观测数据(13000h),结合台站气压数据,绝对重力观测数据,周边的GPS观测结果,卫星重力和全球水储量等辅助监测手段,在改正了武汉九峰地震台环境因素,仪器漂移的影响后,研究武汉地区的地壳垂直运动和地下物质迁移之间中短期量化关系.
2 超导重力仪的潮汐分析由于地壳垂直运动和物质迁移对研究地震有重要意义,2009年中国地震局数字地震观测网络项目引进了由美国GWR 公司生产的型号为SGC053的超导重力仪安装在武汉九峰地震台观测室中.台站配备了气压、温度和降雨三要素作为辅助观测.该仪器于2008年9月13日开始安装,9月26日完成安装测试.运行稳定后于2009年2月开始正式连续重力观测.
2.1 SGC053的潮汐分析SGC053采用重力和气压同址观测,采样率均为1s/次.观测数据的降采样采用的是加汉宁窗的数字低通滤波器将秒采样数据滤波为分钟采样,再利用国际固体潮中心推荐的软件系统在重力残差时间序列上对诸如缺记部分、地震影响部分的数据采用线性或者3次多项式拟合,以减小或者消除非中长周期因素对残差时间序列的影响,最后恢复预处理后的分钟值固体潮观测数据.本文采用国际固体潮中心推荐的ETERNA33潮汐分析软件对武汉台SGC053的2009年2月16日至2010年07月23日连续观测预处理的整时值资料进行分析.同时利用VAV03潮汐分析软件进行比较(分析结果见表 1).
|
|
表 1 VAV 03、ETERNA 33主要潮波的振幅因子及其相位 Table 1 Harmonic analytical results and their comparison of tidal gravity parameters between VAV03 and ETERNA33 |
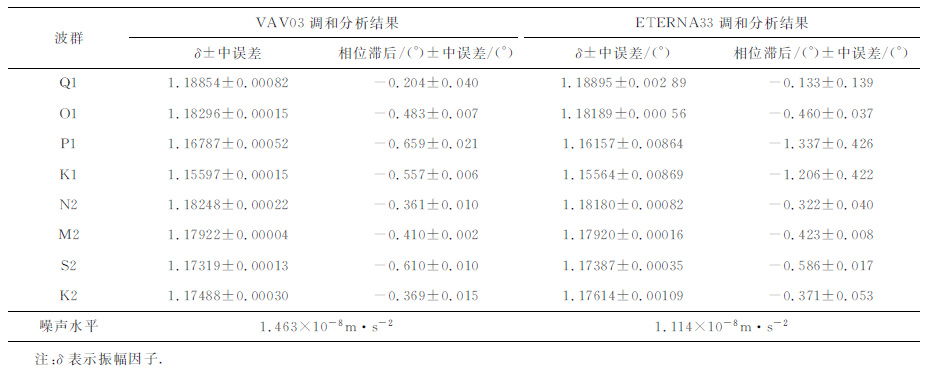
从潮汐分析结果表明:两套分析软件所获得的潮汐参数和白噪声水平基本一致,SGC053 观测到的白噪声约为(±1.14~1.40)×10-8m·s-2;而最优潮汐参数结果能够达到0.1‰ 以上的精度.这表明,在九峰台±1×10⁻⁸m·s-2左右的噪声水平下,SGC053超导重力仪仪器运行状态稳定,能够精确地进行潮汐观测.
根据上述两套潮汐分析软件获得的潮汐参数和Dehant的理论潮汐模型进行比较表明(参见表 2),实际观测振幅因子普遍大于理论振幅因子(约-1%~-2%).经过海潮改正后,八个主潮的振幅因子与Dehant的理论值的差异均很大程度地减小(均缩小至-0.1~ -0.6%).这些都表明两套软件系统计算的八个潮汐参数在一个量级上.它们经过海潮改正后的振幅因子和Dehant理论值基本一致.海潮负荷影响量级较小,两套软件系统都能够提供高精度潮汐分析结果和潮汐改正模型.本文利用VAV03的潮汐分析模型进行合成潮改正.
|
|
表 2 海潮改正后的八个主要潮波振幅因子与理论值的比较 Table 2 The eight main tidal gravity parameters after ocean tidal model Nao99 derived from the theoretical ones |
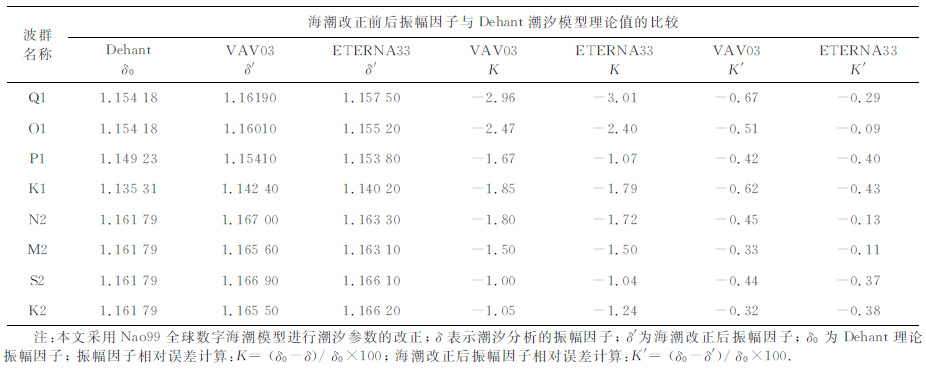
本文海潮负荷采用日本气象厅提供的Nao99模型中21个潮波的全球数字海潮图,利用负荷格林函数全球积分计算九峰地震台的海潮负荷影响量级.计算表明九峰地震台2009年至2010年海潮对重力的影响最大变幅只有3×10⁻⁸m·s-2.
从国际地球自转服务(IERS)的网站下载每日极移观测数据计算极移对重力的影响[18].利用线性函数内插成为小时值作为改正.计算结果表明九峰地震台2009年至2010年极移引起的重力变化最大变幅为10×10-8m·s-2.
分析气压对重力的影响通常有两类方法[19].第一种方法是利用格林函数法或球谐函数法,进行全球积分获得该地区的气压对重力的影响,第二种方法是利用该地区的气压变化时间序列来直接改正.本文采用气压导纳值-0.34×10⁻⁸(m·s-2)/mbar和同址观测的气压数据对重力残差时间序列进行改正.计算结果表明九峰地震台2009年至2010 年气压引起的重力变化最大变幅为12×10-8m·s-2.
从上述内容可知,无论是变幅大小还是周期长度,在扣除合成潮影响后,影响超导重力仪的年周期信号的主要原因是气压和极移.利用同址观测的气压数据,以及IERS 提供的极移服务能较好地改正这两个方面的影响.

|
图 1 SGC035超导重力仪2009-02-16至2010-07-24的预处理数据、外界因素影响和残差时间序列 (a)SGC053超导重力仪数据预处理数据;(b)利用Nao99全球海潮模型模拟的九峰地震台海潮负荷;(c)利用IERS提供的极移服务模拟的九峰地震台极移潮;(d)本地气压负荷影响;(e)固体潮、气压潮和极移潮改正后的重力残差时间序列. Fig. 1 The SGC053 datum of preprocess, ocean tidal loading, polar tide, air pressure correction andthe residual gravity from 2009-02-16 to 2010-07-24 (a)The preprocessing data of SGC053; (b)The ocean load by Nao99 ocean model in Jiufeng seismic station; (c)Pole tide;(d) Atmospheric loading effects; (e) The residual gravity corrected by solid earth tides, atmospheric loading effects and pole tide. |
超导重力仪漂移测定的唯一方法是和绝对重力仪多次、大时间跨度的同址观测[20-21].从2009 年至2010年SGC053 和FG5-232 在武汉九峰地震台冬春两季进行了4 次同址观测(如图 2).超导重力仪的残差时间序列表明:冬春季没有发生明显的重力异常现象(变幅约为(2~3)×10-8m·s-2),该结果和4次绝对重力测量结果基本一致.考虑超导重力仪的一次项系数,计算绝对重力测量拟合趋势为1.79×10⁻⁸(m·s-2)/a, 可以推算出SGC053 仪器漂移约为:2.18×10⁻⁸(m·s-2)/a.在绝对重力仪观测精度为±2×10-8m·s-2的情况下,漂移改正后的超导重力仪重力残差时间序列和绝对重力仪的观测结果更加吻合.

|
图 2 利用FG5-232绝对重力测定法测定SGC053的观测漂移 黑色实线为SGC035重力残差时间序列;黑色虚线为残差时间序列的拟合,由gSGC053表示;灰色实线为漂移改正后重力残差时间序列; 灰色虚线为绝对重力线性拟合,由gFG5-232表示;黑色圆圈为绝对重力观测结果;图 2公式中t单位为h Fig. 2 The drift correction of residual gravity in SGC053 observed by FG5-232 The black solid line represents the gravity residual of SGC053 ; the black dotted trend line represents the linear fitting of the gravity residual SGC053 (gSGC053) ; the gray solid line represents the gravity residual corrected by drift ; the gray dotted trend represents the linear fitting from the four times absolute gravity observations (gFG5-232); the red circle represents the absolute gravity observations; the unit of t is hourin this picture. |
CPC(ClimatePredictionCenter)是美国NOAA的气候预测中心提供的一种全球水储量模型,时间分辨率为1个月的0.5°×0.5°土壤湿度网格数据.GLDAS(globallanddataassimilationsystems)是美国NASA 的CSR 实验室提供的全球大陆数据融合系统.该系统中的水储量模型的空间分辨率为1°×1°,时间分辨率为1个月.
本文利用图 2中经过漂移改正后的重力残差时间序列,GRACE (the Gravity Recovery and Climate Experiment satellite mission)不同滤波半径的时变重力场模型、CPC 和GLDAS 水负荷模型之间的相关分析[22-25].比较表明(结果见表 3)全球模型和台站特定地域差异形成了两者之间约1~2个月的时间滞后,两者时变重力相关性优于80%.本文利用GLDAS的滞后32天,GRACE 的滞后42 天、CPC 的52 天来修正全球模型和台站特定地域引起的差异如图 3.

|
图 3 GRACE、CPC和GLDAS时间滞后校准前后和SGC053、FG5-232观测比较 紫红色线条为1000km滤波半径的GRACE时变重力场时间序列;灰色线条为SGC053的重力残差时间序列;蓝色线条为利用 GLDAS全球陆地水模型模拟的水负荷影响;红色线条为利用CPC全球陆地水模型模拟的水负荷影响;黑色线条为SGC053的重力残差时间序列的月均值;红色圆圈表示四次绝对重力观测. Fig. 3 The comparison between gravity variation and GRACE,CPC,GLDAS before and after the time lag correction The magenta line is the GRACE time-variable gravity field filtering by 1000km; the gray line is the gravity residuals of SGC053; the blue lines the hydrology loading from GLDAS; the red line s the hydrology loading from CPC; the black line s the monthly mean of thegravity residuals of SGC053; the red circle s the absolute gravity observations. |
|
|
表 3 重力残差时间序列和全球水储量模型以及 GRACE时变重力的相关分析 Table 3 The correlation analysis amount the gravityresidual, global continental water storage and GRACE time-variable gravity data |

在武汉九峰地震台冬春季节的4次绝对重力测量结果((1~3)×10-8m·s-2左右的变化)表明,绝对重力测量时段重力变化较为平稳且和SGC053的连续重力观测结果基本一致;而在2009 年7 月至2010 年1 月夏秋两季SG 重力仪产生了超过(6~8)×10-8m·s-2的重力异常,该重力异常变化和GRACE、GLDAS、CPC 模型计算的结果具有超过80%的一致性[26],这一时段正值武汉的雨季,结合GRACE、GLDAS和CPC 的物理含义说明水负荷是引起夏秋季重力异常变化的主要原因.
3.3 重力变化和地壳垂直运动的关系考虑到SGC053在冬春两季水负荷对重力的影响不明显的特点,利用2009-02-16至2009-06-25和2010-03-02至2010-07-23 两个冬春两季时变重力过程((2~3)×10-8m·s-2)和九峰地震台周边2个GPS 站(武汉IGS 站-WUHNIGS 和武汉九峰站-WHJF)的垂直位移时变过程研究两者之间的关系,如图 4.

|
图 4 冬春季重力残差时间序列和GPS垂直位移之间时间序列的比较 (a)从2009-02-16至2009-06-25时段重力残差和GPS垂直位移之间的一元线性回归参数,以及它们拟合线一元线性回归参数之间的比值分别为:-338×10-8 (m • s-2)/m 和-226 ×10-8 (m • s-2)/m; (b)从 2010-03-03 至 2010-07-23 时段重力残差和 GPS 垂直位移之间的一元线性回归参数,以及它们拟合线回归参数之间的比值分别为:-172×10-8(m • s-2)/m和-468×10-8 (m • s-2)/m;本图公式中t的单位是h. Fig. 4 The gravity residual derived from vertical displacement of GPS from winter to spring (a) The one-dimensional linear regression parameter between the gravity residual and the vertical displacement of GPS is about - 338 ×10-8 (m • s-2) /m; And the ratio between their one-dimensional linear regression parameter is about -226 ×10-8 (m • s-2) /m from 2009-02-16 to 2009-06-25; (b) The one-dimensional linear regression parameter between the gravity residual and the vertical displacement ofGPS is about - 172×10-8 (m • s-2 )/m ; And the ratio between their one-dimensional linear regression parameter is about - 468 ×10-8 (m • s-2)/m from 2010-03-03 to 2010-07-23; the unit of t is hour in this picture. |
图 4表明,虽然两个时段的重力变化和垂直位移的线性拟合斜率之间的比值、相关系数都和物理大地测量中垂直位移和重力变化规律的-302×10-8m·s-2/m 略有差异,然而该季节内的短期重力变化和地壳垂直位移之间出现的明显的负相关规律和上述理论规律一致(地壳下沉,重力增加),分析表明该地区重力和地壳垂直位移的变化态势为重力处于上升趋势,地壳处于下沉趋势,两者关系和理论值的量化差异主要是由于外界环境因素所致.
根据上述分析除重力仪漂移外,影响中短期重力残差时间序列的主要因素是水负荷的影响.因此在扣除重力仪的漂移2.18×10⁻⁸(m·s-2)/a后,本文利用相关系数超过80%的GLDAS和GRACE进行了水负荷改正.将水负荷改正后重力残差时间序列和武汉九峰地震台周边的相距不到15km 的WUHNISG 以及WUJF站的垂直位移时间序列进行比较,如图 5.

|
图 5 重力残差时间序列和GPS垂直位移时间序列的比较 (a)进行GLDAS水负荷改正后残差时间序列及其趋势项gres ;(b)进行高斯滤波半径为1000 km的GRACE时变重力场改正后的残差时间序列及其趋势项gres; (c) WUHN IGS的GPS观测到的本地区垂直位移变化;(d) WHFN的GPS观测到的本地区垂直位移变化及其趋势项hz; 本图公式中t单位为h. Fig. 5 The gravity residual of SGC053 corrected by GLDAS and GRACE derived from vertical displacement of GPS (a) The gravity residual corrected by the hydrology loading from GLDAS and the trend line (gres) ; (b) The gravity residual corrected by the GRACE time-variable gravity field of filtering 1000 km radius and the trend line(gres) ; (c) The vertical displacement of GPS in WUHN IGS; (d) The vertical displacement of GPS in WHFN and the trend Hne(hz) ; the unit of t is hour in this picture. |
图 5中相距15km 的2个GPS站观测数据在2009-09-28到2009-10-30之间出现同步抬升,后同步下沉的一致事件,这表明中国科学院九峰站的GPS垂直位移可以表达该地区的垂直位移特征,而全部观测数据显示该地区处于下沉趋势.利用两个全球模型(GLDAS 和GRACE)修正九峰地震台的SGC053残差时间序列表明:虽然在短期变化上两者并不同步,但是长期看表现出重力增加的特点.利用GLDAS模型改正后重力残差和地壳垂直形变的比值为-434×10-8(m·s)-2/m, 略低于中国科学院的结果[27].GRACE 的改正结果为-354×10-8(m·s-2)/m, 则几乎和中国科学院的分析结果一致.虽然短期由于外界环境因素的干扰,导致地壳产生的重力梯度值不完全一致,但是无论是短期还是长期观测结果都表明武汉地区地壳处于下沉趋势,这样的构造形变引起了该地区重力上升趋势.
4 结论与讨论本文利用武汉九峰地震站SGC053的首次13000h的连续重力观测数据、台站及其周边的辅助观测数据,全球陆地水模型以及GRACE 数据进行综合分析,九峰站在噪声水平约为±1.1×10⁻⁸(m·s-2)/m 的情况下,最优潮汐参数能够达到优于0.1‰的精度.利用Nao99全球海潮模型改正后的潮汐参数和Dehant的理论潮汐模型处于同一个量级内,利用FG5-232和SGC053的4次比较测量计算的SGC053的漂移量只有2.18×10⁻⁸ m ·s-2 ·a-1.这些都表明SGC053重力仪在首次连续重力观测中海潮负荷影响量级小,潮汐观测具有极高的稳定性,潮汐分析结果能够用于潮汐改正.
在经过合成潮(海潮3×10⁻⁸m·s-2)、最大变幅为10×10-8m·s-2 的极移、气压导纳值为-0.348×10⁻⁸(m·s-2)/mbar的气压负荷和2.18×10-8(m·s-2)/a的仪器漂移改正后,GLDAS和GRACE 的重力效应和SGC053 的残差时间序列之间存在超过80%的相关性,这表明在2009 年夏秋雨季产生的(6~8)×10-8m·s-2的重力变化主要是由于水负荷产生的.再比较2009和2010年两次同时段非雨季的重力残差时间序列和GPS 垂直位移观测的结果,以及比较水负荷改正后重力残差和GPS垂直位移观测时间序列,都表明无论是短期还是长期都存在重力变化和垂直位移之间明显的负相关规律.从长期趋势来看两者关系反映出构造应力引起的武汉地区地壳下沉,重力增加(1.79×10⁻⁸(m·s-2)/a)的物理过程.其重力梯度约为-354(m·s-2)/m.
高精度连续重力观测、GPS和绝对重力测量相结合不仅可以精细地描绘连续重力观测整个时间跨度的重力演变过程,而且能够在短时间尺度和小区域内研究地壳运动和地球内部物质迁移关系的科学问题[28].
致谢感谢评审专家对本文提出的建议和大力支持.感谢国家重力台网中心的工作和研究人员提供的高精度的超导仪、绝对重力仪观测数据.感谢地壳运动观测网络提供的GPS垂直位移的观测结果.同时也感谢中国科学院测量地球物理研究所周江存博士在GRACE 数据分析上的帮助.
| [1] | 廖海华, 钟敏, 周旭华. 利用GRACE卫星重力资料解算气候驱动的地表周年垂直形变. 地球物理学报 , 2010, 53(5): 1091–1098. Liao H H, Zhong M, Zhou X H. Climate-driven annual vertical deformation of the solid Earth calculated from GRACE. Chinese J. Geophys. (in Chinese) , 2010, 53(5): 1091-1098. |
| [2] | 詹金刚, 王勇. 卫星重力捕捉龙滩水库储水量变化. 地球物理学报 , 2011, 54(5): 1187–1192. Zhan J G, Wang Y. Detect water storage variation of Longtan Reservoir with GRACE data. Chinese J. Geophys. (in Chinese) , 2011, 54(5): 1187-1192. |
| [3] | 周新, 孙文科, 付广裕. 重力卫星GRACE检测出2010年智利眠Mw8.8地震的同震重力变化. 地球物理学报 , 2011, 54(7): 1745–1749. Zhou X, Sun W K, Fu G Y. Gravity satellite GRACE detects coseismic gravity changes caused by 2010 Chile Mw8.8 earthquake. Chinese J. Geophys. (in Chinese) , 2011, 54(7): 1745-1749. |
| [4] | 申重阳, 李辉, 孙少安, 等. 重力场动态变化与汶川Ms8.0地震孕育过程. 地球物理学报 , 2009, 52(10): 2547–2557. Shen C Y, Li H, Sun S A, et al. Dynamic variations of gravity and the preparation process of the Wenchuan Ms8.0 earthquake. Chinese J. Geophys. (in Chinese) , 2009, 52(10): 2547-2557. |
| [5] | Sun W K, Wang Q, Li H, et al. Gravity and GPS measurements reveal mass loss beneath the Tibetan Plateau: Geodetic evidence of increasing crustal thickness. Geophys. Res. Lett. , 2009, 36: L02303. DOI:10.1029/2008GL036512 |
| [6] | Sato T, Miura S, Sun W K, et al. Gravity and uplift rates observed in Southeast Alaska and their comparison with GIA model predictions. J. Geophys. Res. , 2012, 117: B01401. DOI:10.1029/2011JB008485 |
| [7] | 孙和平, 许厚泽, 陈武, 等. 香港地区重力固体潮和海潮负荷特征研究. 地球物理学报 , 2006, 49(3): 724–734. Sun H P, Hsu H Z, Chen W, et al. Study of Earth’s gravity tide and oceanic loading characteristics in Hong Kong area. Chinese J. Geophys. (in Chinese) , 2006, 49(3): 724-734. DOI:10.1002/cjg2.v49.3 |
| [8] | 周江存, 孙和平. 海潮对卫星重力场恢复的影响. 地球物理学报 , 2007, 50(1): 115–121. Zhou J C, Sun H P. Effect of ocean tide on recovery of satellite gravity field. Chinese J. Geophys. (in Chinese) , 2007, 50(1): 115-121. |
| [9] | 孙和平, 崔小明, 徐建桥, 等. 超导重力技术在探讨核幔边界黏性特征中的初步应用. 地球物理学报 , 2009, 52(3): 637–645. Sun H P, Cui X M, Xu J Q, et al. Preliminary application of superconductive gravity technique on the investigation of viscosity at core-mantle boundary. Chinese J. Geophys. (in Chinese) , 2009, 52(3): 637-645. |
| [10] | 孙和平, 徐建桥, DucarmeB. 基于全球超导重力仪观测资料考虑液核近周日共振效应的固体潮实验模型. 科学通报 , 2003, 48(6): 610–614. Sun H P, Xu J Q, Ducarme B. Experimental earth tidal models in considering nearly diurnal free wobble of the Earth's liquid core. Chinese Science Bulletin (in Chinese) , 2003, 48(6): 610-614. |
| [11] | Sun H P, Takemoto S, Hsu H Z, et al. Precise tidal gravity recorded with superconducting gravimeters at stations Wuhan (China) and Kyoto (Japan). J. Geodesy , 2001, 74(10): 720-729. DOI:10.1007/s001900000139 |
| [12] | 孙和平, 徐建桥, DucarmeB. 基于国际超导重力仪观测资料检测地球固态内核的平动振荡. 科学通报 , 2004, 49(8): 803–813. Sun H P, Xu J Q, Ducarme B. Detection of the translational oscillation of the Earth's solid inner core based on the international SG observations. Chinese Science Bulletin (in Chinese) , 2004, 49(8): 803-813. |
| [13] | 孙和平, 郑大伟, 丁晓利, 等. 利用小波技术检测重力亚潮汐频段的特征信号. 科学通报 , 2006, 51(8): 958–965. Sun H P, Zheng D W, Ding X L, et al. Detection of the special gravity signals in sub-tidal band by using wavelet technique. Chinese Science Bulletin (in Chinese) , 2006, 51(8): 958-965. |
| [14] | Teferle F N, Bingley R M, Orliac E J, et al. Crustal motions in Great Britain: evidence from continuous GPS, absolute gravity and Holocene sea level data. Geophys. J. Int , 2009, 178(1): 23-46. DOI:10.1111/gji.2009.178.issue-1 |
| [15] | Richter B, Zerbini S, Matonti F, et al. Long-term crustal deformation monitored by gravity and space techniques at Medicina, Italy and Wettzell, Germany. J. Geodyn. , 2004, 38(3-5): 281-292. DOI:10.1016/j.jog.2004.07.013 |
| [16] | Francis O, Camp M V, van Dam T, et al. Indication of the uplift of the Ardenne in long-term gravity variations in Membach (Belgium). Geophys. J. Int. , 2004, 158(1): 346-352. DOI:10.1111/gji.2004.158.issue-1 |
| [17] | Crossley D, Hinderer J, Boy J P. Regional gravity variations in Europe from superconducting gravimeters. J. Geodyn. , 2004, 38(3-5): 325-342. DOI:10.1016/j.jog.2004.07.014 |
| [18] | Chen X D, Kroner C, Sun H P, et al. Determination of gravimetric parameters of the gravity pole tide using observations recorded with superconducting gravimeters. J. Geodyn. , 2009, 48(3-5): 348-353. DOI:10.1016/j.jog.2009.09.020 |
| [19] | Abdelgelil M, Pagiatakis S, Elrabbany A. Frequency-dependent atmospheric pressure admittance of superconducting gravimeter records using least squares response method. Phy. Earth Planet. Int. , 2008, 170(1-2): 24-33. DOI:10.1016/j.pepi.2008.06.031 |
| [20] | van Camp M, Francis O. Is the instrumental drift of superconducting gravimeters a linear or exponential function of time?. J. Geodesy , 2007, 81(5): 337-334. DOI:10.1007/s00190-006-0110-4 |
| [21] | van Camp M, Williams S D P, Francis O. Uncertainty of absolute gravity measurements. J. Geophys. Res. , 2005, 110: B05406. DOI:10.1029/2004JB003497 |
| [22] | van Camp M, Métivier L, de Viron O, et al. Characterizing long-time scale hydrological effects on gravity for improved distinction of tectonic signals. J. Geophys. Res. , 2010, 115: B07407. DOI:10.1029/2009JB006615 |
| [23] | Zerbini S, Raicich F, Richter B, et al. Hydrological signals in height and gravity in northeastern Italy inferred from principal components analysis. J. Geodyn. , 2010, 49(3-4): 190-204. DOI:10.1016/j.jog.2009.11.001 |
| [24] | Andersen O B, Seneviratne S I, Hinderer J, et al. GRACE-derived terrestrial water storage depletion associated with the 2003 European heat wave. Geophys. Res. Lett. , 2005, 32: L18405. DOI:10.1029/2005GL023574 |
| [25] | Weise A, Kroner C, Abe M, et al. Gravity field variations from superconducting gravimeters for GRACE validation. J. Geodyn. , 2009, 48(3-5): 325-330. DOI:10.1016/j.jog.2009.09.034 |
| [26] | 周江存, 孙和平, 徐建桥. 用地表和空间重力测量验证全球水储量变化模型. 科学通报 , 2009, 54(9): 1282–1289. Zhou J C, Sun H P, Xu J Q. Validating global hydrological models by ground and space gravimetry. Chinese Science Bulletin (in Chinese) , 2009, 54(9): 1282-1289. |
| [27] | 徐建桥, 周江存, 罗少聪, 等. 武汉台重力长期变化特征研究. 科学通报 , 2008, 53(5): 583–588. Xu J Q, Zhou J C, Luo S C, et al. Study on characteristics of long-term gravity changes at Wuhan station. Chinese Science Bulletin (in Chinese) , 2008, 53(5): 583-588. |
| [28] | 孙文科, 长谷川崇, 张新林, 等. 高斯滤波在处理GRACE数据中的模拟研究: 西藏拉萨的重力变化率. 中国科学: 地球科学 , 2011, 41(9): 1327–1333. Sun W K, Hasegawa T, Zhang X L, et al. Effects of Gaussian filter in processing GRACE data: Gravity rate of change at Lhasa, southern Tibet. Science China Earth Sciences (in Chinese) , 2011, 41(9): 1327-1333. |