2. 中国科学院空间天气学国家重点实验室, 北京 100190;
3. 中国地震局地震研究所, 武汉 430071;
4. 中国地震局地球物理研究所, 北京 100081
2. State Key Laboratory of Space Weather, Chinese Academy of Sciences, Beijing 100190, China;
3. Institute of Seismology, China Earthquake Administration, Wuhan 430071, China;
4. Institute of Geophysics, China Earthquake Administration, Beijing 100081, China
电离层等离子体主要由太阳极紫外(EUV)和X 射线辐射造成上层大气的中性成分电离产生.因此,电离层等离子体具有明显的日变化、27 天变化和太阳活动周期(11年)变化等[1-7].除了太阳活动对电离层的影响之外,一些化学过程(譬如等离子体的复合和电荷交换反应)和动力学过程(例如中性风输运、E×B漂移和沿着磁力线的扩散等)都会影响电离层等离子体的时空分布,从而造成电离层等离子体的一些特殊的分布和变化特征.例如赤道异常(EIA)、季节异常、半年异常和年异常等[8-15].同时,由于地磁场倾角的经度变化或一些局部空间区域特殊的等离子体扩散过程的影响,电离层等离子体还具有经度变化、威德尔海异常(WSA)和南大西洋地磁负异常(SAMA)区的变化[16-19].此外,一些来自地面的台风和火山活动等也会造成电离层等离子体的扰动[20, 21].
最近几年,一些研究者利用法国DEMETER 卫星观测到了一些发生在地震活动上空顶部电离层区域的等离子体和电磁场的扰动[22-26].然而,和其他非地震因素引起的扰动相比,地震活动是否真的能造成电离层扰动仍然是一个悬而未解的科学难题.因为在缺乏多点或多卫星的观测资料相比较的情况下,人们并不能真正区分电离层等离子体的空间分布和时间变化.以前判断电离层GPS-TEC 在地震事件中是否异常主要是采用中值法来计算参考背景值[27-29].本文利用法国DEMETER卫星在2004年11月17日至2005年11月30日期间在大约710km 高度的顶部电离层中观测到的电子密度和温度,通过对每个地理经纬度网格(纬度2°× 经度4°)内的电子数据进行统计平均,最终得到地磁宁静(Kp≤3,且Dst≥-30nT,且AE≤200nT)时期背景电子密度和温度的全球分布情况.另外,本文通过对地磁活动(Kp>3,或Dst<-30nT,或AE>200nT)期间电子密度和温度的统计平均得到了地磁活动期间顶部电离层电子的扰动分布.相关的统计结果将为分析不同地磁条件下顶部电离层电子密度或温度的扰动和地震活动的关系提供一种参考背景.
2 DEMETER 卫星等离子体数据和地磁指数法国DEMETER 卫星于2004 年6 月29 日发射到一个准太阳同步圆轨道上,轨道倾角98.23°,高度710km.夜间升轨(地方时LT=22.5h)的半周期时间约为34 min ,白天降轨(LT=10.5h)的半周期约为38 min.DEMETER 的轨道在2005 年12月后降低到大约660km 高度.其中Langmuir探针(ISL)和分段Langmuir探针(SLP)主要测量电离层等离子体(包括电子和离子)的密度和电子的温度[30].本文所用数据是ISL 探测器在2004年11月17日至2005年11月30 日探测到的4s平均的等离子体电子密度和温度数据.
地磁指数Kp、Dst和AE来自于NASACDAWeb的OMNI数据库.
3 统计方法和结果首先,为了消除地磁活动的影响,我们将2004年11月17日至2005年11月30日期间满足地磁宁静条件(Kp≤3,且Dst≥-30nT,且AE≤200nT)的电子数据筛选出来.其次,考虑到地球昼夜侧电离层受到光照强度的不同,磁宁静时期的电子密度和温度又按照昼侧和夜侧分两段进行统计处理.最后,为了消除电子密度和温度的季节或半年变化效应,我们把每个网格(纬度2°× 经度4°)里大约一年时间的等离子体参数进行统计平均,这样就得到了统计时间段内顶部电离层电子密度和温度的背景值.由于地球的自转运动,统计时间段内的DEMETER 卫星轨道几乎覆盖了所有的经纬度,所以我们最终得到了710km 高度顶部电离层电子密度和温度的全球分布情况.
3.1 顶部电离层背景电子密度和温度的昼夜侧分布不对称性在磁宁静条件下,每个网格内电子密度和温度的年平均值可以看作是消除半年/季节变化效应后的背景大小.由于卫星轨道高度为710km,在高纬度区域卫星可能进入等离子体层顶以外的区域.等离子体层顶位置的磁壳参量LPP(单位为地球半径RE,1RE=6371.2km)可以由经验公式[31]获得:

|
(1) |
这里,Kpmax 是Kp指数在前12 小时的最大值.当DEMETER 卫星轨道的L(对应地理纬度λ)值小于LPP(对应地理纬度λPP)时,卫星处于电离层/等离子体层区域(即λ≤λPP的区域),且等离子体层顶内的等离子体主要受到东向共转电场的控制.当DEMETER 卫星轨道的L值大于LPP时,卫星处于高纬电离层/磁层区域(即λ>λPP的区域),且等离子体层顶外的等离子体主要受到对流电场的影响.由于等离子体层顶的位置是个平均值,所以不同区域的划分是近似的.
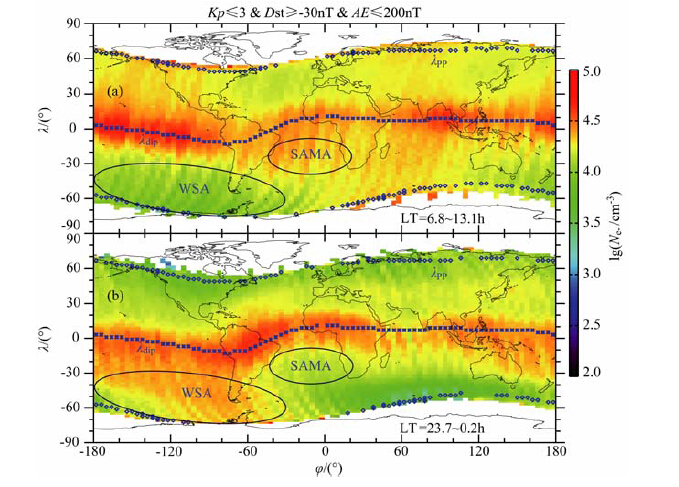
图 1是从2004 年11 月17 日至2005 年11 月30日大约一年时间内DEMETER 卫星在地磁宁静条件下探测到的不同区域电子密度的年平均值分布.在卫星的轨道高度(710km),电离层/等离子体层主要位于等离子体层顶内的中低纬度区域(λ≤λPP),而高纬电离层/磁层主要位于等离子体层顶外的高纬度区域(λ>λPP).不论是在白天(LT=6.8-13.1h)还是在夜间(LT=23.7-0.2h),710km 高度顶部电离层的电子密度在磁倾(dip)赤道(λdip)附近(约±20°内)存在一个峰值分布,最大的电子密度约为105 个/cm3.在40°W-25°E 的经度范围内,由于较大的地磁倾角的影响,电子密度的赤道峰值向北偏离的纬度较大.电子密度的赤道峰值分布说明“赤道异常"现象在710km 高度顶部电离层中已经消失.这和以前的理论研究结果是一致的,即“喷泉效应"形成的双峰结构只有在200-600km的高度比较明显,等离子体的“赤道异常"分布在700km 以上的顶部电离层中逐渐消失[32, 33].除了赤道峰值之外,电离层电子密度的昼夜侧分布是非常不对称的.首先,在西南半球的威德尔海及其以外较宽的区域(30°W-180°W 和30°S-75°S),电离层夜间的电子密度比白天的高出大约1个数量级,说明710km 高度顶部电离层也存在着显著的威德尔海异常(WSA)现象,且电离层的威德尔海异常(WSA)区位于等离子体层顶之内.和DMSP-F13卫星在850-870km 高度观测到的氧离子威德尔海异常区(30°W -150°W 和45°S-75°S)[18, 19]相比,710km 高度电子密度的威德尔海异常区域要宽得多.其次,与夜间威德尔海异常区和赤道附近的高电子密度相反,在夜间等离子体层顶附近的中纬度区域(35°N-60°N 和35°S-60°S),电子的密度显著降低,说明710km 高度的顶部电离层也存在着一个低密度中纬槽,这和DMSP-F13 卫星在850-870km高度观测到的氧离子的中纬槽相似[18, 19].最后,除了夜间东南半球的中纬槽(35°S-60°S)外,夜间南大西洋地磁负异常(SAMA)区域(10°S-40°S 和40°W-25°E)的电子密度也比周围的低.以前的研究认为地磁偏角对东向中性风引起的垂直漂移的调制可以给WSA 区域的增强和SAMA 区电子浓度的减小提供一个统一的解释[34, 35].从傍晚到子夜,中性风的东向风分量大.有效的东向风造成夜间正(东向)磁偏角的WSA 区域的等离子体垂直向上漂移,从而造成了该区域等离子体的密度增强.同时,有效的东向风也造成夜间负(西向)磁偏角的SAMA区域的等离子体垂直向下漂移,从而造成了SAMA区域等离子体的密度减小.然而,和夜间SAMA 区域低电子密度相反,白天SAMA 区域的电子密度和周围的大致一样甚至是较高的.因为在白天较小的东向中性风条件下,光电离过程和其他的动力学过程可能起主要作用.

|
图 1 从2004年11月17日到2005年11月30日的地磁宁静期间,DEMETER 卫星在昼侧(a)和夜侧(b)顶部电离层/等离子体层(即λ≤λPP的区域)和高纬电离层/磁层(即λ>λPP的区域)探测到的电子密度(Ne-)年平均值的全球分布正的地理纬度(λ)代表北半球(N),负的代表南半球(S);正的地理经度(φ)表示东半球(E),负的表示西半球(W).图中蓝色星号组成的曲线标出了不同经度上磁倾赤道的地理纬度(λdip),而蓝色菱形组成的曲线标出了不同经度上等离子体层顶的地理纬度(λPP).WSA 标出了广义的威德尔海异常区(蓝色椭圆),而SAMA 标出了南大西洋地磁负异常区(蓝色椭圆). Fig. 1 The global distribution of statistical average of electron density (Ne- ) measured by DEMETER in the daytime (a) and nighttime (b) topside ionosphere during the quiet times from 17 November 2004 to 30 November 2005 The geographic latitude (A) is positive in the northern hemisphere (N) and negative in the southern hemisphere (S). The geographic longitude (λ) is positive in the eastern hemsphere (E) and negative rn the western hemsphere (W). Here,the values of LT indicate the local tme range crossed by satellite,and the curves of blue asterisks display the geographic latitude of magnetic dip equators (Adip),and the curves of blue diamonds display the geographic latitude (λpp ) of plasmapause. The lett blue ellipse marks the general Weddell Sea Anomaly (WSA) region,and the right Mue eiipse marks the South Atlantic Magnetic Anomaly (SAMA) region. |
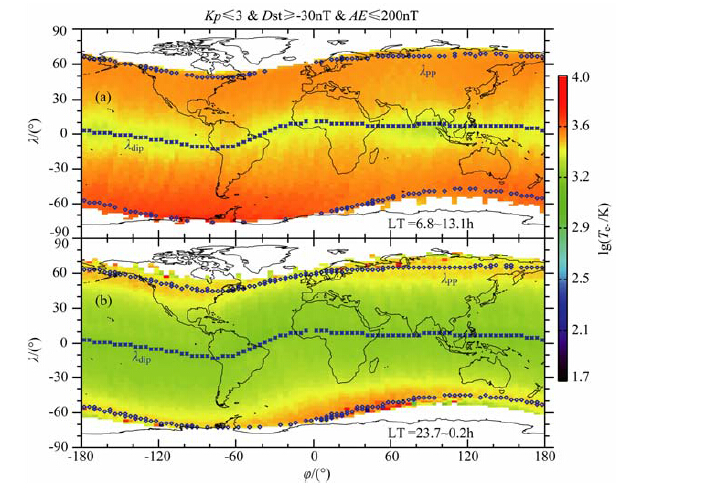
另外,白天和夜间顶部电离层的电子温度也是不一样的.图 2 给出了磁宁静时期昼侧(a)和夜侧(b)顶部电离层电子温度的年平均值分布.由于白天电离层受到充分的阳光照射,它的电子温度是明显地高于夜间的.和电子密度的赤道峰值分布相反,电子的温度在磁倾赤道(λdip)附近最小,而且随着纬度的增大,电子温度逐渐增大.受高纬磁层热等离子体的影响,电子温度在等离子体层顶(λPP)附近最大,约为103.6-104K.在等离子体层顶内的夜间电离层区域,电子的温度通常小于103.6K.

|
图 2 同图 1,但为电子温度(Te-)年平均值的全球分布 Fig. 2 Same as Fig.1,but for the global distribution of statistical average of electron temperature |
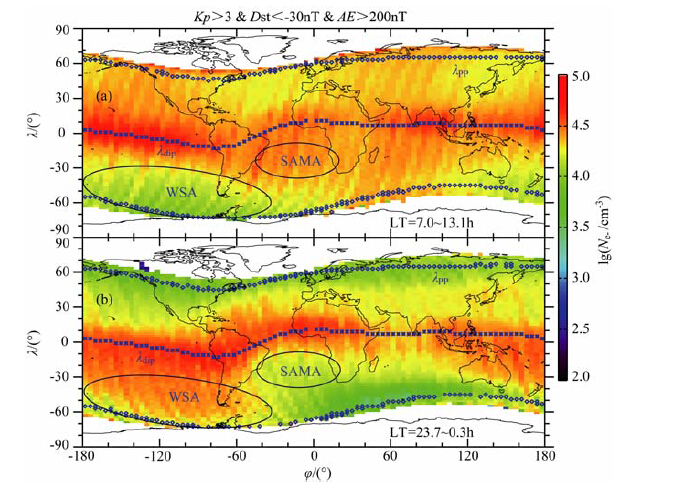
为了考察地磁活动对顶部电离层电子密度和温度的影响,我们将2004年11月17日至2005年11月30日期间满足地磁活动条件(Kp>3,或Dst<-30nT,或AE>200nT)的电子数据筛选出来,并按照地磁宁静期间的统计方法计算了地磁活动期间电子密度和温度的年平均值.图 3 给出了地磁活动期间昼侧(a)和夜侧(b)710km 高度顶部电离层/等离子体层和高纬电离层/磁层电子密度的年平均值分布.对比地磁宁静时期(图 1)和地磁活动期间(图 3)等离子体层顶的位置变化可知,当地磁活动增强时(Kp增大),等离子体层顶位置的纬度减小(λPP减小).地磁活动造成高纬电离层/磁层区域向低纬区域移动,同时也造成中低纬度电离层/等离子体层的纬度范围缩小.这是因为地磁活动期间增强的磁尾对流会造成等离子体层顶向着地球方向移动(即λPP减小),从而造成等离子体层的收缩和磁层的向内入侵[31, 36].
伴随着中低纬度电离层/等离子体层的纬度范围的缩小,地磁活动也改变了顶部电离层的中低纬度区域电子密度的大小.和磁宁静时期电子密度的年平均值(图 1所示)相比,昼夜侧顶部电离层的电子密度在地磁活动期间普遍地增大了(图 3所示).特别是在白天西南半球威德尔异常(WSA)区(30°W-180°W 和30°S-75°S)和夜间南大西洋地磁负异常(SAMA)区域(10°S-40°S 和40°W-25°E),电子密度的增加比较明显.而且,地磁活动还造成电子密度的赤道峰值向中纬区扩宽了,其中白天西南半球的赤道峰值的中纬扩展最明显.但是,地磁活动并没有明显地改变威德尔海异常区和夜间中纬槽的空间范围.另外,在地磁活动期间,顶部电离层的电子密度在夜间也存在一个显著的中纬槽(35°N-60°N 和35°S-60°S)分布.除了低密度中纬槽之外,夜间南大西洋地磁异常区域的电子密度也比周围的低.
综合不同地磁活动条件下的电子密度统计分布可知,电子密度的赤道峰值、威德尔海异常现象、夜间中纬槽和夜间南大西洋地磁负异常区的密度减小在不同地磁条件下都是显著存在的,说明这些分布是顶部电离层电子密度分布的常规特征.等离子体层顶的位置不仅是威德尔海异常区的高纬边界线,同时也是中纬槽的高纬边界线.当然,在磁暴/亚暴活动时,电离层局部区域的等离子密度扰动也是非常大的,譬如电离层的正/负电离层磁暴效应和赤道等离子体泡等.因此,电子密度的年平均值可以看作是不同季节电子密度扰动的参考背景.如果地震活动真的能够导致电离层等离子体的扰动,那么相对于地震电离层等离子体的扰动,在地磁活动情况下的每个网格内电子密度的年统计平均值也可以近似看作地磁扰动期间电离层电子的背景大小.
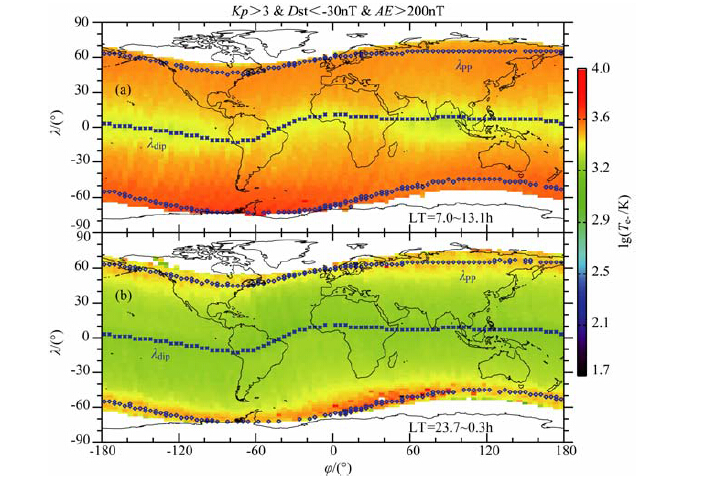
和电子密度的地磁活动变化相比,顶部电离层电子温度在地磁活动期间的变化并不明显.图 4 是地磁活动时期710km 高度顶部电离层电子温度在白天(a)和夜间(b)的年平均值分布.对比图 4 和图 2可知,地磁活动仅仅造成了夜间等离子体层顶附近的电子温度增大.在地磁活动期间,磁层环电流离子沿着磁力线输运到高纬电离层中,从而导致了等离子体层顶乃至顶部电离层等离子体温度的增加[37, 38].
4 结论和讨论本文对DEMETER 卫星从2004 年11 月7 日至2005年11月30日期间探测到的710km 高度顶部电离层的电子数据进行网格化统计平均.统计结果说明:
(1) 在地磁宁静时期,710km 高度顶部电离层的电子密度存在着一个巨大的威德尔海异常(夜间的密度比白天的高)区域(30°W-180°W 和30°S-75°S),电子密度在磁倾(dip)赤道附近最大,说明电离层的赤道异常在710km 高度的顶部消失.和密度分布相反,电子温度在磁倾赤道附近最小,在等离子体层顶附近最大.
(2) 地磁活动可以造成顶部电离层的电子密度的增加,并导致电子密度的赤道峰值向中纬区扩宽.但是,地磁活动并没有明显地改变威德尔海异常区和夜间中纬槽的空间范围.另外,地磁活动对电子温度的空间分布的影响并不明显,它仅仅造成了等离子体层顶附近高纬电离层/磁层区域的电子温度增大.
(3) 顶部电离层电子密度的中纬槽(低密度区)主要出现在夜间等离子体层顶附近的中高纬区域(35°N-60°N 和35°S-60°S).等离子体层顶的位置不仅是中纬槽的高纬边界线,同时也是威德尔海异常区的高纬边界线.除了夜间低密度中纬槽外,夜间南大西洋地磁负异常(SAMA)区域(10°S-40°S 和40°W-25°E)的电子密度也比周围的低.
电子密度的赤道峰值、威德尔海异常现象、夜间中纬槽和夜间南大西洋地磁负异常区的密度减小在不同地磁条件下都是显著存在的,说明这些分布是710km 高度顶部电离层电子密度分布的常规特征.这些特征可以为分析不同地磁条件下顶部电离层电子密度和温度的扰动和地震活动关系提供一种参考背景.然而,我们的统计结果仅仅给出了统计时间段内顶部电离层的电子分布情况,它们并不能反映出电离层的年变化和太阳周期变化特征.另外,在考虑地磁活动对顶部电离层空间分布的影响方面,我们的统计结果也不能区分磁暴和亚暴活动各自的效应.更细致的磁暴/亚暴活动引起顶部电离层电子的空间变化特征和相关的物理过程还有待于进一步详细研究揭示.由于年内变化在某些纬度可能较大,所以详细的地磁扰效果需要跟每个月或每一季度的统计量对比才能得到.
致谢衷心感谢法国DEMETER 卫星任务中心提供ISL 数据和美国CDAWebOMNI数据库的地磁指数.
| [1] | 熊年禄, 唐存琛, 李行健. 电离层物理概论. 武汉: 武汉大学出版社, 1999 . Xiong N L, Tang C C, Li X J. Introduction to Ionosphere Physics (in Chinese). Wuhan: Wuhan University Press, 1999 . |
| [2] | Rich F J, Sultan P J, Burke W J. The 27-day variations of plasma densities and temperatures in the topside ionosphere. J. Geophys. Res. , 2003, 108(A7): 1297. DOI:10.1029/2002JA009731 |
| [3] | Liu H X, Stolle C, F?rster M, et al. Solar activity dependence of the electron density in the equatorial anomaly regions observed by CHAMP. J. Geophys. Res. , 2007, 112: A11311. DOI:10.1029/2007JA012616 |
| [4] | Liu L B, Wan W X, Ning B Q, et al. Solar activity variations of the ionospheric peak electron density. J. Geophys. Res. , 2006, 111: A08304. DOI:10.1029/2006JA011598 |
| [5] | Liu L B, Wan W X, Yue X, et al. The dependence of plasma density in the topside ionosphere on the solar activity level. Ann. Geophys. , 2007, 25: 1337-1343. DOI:10.5194/angeo-25-1337-2007 |
| [6] | Chen Y, Liu L B, Le H. Solar activity variations of nighttime ionospheric peak electron density. J. Geophys. Res. , 2008, 113: A11306. DOI:10.1029/2008JA013114 |
| [7] | Zhang M L, Liu C, Wan W X, et al. A global model of the ionospheric F2 peak height based on EOF analysis. Ann. Geophys. , 2009, 27(8): 3203-3212. DOI:10.5194/angeo-27-3203-2009 |
| [8] | Anderson D N. A theoretical study of the ionospheric F-region equatorial anomaly, Ⅱ. Planet. Space. Sci. , 1973, 21(3): 421-442. DOI:10.1016/0032-0633(73)90041-X |
| [9] | Balan N, Bailey G J. Equatorial plasma fountain and its effects: Possibility of an additional layer. J. Geophys. Res. , 1995, 100(A11): 21421-21432. DOI:10.1029/95JA01555 |
| [10] | Zhang M L, Wan W X, Liu L B, et al. Variability study of the crest-to-trough TEC ratio of the equatorial ionization anomaly around 120°E longitude. Adv. Space. Res. , 2009, 43(44): 1762-1769. |
| [11] | Su S Y, Chen M Q, Chao C K, et al. Global, seasonal, and local time variations of ion density structure at the low-latitude ionosphere and their relationship to the postsunset equatorial irregularity occurrences. J. Geophys. Res. , 2010, 115: A02309. DOI:10.1029/2009JA014339 |
| [12] | Liu L B, Zhao B Q, Wan W X, et al. Yearly variations of global plasma densities in the topside ionosphere at middle and low latitudes. J. Geophys. Res. , 2007, 112: A07303. DOI:10.1029/2007JA012283 |
| [13] | Liu L B, Zhao B Q, Wan W X, et al. Seasonal variations of the ionospheric electron densities retrieved from Constellation Observing System for Meteorology, Ionosphere, and Climate mission radio occultation measurements. J. Geophys. Res. , 2009, 114: A02302. DOI:10.1029/2008JA013819 |
| [14] | Liu L B, Wan W X, Ning B Q, et al. Climatology of the mean total electron content derived from GPS global ionospheric maps. J. Geophys. Res. , 2009, 114: A06308. DOI:10.1029/2009JA014244 |
| [15] | Liu L B, He M S, Yue X A, et al. Ionosphere around equinoxes during low solar activity. J. Geophys. Res. , 2010, 115: A09307. DOI:10.1029/2010JA015318 |
| [16] | Ren Z P, Wan W X, Liu L B, et al. Influences of geomagnetic fields on longitudinal variations of vertical plasma drifts in the presunset equatorial topside ionosphere. J. Geophys. Res. , 2009, 114: A03305. DOI:10.1029/2008JA013675 |
| [17] | Wan W X, Liu L B, Pi X, et al. Wavenumber-4 patterns of the total electron content over the low latitude ionosphere. Geophys. Res. Lett. , 2008, 35: L12104. DOI:10.1029/2008GL033755 |
| [18] | Horvath I, Lovell B C. Investigating the relationships among the South Atlantic Magnetic Anomaly, southern nighttime midlatitude trough, and nighttime Weddell Sea Anomaly during southern summer. J. Geophys. Res. , 2009, 114: A02306. DOI:10.1029/2008JA013719 |
| [19] | Horvath I, Lovell B C. Investigating the southern daytime midlatitude trough's relation with the daytime Weddell Sea Anomaly during equinoxes. J. Geophys. Res. , 2010, 115: A01302. DOI:10.1029/2008JA014002 |
| [20] | Xiao Z, Xiao S G, Hao Y Q, et al. Morphological features of ionospheric response to typhoon. J. Geophys. Res. , 2007, 112: A04304. DOI:10.1029/2006JA011671 |
| [21] | Xiao S G, Xiao Z, Shi J K, et al. Observational facts in revealing a close relation between acoustic-gravity waves and midlatitude spread F. J. Geophys. Res. , 2009, 114: A01303. DOI:10.1029/2008JA013747 |
| [22] | Parrot M, Berthelier J J, Lebreton J P, et al. Examples of unusual ionospheric observations made by the DEMETER satellite over seismic regions. Physics and Chemistry of the Earth , 2006, 31: 486-495. DOI:10.1016/j.pce.2006.02.011 |
| [23] | Zhang X M, Shen X H, Liu J Y, et al. Analysis of ionospheric plasma perturbations before Wenchuan earthquake. Nat. Hazards Earth Syst. Sci. , 2009, 9(4): 1259-1266. DOI:10.5194/nhess-9-1259-2009 |
| [24] | Zhang X M, Qian J D, Ouyang X Y, et al. Ionospheric electromagnetic perturbations observed on DEMETER satellite before Chile M7.9 earthquake. Earthq. Sci. , 2009, 22(3): 251-2555. DOI:10.1007/s11589-009-0251-7 |
| [25] | Bankov L G, Parrot M, Heelis R A, et al. DEMETER and DMSP satellite observations of the disturbed H+ /O+ ratio caused by Earth's seismic activity in the Sumatra area during December 2004. Advances in Space Research , 2010, 46(4): 419-430. DOI:10.1016/j.asr.2009.07.032 |
| [26] | Akhoondzadeh M, Parrot M, Saradjian M R. Electron and ion density variations before strong earthquakes (M > 6.0) using DEMETER and GPS data. Nat. Hazards Earth Syst. Sci. , 2010, 10: 7-8. DOI:10.5194/nhess-10-7-2010 |
| [27] | Liu J Y, Chen Y I, Chuo Y J, et al. A statistical investigation of preearthquake ionospheric anomaly. J. Geophys. Res. , 2006, 111: A05304. DOI:10.1029/2005JA011333 |
| [28] | Liu J Y, Chen Y I, Chen C H, et al. Seismoionospheric GPS total electron content anomalies observed before the 12 May 2008 Mw7.9 Wenchuan earthquake. J. Geophys. Res. , 2009, 114: A04320. DOI:10.1029/2008JA013698 |
| [29] | Liu J Y, Chen Y I, Chen C H, et al. Temporal and spatial precursors in the ionospheric global positioning system (GPS) total electron content observed before the 26 December 2004 M9.3 Sumatra-Andaman Earthquake. J. Geophys. Res. , 2010, 115: A09312. DOI:10.1029/2010JA015313 |
| [30] | Lebreton J P, Stverak S, Travnicek P, et al. The ISL Langmuir probe experiment processing onboard DEMETER: Scientific objectives, description and first results. Planetary and Space Science , 2006, 54(5): 472-486. DOI:10.1016/j.pss.2005.10.017 |
| [31] | Carpenter D L, Anderson R R. An ISEE/whistler model of equatorial electron density in the magnetosphere. J. Geophys. Res. , 1992, 97(A2): 1097-1108. DOI:10.1029/91JA01548 |
| [32] | Balan N, Shiokawa J K, Otsuka Y, et al. A physical mechanism of positive ionospheric storms at low latitudes and midlatitudes. J. Geophys. Res. , 2010, 115: A02304. DOI:10.1029/2009JA014515 |
| [33] | Chen Y D, Liu L B, Wan W X, et al. Solar activity dependence of the topside ionosphere at low latitudes. J. Geophys. Res. , 2009, 114: A08306. DOI:10.1029/2008JA013957 |
| [34] | He M S, Liu L B, Wan W X, et al. A study of the Weddell Sea Anomaly observed by FORMOSAT-3/COSMIC. J. Geophys. Res. , 2009, 114: A12309. DOI:10.1029/2009JA014175 |
| [35] | He M S, Liu L B, Wan W X, et al. A study on the nighttime midlatitude ionospheric trough. J. Geophys. Res. , 2011, 116: A05315. DOI:10.1029/2010JA016252 |
| [36] | Li L Y, Cao J B, Zhou G C, et al. Statistical roles of storms and substorms in changing the entire outer zone relativistic electron population. J. Geophys. Res. , 2009, 114: A12214. DOI:10.1029/2009JA014333 |
| [37] | Prolss G W. Subauroral electron temperature enhancement in the nighttime ionosphere. Ann. Geophys. , 2006, 24(7): 1871-1885. DOI:10.5194/angeo-24-1871-2006 |
| [38] | Prolss G W. The equatorward wall of the subauroral trough in the afternoon/evening sector. Ann. Geophys. , 2007, 25(3): 645-659. DOI:10.5194/angeo-25-645-2007 |
 2011, Vol. 54


