2. 韩国公州大学, 公州, 忠南, 韩国;
3. 韩国极地研究所, 仁川, 韩国;
4. 中国科学院地质与地球物理研究所, 北京 100029
2. Kongju National University, Kongju, Chungnam, Korea;
3. Korea Polar Research Institute, Incheon, Korea;
4. Institute of Geology and Geophysics, Chinese Academy of Sciences, Beijing 100029, China
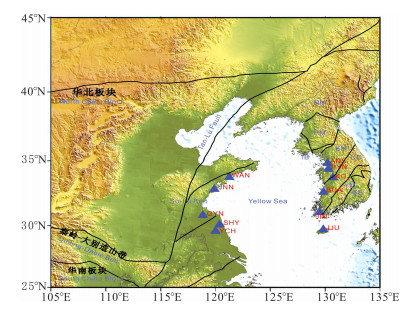
秦岭一大别造山带是华北板块(North China block,NCB)和华南板块(South China block,SCB)的碰撞缝合带,并在中生代时期就形成了现在的构造格局(图 1).在中国东部,碰撞带被郯庐断裂错开约540 km,继续向东延伸直至被黄海覆盖[1].黄海东侧的朝鲜半岛由若干前寒武地块组成(Nangrim,Kyonggi,andYongnam地块),并被褶皱断层所分隔(Imjingang构造带和Okchon褶皱带).关于东北亚构造演化存在一些研究成果,最新的研究表明,朝鲜半岛Imjingang构造带代表了早三叠纪华北板块和华南板块的碰撞带;這后,侏罗纪沿Okchon褶皱带形成碰撞带,构成朝鲜半岛主要大地格局[2]; 同时一些研究者提出,形成于早古生代的Okchon褶皱带是华南构造带的延伸[3].尽管尚存争议,还有一种假设认为:华北板块和华南板块之间的碰撞带应该起始于华南板块东北部向华北板块东部挤入的凹部,并形成左旋的郯庐断裂和Okchon褶皱带上右旋Honam剪切带[1].基于蛇绿岩和超髙压变质岩的分析,Ishiwatari和Tsujimori[4]认为华北板块和华南板块的边界可能没有延伸到朝鲜半岛,而是在黄海内部转而向南延伸.最近的层析成像结果也支持在南黄海和朝鲜半岛之间存在南北向走滑的深大断裂(黄海东部断裂带)[5, 6].如上所述,关于朝鲜半岛构造演化的假设大都集中于华北板块和华南板块之间缝合带,尽管没有来自黄海内部的直接证据,但其无疑成为这些观点争议的核心内容.
|
图 1 东北亚地区的构造简图 蓝色三角表示黄海流动地震台站的位置.NM:Nangrim地块;PM:Pyungnam地块;IB:Imjingang构造带;KM:Kyeonggi地块;OB:Okchon构造带;YM:Youngnam地块. Fig. 1 Simplified tectonic map of the northeast Asia Locations of broadband seismic stations installed by the Yellow Sea Broadband Seismic Network are shown by blue triangles. Major tectonic structures are denoted:NM:Nangrim Massif; PM:Pyungnam Massif; IB:Imjingang Belt; KM:Kyeonggi Massif; OB:Okcheon belt; YM:Youngnam Massif. |
为了探索黄海地区构造演化长期悬而未决的科学问题,中韩两国科研人员在黄海周边布设了11台宽频带流动地震仪,通过记录远震波形数据并利用接收函数方法反演了台站下方地壳上地幔的速度结构,展示了黄海地区中韩国际合作研究的初步结果.
2 方法和数据作为获取地壳上地幔S波速度结构的常规方法[7~11],接收函数包括了径向和垂向分量的反褶积,通过消除径向分量的P波多次波,从而获得接收函数[12].对大量远震事件中提取的接收函数进行叠加,以提高信噪比并生成反映台站下方速度结构的接收函数.假设台站下方符合水平层状模型,则可以利用接收函数反演台站下方的一维S波速度结构;对于具有倾斜界面的结构来说,可以跟踪接收函数随方位的变化,需要仔细挑选数据和确定叠加范围.本文中所使用的接收函数方法可以参考已有文献[13, 14].
该项合作计划的研究团队由地球物理、构造地质和海洋学的不同学科的学者组成,包括中国科学院地质与地球物理研究所、广州海洋地质调查局、韩国公州大学、韩国海洋研究与发展研究所.宽频带流动地震台阵YSBSN (Yellow SeaBroadbandSeismic Network)于2007年下半年建立(图 1),由11台宽频带地震仪组成,每个台站配置Guralp 3ESP地震计和RefTek130采集器,时间服务采用GPS授时服务.中方一侧的台站使用40 sps的采样率,3~4个月收集一次数据并进行仪器维护;韩方一侧的台站则采用实时数据传输并提交到KORDI进行地震数据分析.
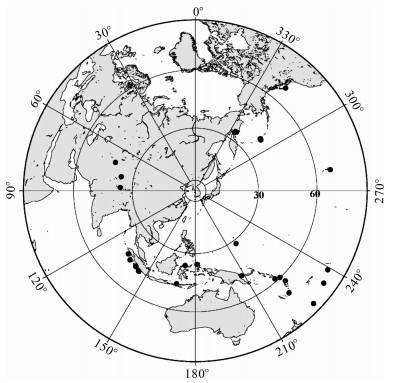
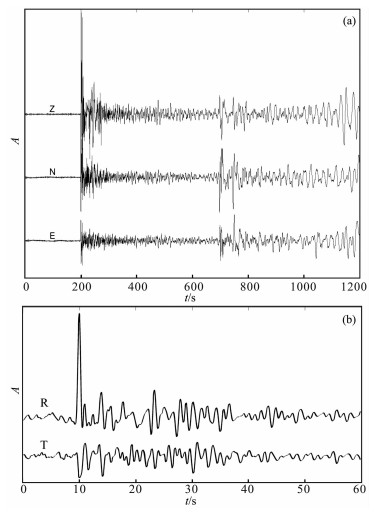
数据挑选采用以下原则(图 2)震中距位于30°和90°之间,高信噪比,震级大于6.5的地震事件; 震源参数(震中、深度和震级)取自美国国家地震信息中心和美国地质调查局.图 3给出了韩国公州大学KOJ台记录的一个远震波形,该地震位于震中距为63°的南太平洋;图 3b给出了一个太平洋深震的接收函数实例.
|
图 2 用于接收函数分析的27个远震分布(黑色圆点,震中距在30°~90°之间、震级大于6.5) Fig. 2 Event locations (solid circles) used in the receiver function analysis in the study.The 27 events used in the present study were selected based on consideration of epicentral distance (30° < Δ < 90°), magnitude ( > 6.5), and high signal-to-noise ratio |
|
图 3 KOJ台的远震波形和相应的接收函数 (a)三分量地震波形,地震位于南太平洋,震源深度为110 km,震级为6.9级;(b)径向和切向接收函数. Fig. 3 A typica l3-component teleseismic broadband record for a intermediate deep (110 km) event with magnitude 6.9 in the South Pacific region recorded at Kongju station (KOJ).(b) Radial (R) and transverse (T) receiver functions after the deconvolution process. |
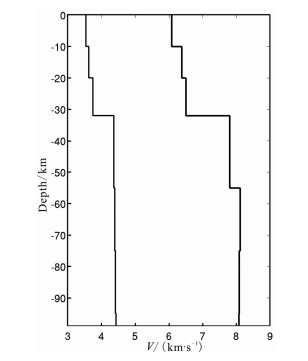
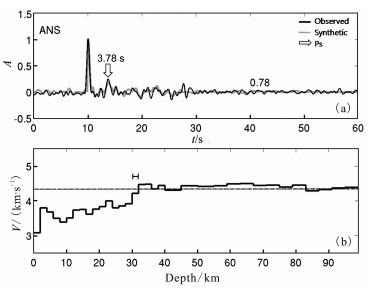
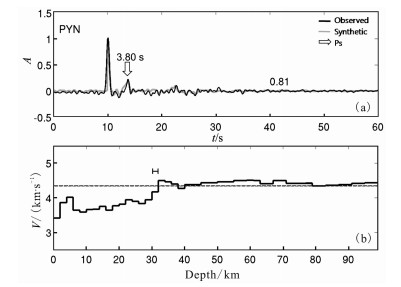
在约一年多的时间内,11个台站中共有8个台站取得了较多的高质量数据.ANS台和PYN台均位于朝鲜半岛中部的前寒武纪Gyeonggi地块之上(图 1),其中Gyeonggi地块地震活动较弱.为了提高信噪比,对ANS台记录的4个远震的径向接收函数分量进行了叠加,以便获取具有代表性的接收函数波形(图 4),叠加前后的接收函数在P波初至后的3.7 s均有有明显来自莫霍面的Ps转换波.反演初始速度模型参考了IASPEI91[15]模型,并对120 km深度以上的部分进行了修改,以适应研究区域的实际结构(图 5),这一速度模型也是韩国地球科学和矿产资源研究所(KIGAM)用于地震定位的速度模型[16].反演后ANS台站下方2~4 km深度上出现高速层,地壳内部S波速度随深度逐渐增加,30~32 km深度上出现相对尖锐的壳幔转换界面(图 6),PYN台站径向分量的接收函数由6个远震事件叠加而成,其结果与ANS台十分接近:即在30~32 km深度出现相对尖锐的壳幔转换界面(图 7),同样观察到地壳浅部的高速层,并且地壳内部的速度随深度逐步增加.

|
图 4 ANS台4个径向分量接收函数的叠加结果 P波初至之后的3.7 s出现Ps转换波震相. Fig. 4 Radial component receiver functions from 4 teleseismic earthquakes recorded at station ANS and a representative receiver function obtained by stacking Note consistent arrival of Ps at 3.7 second after the initial P wave arrival. |
|
图 5 一维初始速度模型 Fig. 5 Initial velocity model for 1-D velocity inversion |
|
图 6 ANS台的接收函数和S波速度结构 (a)接收函数,P波初至后3.78 s出现莫霍面Ps转换震相;(b) S波速度分布,莫霍面出现在30~32 km深度. Fig. 6 Observed and synthetic receiver function for station ANS (a) P-to-S converted phase from the Moho discontinuity arrives at 3.78 second after the onset on both traces; (b) Inversion result for ANS reveals the crust-mantle transition occurs at 30~32 km depth beneath the station. |
|
图 7 PYN台的接收函数和S波速度结构 (a)接收函数,P波初至后3.80 s出现莫霍面Ps转换震相;(b) S波速度分布,莫霍面出现在30~32 km深度. Fig. 7 Observed and synthetic receiver function for station PYN (a) P-to-S converted phase from the Moho discontinuity arrives at 3.80 second after the onset. (b) Inversion resutt for PYN reveals the crust-mantle transition occurs at 30~32 km depth beneath the station. |
KOJ (Kongju)台位于Gyeonggi地块和Okchon褶皱带的边界位置,对4个事件的接收函数进行了叠加,速度结构显示在32~34 km深度出现了相对尖锐的壳幔转换界面(图 8).

|
图 8 KOJ台的接收函数和S波速度结构 (a)接收函数,P波初至后4.03 s出现莫霍面Ps转换震相;(b)S波速度分布,莫霍面出现在32~34 km深度. Fig. 8 Observed and synthetic receiver function for station KOJ (a) P-to-S converted phase from the Moho discontinuity arrives at 4.03 second after the onset; (b) Inversion result for KOJ reveals the crust-mantle transition occurs at 32~34 km depth beneath the station. |
BUA和JIN台站均位于Okchon褶皱带,Okchon褶皱带主要由变质沉积岩或变质火山岩组成[17],分隔了南部的Yeongnam地块和北部的Gyeonggi地块(图 1).通过对5个事件的接收函数进行叠加,得到了BUA台站下方叠加后的接收函数(图 9).在台站下方34~36 km深度观察到了尖锐的壳幔边界,并推断地壳浅表层2~8 km深度有相对较厚的高速层.JIN台下方5个事件的接收函数的叠加结果表明,莫霍面位于34~36 km深度(图 10),但是没有观察到高速层的存在.

|
图 9 BUA的接收函数和S波速度结构 (a)接收函数,P波初至后4.05 s出现莫霍面Ps转换震相;(b)S波速度分布,莫霍面出现在34~36 km深度. Fig. 9 Observed and synthetic receiver function for station BUA (a) P-to-S converted phase from the Moho discontinuity arrives at 4.05 second after the onset; (b) Inversion result for BUA reveals the crust-mantle transition occurs at 34~36 km depth beneath the station |

|
图 10 JIN台的接收函数和S波速度结构 (a)接收函数,P波初至后4.25 s出现莫霍面Ps转换震相;(b)S波速度分布,莫霍面出现在34~36 km深度. Fig. 10 Observed and synthetic receiver function for station JIN (a) P-to-S converted phase from the Moho discontinuity arrives at 4.25 second after the onset; (b) Inversion result for JIN reveals the crust-mantle transition occurs at 34~36 km depth beneath thes tation. |
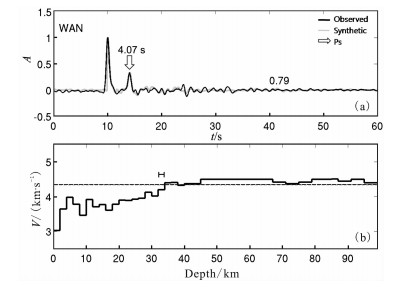
WAN和JNN台站均位于华北板块和华南板块碰撞带-苏鲁造山带上,分布有超高压变质岩.对WAN台9个事件的接收函数进行了叠加,在上地壳观察到了较高的S波速度.莫霍面深度分布在32~34 km深度(图 11).对JNN台3个事件的接收函数进行了叠加,莫霍面位于34~38 km深度,是所有台站中最深的(图 12),同时在50~58 km深度观察到了S波低速异常.
|
图 11 WAN台的接收函数和S波速度结构 (a)接收函数,P波初至后4.07 s出现莫霍面Ps转换震相;(b)S波速度分布,莫霍面出现在32~34 km深度. Fig. 11 Observed and synthetic receiver function for station WAN (a) P-to-S converted phase from the Moho discontinuity arrives at 4.07 second after the onset; (b) Inversion result for WAN reveals the crust-mantle transition occurs at 32~34 km depth beneath the station |

|
图 12 JNN台的接收函数和S波速度结构 (a)接收函数,P波初至后4.43 s出现莫霍面Ps转换震相;(b)S波速度分布,莫霍面出现在34~38 km深度. Fig. 12 Observed and synthetic receiver function for station JNN (a) P-to-S converted phase from the Moho discontinuity arrives at 4.43 second after the onset; (b) Inversion result for JNN reveals the crust-mantle transition occurs at 34~38 km depth beneath the station |
GYN台位于华南板块和苏鲁造山带的边界附近,对15个事件的接收函数进行了叠加,从反演得到的速度结构看,莫霍面位于30~32 km深度(图 13).

|
图 13 GYN台的接收函数和反演的S波速度结构 (a)接收函数,P波初至后3.78 s出现莫霍面Ps转换震相;(b)S波速度分布,莫霍面出现在32~34 km深度. Fig. 13 Observed and synthetic receiver function for station GYN (a) P-to-S converted phase from the Moho discontinuity arrives at 3.78 second after the onset; (b) Inversion result for GYN reveals the crust-mantle transition occurs at 30~32 km depth beneath the station. |
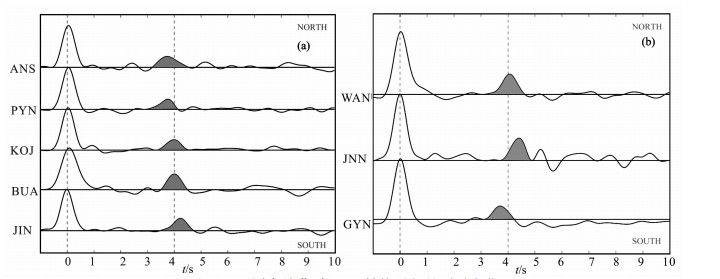
黄海周边地区地壳厚度存在横向变化,莫霍面Ps转换震相的到时延迟表明地壳厚度自北向南逐渐增加(图 14a).例如,位于韩国最北部ANS和PYN台的Ps转换波震相延迟为3.73 s,最南端JIN台站转换震相的到时为4.25 s,比北部延迟了0.52 s,估计JIN台下方的莫霍面要比ANS台深3.5~4 km.反演后的速度结构也表明地壳厚度自北向南逐渐增加:根据ANS和PYN台估算的Gyeonggi地块的莫霍面深度为30~32 km,KOJ台下方的莫霍面深度为32 km; 向南至Okchon褶皱带,BUA和JIN台下方的莫霍面约为32~34 km.最深的莫霍面出现在中方一侧JNN台站附近,地壳厚度自北向南逐渐减薄(图 14b),表明苏鲁造山带在华北板块和华南板块的碰撞作用下发生地壳增厚.
|
图 14 不同台站莫霍面Ps转换震相的到时变化 (a)韩方一侧;(b)中方一侧. Fig. 14 Variation of Ps (P-to-S converted phase at Moho) arrival times on radial component receiver function at different stations (a) in Korea and (b) in China.These Ps phases provide strong constraints on the depths and velocity contrasts of the crust-mantle discontinuity |
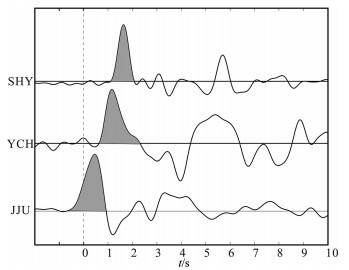
中方SHY和YCH台径向分量的接收函数分别在1.62 s和1.15 s出现P波初至延迟(图 15).这些台站位于巨厚的沉积盆地,上地壳S波低速层(对应于高的泊松比)可能是造成P波初至延迟的原因.在JJU台观测到了0.45 s的P波延迟(图 15),估计是多孔的火山岩不利于S波的传播是造成JJU台P波延迟的原因.
|
图 15 三个台站的P波初至延迟时间(由于地壳浅表层较高的高泊松比,P波初至在SHY台延迟了约1.62 s) Fig. 15 Phase lags of P onset on the radial component receiver functions. Phase lags as large as 1.62 seconds (SHY) are observed due to high Poisson's ratios of the thin upper layer |
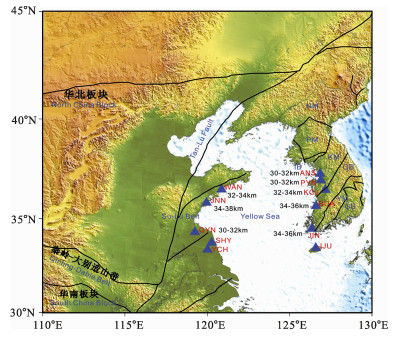
尽管黄海周边流动地震观测的时间有限,通过接收函数反演的S波速度结构仍然揭示出莫霍面的横向变化(图 16).总体上黄海东西两侧的莫霍面深度在30~38 km深度之间,JNN台下方较厚的地壳与苏鲁造山带的超高压变质作用有关,反映出华北板块和华南板块的碰撞边界特征.虽然有些观点认为朝鲜半岛Imjingang断裂带是该碰撞带的向东延伸,也有观点认为苏鲁一大别缝合带在朝鲜半岛一侧的黄海内部转折向南延伸,由于这些地域已经超出了黄海周边流动地震观测的范围,从本文的研究结果还难以做出判断,尚需要开展更为广泛的地震学研究提供相应的证据.
|
图 16 黄海周边流动台站下方的莫霍面深度分布 Fig. 16 Estimated depths of the crust-mantle transition layers (theMoho) beneath the stations of the Yellow Sea Broadband Seismic Network |
感谢刘启元研究员提供了接收函数的处理程序.
| [1] | Yin A, Nie S. An Indentation Model for the North and South China Collision Tan-Lu and Honam Fault Systems, Eastern Asia. Tectonics , 1993, 12(4): 801-813. DOI:10.1029/93TC00313 |
| [2] | Ree J H, Cho M, Kwon S T, et al. Possible eastward extension of Chinese collision belt in South Korea: The Imjingang belt. Geology , 1996, 24(12): 1071-1074. DOI:10.1130/0091-7613(1996)024<1071:PEEOCC>2.3.CO;2 |
| [3] | Chang E Z. Collisional orogene between north and south China and its eatern extension in the Korean Peninsula. Journal of Southeast Asian Earth Sciences , 1996, 13(3-5): 267-277. DOI:10.1016/0743-9547(96)00033-5 |
| [4] | Ishiwatari A, Tsujimori T. Paleozoic ophiolites and blueschists in Japan and Russian Primorye in the tectonic framework of East Asia: A synthesis. The Island Arc , 2003, 12: 190-206. DOI:10.1046/j.1440-1738.2003.00390.x |
| [5] | 郝天珧, 徐亚, 胥颐, 等. 对黄海一东海研究区深部结构的一些新认识. 地球物理学报 , 2006, 49(2): 405–416. Hao T, Xu Y, Xu Y, et al. Some new understandings on the deep structure in Yellow Sea and east China Sea. Chinese J.Geophys. (in Chinese) , 2006, 49(2): 405-416. DOI:10.1002/cjg2.v49.2 |
| [6] | 胥颐, 李志伟, KimK H, 等. 黄海的地壳速度结构与中朝一扬子块体拼合边界. 地球物理学报 , 2009, 52(3): 646–652. Xu Y, Li Z, Kim K H, et al. Crustal velocity structure and collision boundary between the Sino-Korea and Yangtze blocks in the Yellow Sea. Chinese J.Geophys (in Chinese) , 2009, 52(3): 646-652. |
| [7] | Langston C A. Structure under mount Rainier, Washington, inferred from teleseismic body waves. Journal of Geophysical Research , 1979, 83(B9): 4749-4762. |
| [8] | Cassidy J F. Numerical experiments in broadband receiver function analysis. Bulletin-Seismological Society of America , 1992, 82(3): 1453-1474. |
| [9] | Randall G E. Efficient calculation of differential seismograms for lithospheric receiver functions. Geophysical Journal International , 1989, 99: 469-481. DOI:10.1111/gji.1989.99.issue-3 |
| [10] | 刘启元, KindR, 李顺成. 中国数字地震台网的接收函数及其非线性反演. 地球物理学报 , 1998, 40(3): 373–385. Liu Q Y, Kind R, Li S C. Receiver function at the stations of the Chinese digital seismic network (CDSN) and their nonlinear inversion. Chinese J.Geophys (in Chinese) , 1998, 40(3): 373-385. |
| [11] | Owens T J, Taylor S R, Zandt. Crustal structure at Regional Seismic Test Network stations determined from inversion of broadband teleseismic P waveforms. Bulletin-Seismological Society of America , 1987, 77(2): 631-662. |
| [12] | Ammon C J. The isolation of reciever effects from teleseismic P waveforms. Bulletin-Seismological Society of America , 1991, 81: 2504-2510. |
| [13] | 刘启元, KindR, 李顺成. 接收函数复谱比的最大或然性估计及非线性反演. 地球物理学报 , 1996, 39: 531–543. Liu Q Y, Kind R, Li S C. Maximal like lihood estimation and nonlinear inversion of the complex receiver function spectrum ratio. Chinese J.Geophys (in Chinese) , 1996, 39: 531-543. |
| [14] | Kim K H, Chiu J M, Kao H, et al. A Preliminary Study of Crustal Structure in Taiwan Region Using Receiver Function Analysis. Geophysical Journal International , 2004, 159: 146-164. DOI:10.1111/gji.2004.159.issue-1 |
| [15] | Kennett B L N, Engdahl E R. Traveltimes for global earthquake location and phase identification. Geophysical Journal International , 1991, 105: 429-465. DOI:10.1111/gji.1991.105.issue-2 |
| [16] | Park J H. Crustal Velocity Structure of the Southern Korean Peninsula Using 3-D Seismic Tomography, in School of Earth and Environmental Sciences. 2006, Seoul: Seoul National University, 154 |
| [17] | Chough S K, Kwon S T, Ree J H, et al. Tectonic and sedimentary evolution of the Korean peninsula: a review and new view. Earth-Science Reviews , 2000, 52: 175-235. DOI:10.1016/S0012-8252(00)00029-5 |
| [18] | Sheehan A F, Abers G A, Jones C H, et al. Crustal thickness variations across the Colorado Rocky Mountains from teleseismic receiver functions. Journal of Geophysical Research , 1995, 100(B10): 20391-20404. DOI:10.1029/95JB01966 |
| [19] | Zelt B C, Ellis R M. Receiver-function studies in the TransHudson Orogen, Saskatchewan. Canadian Journal of Earth Sciences , 1999, 36: 585-603. DOI:10.1139/e98-109 |
 2010, Vol. 53


