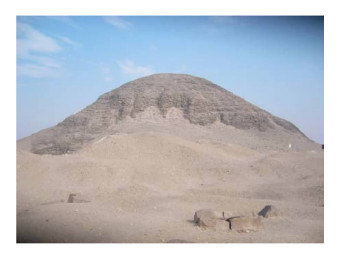
Hawara is an archaeological site of Ancient Egypt lies at the southeastern entrance of El Fayoum depression (Fig. 1). Hawara pyramid (Fig. 2) was bul by Amenemhat Ⅲ, the last powerful ruler of the 12 Dynasty. It is made up of mud brick round a core of limestone passages and burial chambers, and faced with limestone. Most of the facing stone was later pillaged for use in other buildings. Today, the pyramid is little more than an eroded, vaguely pyramidal mountain of mud brick. In 1888, William Flinders Petrie conducted excavations at Hawara area and found papyri of the first and second centuries. To the north of the pyramid, he found a vast necropolis includes 146 portraits on coffins back to the Roman period. The huge mortuary temple that originally stood adjacent to the southern side of this pyramid is believed to have formed the bases of a complex of buildings with galleries and courtyards called “labyrinth” by Herodotus. This archeological area is invaded by some agricultural activities in addition to Bahr Wahba (Wahba Canal), which splits the area into two eastern and western parts (Fig. 3). The surface and underground water bodies have a negative effect on the foundation of Hawara pyramid and the labyrinth site, where the water has been observed at about 6 meters below the ground surface at the southern entrance of the pyramid.

|
Fig. 1 Location map of the study area showing distribution of the TEM and GEM data stations |
|
Fig. 2 Hawara pyramid |

|
Fig. 3 View of Hawara pyramid and Wahba canal which splits the area into two parts |
This study has been conducted to detect the subsurface water level, identify the feeding sources of the underground water, as well as, investigate the effects of these water bodies on the archeological targets at Hawara area by TEM and GEM surveys.
2 Methodology 2.1 Transient Electromagnetic (TEM) soundingThe TEM method is well suited for mapping the depth and conductivity of highly conductive materials in the subsurface. It was originally developed for mapping mineral deposits in the 1960s and 1970s (e. g. Spies and Frischknecht, 1991[1]; Fountain, 1998[2]). Since the 1980s, the development of new instrumentation and interpretation methods has further refined the TEM method and allowed for the mapping of groundwater reservoirs in clastic sediments (e. g. Fitte-rman and Stewart, 1986[3]; Mills et al., 1988[4]; McNeill, 1990[5], Meju et al., 1999[6]). Numerous hydrogeological-geophysical studies have shown that the TEM method is well suited for resolving the coarse grained resistivity structure of the upper 100~300 m of the subsurface, depending on the configuration and specifications of the employed equipment as well as the resistivity behavior of the subsurface (Danielsen et al., 2003[7]; Sørensen and Auken, 2004[8]; Nielsen et al., 2006[9]; Cosentino et al., 2007[10]).
TEM technique is an inductive method utilizes a strong direct current passed through a square loop commonly laid on the ground surface. The flow of this current in the surface loop will create a primary magnetic field spreads out into the ground. When the applied current is abruptly terminated, the primary magnetic tield starts to decay with time. According to Faraday’s law, the decay of the primary magnetic Held with time will induce eddy currents that flow outward and downward in the subsurface conductors. The rate of change of these currents and of their respective secondary magnetic field depends on the size, shape and conductivity of the subsurface conductors. In this work, the TEM data were measured by SIROTEM MK3 instrument (Buselii and O’Neill, 1977[11]), which detects the underground conducting materials by transmitting electrical pulses along loops of cables laid outon the ground surface.
2.2 Ground Electro Magnetic (GEM) profilingThe fundamental principle of a frequency-domain electromagnetic induction system involves the measurement of the change in mutual impedance/inductance between a pair of coils moving over the earth's surface. The transmitter coll (Tx) generates a sinusoidally varying primary field, which induces the low of a system of currents within the earth below. This induced current, in turn, generates a secondary magnetic field that is measured by a receiver coll (Rx). When two coils are maximally coupled, the magnitude of the primary field generated by the Tx coil, as sensed by the receiver, is very large compared to the magnitude of the secondary field generated by induced current low in the ground. This secondary field is difficult to measure in the presence of the large source field. To overcome this problem, the used instrument (GEM-300) utilizes a secondary receiver or ”bucking coll (Bx)” to remove the source field inlluence at the Rx coil. The Bx coll is configured so that its induced voltage from the primary field in the absence of the earth (i. e., in free space) is equal to that induced in the Rx coil. The Bx and Rx coils are wired in opposing (bucking) polarity. This effectively cancels out the primary field generated by the Tx coll and thus, the sensor unit produces a zero output in free space.
The secondary feld detected by the sensor splits into in-phase and quadrature components which are expressed in ppm (partspermillion) against the primary field strength that would have been induced in an un-bucked receiver coil. The inphase refers to the part of the received signal that is in-phase with the Tx signal. Quadrature refers to the part of the signal that s 90° out of phase with the Tx signal. The in-phase response will be large when the target is a metal conductor and, hence, is referred to as the metal detector mode. The quadrature phase response will be large for non-metallic conductors and, therefore, referred to as the conductivity mode.
GEM-300 instrument utilized in the present study is adjusted to simultaneously measure and calculate the electrical conductivity of the subsurface medium at six frequency values ranging from 330 to 20000 Hz with fixed coils separation. By acquiring multiple frequencies, the frequency (ies) which provide the best results for a specific application can be selected. Both in-phase and quadrature electromagnetic components are recorded. Output is the mutual secondary/primary magnetic fields coupling ratio (Q) inparts/million (ppm) or apparent conductivity in mS/m. This tool is advantageous in our case due to the high sensitivity of the electromagnetic waves to the water. These waves are greatly attenuated when penetrated into wet soils. So, It is used as a good detector for the subsurface water level.
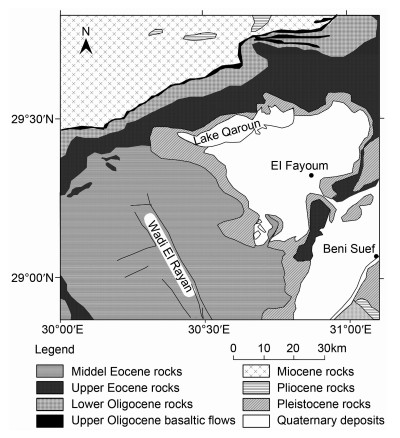
3 Geological SettingThe geological setting of El-Fayoum area has been studied by many authors (e. g. Said, 1962[12]; Tamer, 1968[13]; Swedan, 1986[14]). El-Fayoum province consists of four main depressions, the Nile Valley, El-Fayoum, Hawara and El-Rayan depressions surrounded by a Hmestone plateau of Eocene Age. Fig. 4 shows the diferent rock units exposed at El-Fayoum region, which are ranging from Eocene to Quaternary Ages. In the study area, the subsurface stratigraphic column is capped by the Quaternary sediments that are widely distributed over the entire area of El-Fayoum province and composed of variable grain-sized sand and gravel intercalated with silt and clay. These deposits are directly overly the thick and extensive Eocene limestone deposits.
|
Fig. 4 Geologic map of El-Fayoum area (modified after Swedan,1986[14]) |
El-Fayoum depression has been impacted by a large number of structural features (faults and tectonic subsidence) that are prominent at the edges of the depression. These structural trends are observed in the E-W, ENE-WSW, NNW-SSE and NW-SE direction, of which the NW-SE is the most dominant trend in El-Fayoum province (Swedan, 1986[14] and Conoco, 1987[15]).
4 Data AcquisitionThe TEM data were measured by SIROTEM MK3 instrument applying the coincident loop configuration with a loop side length of 25 m around the pyramid and at the labyrinth site, while a loop side length of 50 m was used at the cultivated area. The data have been recorded in the high resolution and composite modes through 30 time gates. The TEM data were recorded at 74 stations distributed throughout three sites in the studied area. As shown in Fig. 1, the first site comprises 9 stations (circles) arranged in a gridlike pattern in the cultivated land, east of the labyrinth with 100~150 meters inter-stations spacing to be used for regional survey. The second site comprises 47 stations (squares) arranged, much close to each other, along two profiles (P1 and P2) run parallel to the northern and southern sides of the pyramid, respectively. The third site includes 18 measuring stations (triangles) arranged along three profiles (P3, P4, P5) in the labyrinth. Also, the measuring stations in this site were distributed along the profiles very close to each other to give a more accurate description of the subsurface features.
The GEM data were measured at the labyrinth site to the south of the pyramid. An area of 100 m × 150 m was surveyed by the electromagnetic profiler. The electrical conductivity data in mS/m could be simultaneously obtained at six frequency values (19950, 8790, 3870, 1710, 750 and 330 Hz), which were selected to show the conductivity distribution at successivedepth levels in the subsurface medium. As well known, there is a reverse relation between the frequency of electro-magnetic waves and its depth of penetration, where the low frequency is corresponding to the greater depth of penetration. Consequently, the maximum depth of investigation could be attained by using 330 Hz frequency value taking into account the conductivity of the sub-soil that also controls the depth of penetration. The field survey has begun by outlining the site boundaries (100 m × 150 m). Then, the site was surveyed along parallel lines, 2 meters apart, in a Zig-Zag line mode, while the distance between the successive measuring points along the line was selected to be 2 meters also.
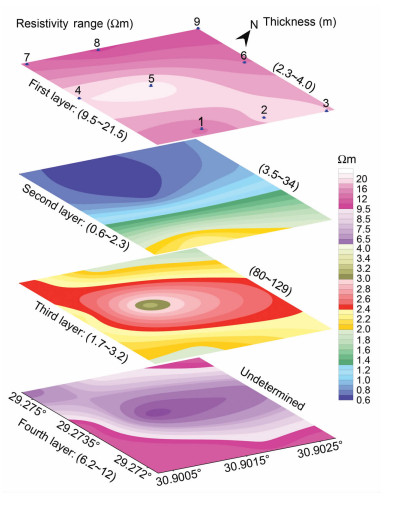
5 Data Analysis 5.1 TKM data inversionTEM data were inverted in 1-D scheme using TEMIX XL 4 (2002[16]) program, assuming layered-earth models. The observed data have fit the model responses in rms within 4%. Selected examples of the TEM sounding curves and the corresponding models are shown in Fig. 5. The best-fitted models have been used for preparation of four resistivity distribution maps (Fig. 6) at the cultivated land and construction of five geoelectrical cross-sections along five profiles (P1 to P5 shown in Fig. 1). These cross-sections have been shown in Figs.(7 to 11).

|
Fig. 5 Sounding curves and the corresponding models obtained from the TEM data inversion at (a) station no.6(profile P1) and (b) station no.2(profile P5) |
|
Fig. 6 Resistivity distribution maps as obtained from the TEM data inversion at the cultivated land site |
|
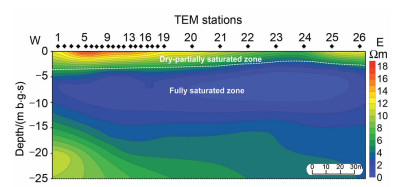
Fig. 7 Geoelectrical cross-section constructed along profile P1 to the north of the pyramid |
|
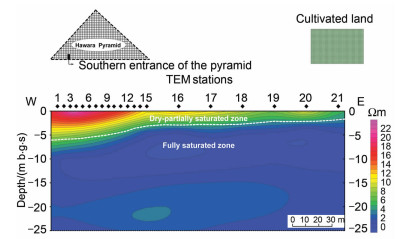
Fig. 8 Geoelectrical cross-section constructed along profile P2 to the south of the pyramid |
|
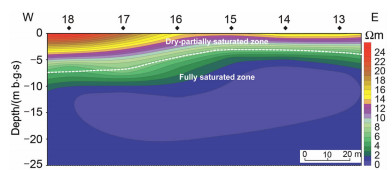
Fig. 9 Geoelectrical cross-section constructed along profile P3 at the labyrinth site |
|
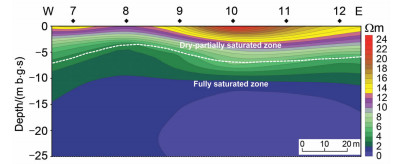
Fig. 10 Geoelectrical cross-section constructed along profile P4 at the labyrinth site |
|
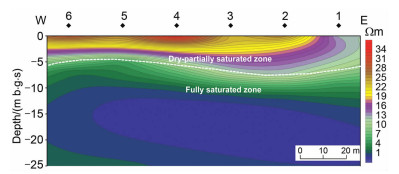
Fig. 11 Geoelectrical cross-section constructed along profile P5 at the labyrinth site |
Inspection of the maps (Fig. 6) indicates that four geoelectrical units could be identified in the subsurface medium at this area by the applied data acquisition parameters. The subsurface section is capped by a thin (2.3~4.0 m) layer composed of variable sizes of sand and gravel with intercalations of silt and clay deposits of Quaternary age with relatively higher resistivity values ranginK from 9.5 to 21.5 Ωm. The.subsurface water level could be indicated by indicated the lower boundary of the surface layer. So, the water level might be detected at depths ranging from 2.3 to 4.0 meters below the ground surface (m b. g. s) at the cultivated land. This surface layer is followed by two (second and third) conductive units composed of sandy clay deposits. The second unit is thicker than the surface layer and exhibits resistivity values ranging from 0.6 to 2.3 Ωm and thickness values varying from 3.5 to 34 m. The third unit can be considered as an extension to the second one, where it shows similar resistivity values ranging from 1.7 to 3.2 Ωm and thickness values varying from 80 to 129 m. The marked low resistivity values shown by the composite (second and third units) layer might be attributed to increasing of water saturation and clay content, where this layer represents the main groundwater aquifer of Quaternary age in El Fayoum area (Massoud et al., 2009[17]). The investigated section s ended by a relatively resistive layer composed of fractured limestone with high water content, the Eocene aquifer (Hamza, 1999[18]).
5.1.2 Geoelectrical cross-sectionsAs shown in Fig. 1, the TEM profile (P1) was taken at the desert area to the north of the pyramid. The cross-section obtained along this profile shows a similar conductivity behavior along the whole profile as shown in Fig. 7. It suggests a dry to partially saturated surface layer extended to 3~4 m depth, followed by a fully saturated zone. So, the water level, shown by the white dashed line, could be inferred at a depth of 3~4 m b. g. s along this profile.
The TEM profile (P2), shown in Fig. 8, was measured to the south of the pyramid. It started at the southern entrance of the pyramid and extended eastward to cover the nearby part of the cultivated land. Screening of the subsurface water level (lower boundary of the surface layer) along this profile reveals that the water level (white dashed line) could be inferred at about 2 m depth at the cultivated land, and at about 6 m depth at the entrance of the pyramid.
The TEM profiles (P3, P4 and P5), measured in the labyrinth site on the front of the southern side of the pyramid (Figs. 9, 10, 11), exhibit the water level (the lower boundary of the surface layer expressed by the white dashed lines) at a depth of about 4~7 meters according to the surface elevation at the measuring stations.
The results of TEM study indicate that the source of underground water is the flooding irrigation system applied in the surrounding cultivated land. The irrigation water is to percolate into the subsurface and moves both downward and westward to invade the subsurface medium at the pyramid and the labyrinth site. So. the water level has been detected at a shallow depth at the recharge area (cultivated land), and deepen at the discharge area (the pyramid and the labyrinth) that is greatly correlated with the water level flooded at the pyramid entrance.
5.2 GKM dataThe in-phasc and quadrature data derived through the convolution arc converted into a part-per-million (ppm) unit defined as:

|
(1) |
Apparent conductivity can be measured and linearly related to the quadrature phase ppm valuer through the equation:σ=360×ppm (Q)/f(GKM-300.19988[19]). where, σ is the conductivity in mS/ m. ppm (Q) is the quadrature phase reading and f is the frequency in Hz.
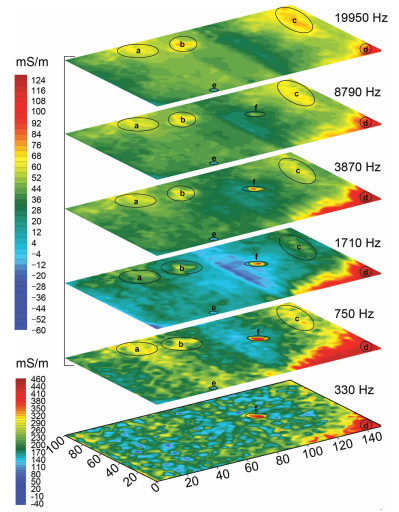
It worth to mention here that apparent conductivities obtained by this technique are not directly measured by the instrument. But rather, the instrument measures the ratio of the secondary magnetic field at the receiver to the primary magnetic field at the transmitter in ppm. This ratio, which may be positive or negative, was transformed to the corresponding conductivity value by using the ECq. (1). So, the transformed conductivity values may be obtained in positive or negative values. In most shallow geophysical surveys, the ppm data or the corresponding conductivity values, in the form of a contour map for each frequency, are sufficient to locate buried objects without going through elaborate processing or interpretation. One can also estimate the target depth from the data obtained at multiple frequencies by using a specific nomogram provider a relative comparison of skin depths for a given host material at different frequencies (Won. 1980[20]). In this study, six contour maps (Fig. 12) have been prepared at six frequency values showing the conductivity distribution at six depth levels. Investigation of these maps reveals the following features.
|
Fig. 12 Apparent conductivity distribution maps at six frequency (depth) values at the labyrinth site as obtained from the GEM survey |
The maps obtained at frequencies 19950, 8790, 3870, 1710 Hz show similar conductivity behavior with identical convened conductivity values ranging from -60 to +124 mS/m. Also, these maps exhibit a number of well resolved high conductivity anomalies (a, b, c and d) which may be related to clay bodies, as well as, low conductivity anomaly (e), which may be attributed to near surface limestone or granite rock body. Besides, another high conductivity anomaly (f) has been firstly appeared at frequency 8790 Hz and increased in intensity with depth.
At frequency 750 Hz. although the fore-mentioned high and low conductivity anomalies were Mill observed, a general increase in the conductivity allover the area could he noticed. The conductivity increasing at this frequency (depth) might be attributed 10 the first arrival of the subsurface water.
At the last frequency (330 Hz) that corresponds to maximum depth of intimation, we can notice a sudden increase in the conductivity valuer (-40 to +460 mS/m). Also, the obtained high and low anomalies are noisy, scattered in the area and failed to form a definite geometrical features that could be attributed to the negative effect of the water table. The depth of the water level as estimated from the conductivity-frequency nomogram is ranging from 5 to 7 meters below the ground surface according lo the surface elevation.
6 ConclusionThe combined application of the TEM and GEM surveys is an effective approach for investigation of the subsurface water bodies. This is based on the fact that, the electrical conductivity is greatly affected by the pore fluids rather than conductivity of the rock particles itself. On the other hand, the GEM waves are largely died out in the water-saturated media.
The TEM-GEM surveys have succeeded to identify the subsurface lithologic units and to detect the subsurface water level at Hawara archeological site and its surroundings. The water level could be detected at about 2~4 m below the ground surface at the cultivated land, about3~4 m along profile P1 (north of the pyramid), 2~6 m along profile P2 (south of the pyramid), and 4~7 m in the labyrinth site according to the surface elevation.
The man source for the subsurface water invades this area is the Hooding irrigation system applied in the surrounding cultivated land.
The area is experienced an entire threaten from the underground water invasion, which has been observed in the form of friable loose soil under the pyramid, general instability of the pyramid structure, and damage effect on the remaining walls of the labyrinth. So, dewatering plan must be performed to survive the area from the underground water leakage. This can be carried out by modifying the flooding irrigation to dropping or spraying irrigation system in the nearby planted area, and installing a dewatering system around the site.
| [1] | Spies B R, Frischknecht F C.Electromagnetic sounding.In:Nabighian M N ed.Electromagnetic Methods in Applied Geophysics, Vol.2.Society of Exploration Geophy-sicists, 1991 Spies B R, Frischknecht F C.Electromagnetic sounding.In:Nabighian M N ed.Electromagnetic Methods in Applied Geophysics, Vol.2.Society of Exploration Geophy-sicists, 1991 |
| [2] | Fountain D. Airborne electromagnetic system-50 years of development. Exploration Geophysics, 1998, 29: 1-11. DOI:10.1071/EG998001 |
| [3] | Fitterman D V, Stewart M T. Transient electromagnetic sounding for groundwater. Geophysics, 1986, 51: 995-1005. DOI:10.1190/1.1442158 |
| [4] | Mills T, Hoekstra P, Blohm M, et al. Time-domain electromagnetic soundings for mapping sea-water intrusion in Monterey County, California. Ground Water, 1988, 26: 771-782. DOI:10.1111/gwat.1988.26.issue-6 |
| [5] | McNeill J D.Use of electromagnetic methods for groundwater studies.In:Ward S H ed.Geotechnical and Environmental Geophysics, Vol.2.Society of Exploration Geophysicists, 1990.191-218 McNeill J D.Use of electromagnetic methods for groundwater studies.In:Ward S H ed.Geotechnical and Environmental Geophysics, Vol.2.Society of Exploration Geophysicists, 1990.191-218 |
| [6] | Meju M A, Fontes S L, Oliveira M F, et al. Regional aquifer mapping using combined VES-TEM-AMT/EMAP methods in the semi arid eastern margin of Parnaiba Basin, Brazil. Geophysics, 1999, 64(2): 337-356. DOI:10.1190/1.1444539 |
| [7] | Danielsen J E, Auken E, Jørgensen F. The application of TEM in hydrogeophysical surveys. Journal of Applied Geophysics, 2003, 53: 181-198. DOI:10.1016/j.jappgeo.2003.08.004 |
| [8] | Sørensen K I, Auken E. SkyTEM-A new high-resolution helicopter transient electromagnetic system. Exploration Geophysics, 2004, 35: 191-199. |
| [9] | Nielsen L, Jorgensen N, Gelting P. Mapping of the freshwater lens in a coastal aquifer on the Keta Barrier (Ghana) by transient electromagnetic soundings. J.Appl.Geophys., 2006, 62: 1-15. DOI:10.1016/j.jappgeo.2006.07.002 |
| [10] | Cosentino P, Capizzi P, Fiandaca G, et al.Study and monitoring of salt water intrusion in the coastal area between Mazara del Vallo and Marsala (South-Western Sicily).In:Rossi G, Vega T, Bonaccorso B eds.Methods and Tools for Drought Analysis and Management.Series:Water Science and Technology Library.Springer, Dordrecht.ISBN, 2007.978-1-4020-5923-0 Cosentino P, Capizzi P, Fiandaca G, et al.Study and monitoring of salt water intrusion in the coastal area between Mazara del Vallo and Marsala (South-Western Sicily).In:Rossi G, Vega T, Bonaccorso B eds.Methods and Tools for Drought Analysis and Management.Series:Water Science and Technology Library.Springer, Dordrecht.ISBN, 2007.978-1-4020-5923-0 |
| [11] | Buselli G, O'Neill B. SIROTEM:a new portable instrument for multichannel transient electromagnetic measurements. Bull.Austral.Soc.Expl.Geophys., 1977, 8: 82-87. DOI:10.1071/EG977082 |
| [12] | Said R. The Geology of Egypt. Amsterdam and New York: Elsevier Publishing Company, 1962. |
| [13] | Tamer A.Subsurface geology of the Fayoum region[M.Sc.thesis].Fac.of Science, Alexandria Univ.Egypt, 1968 Tamer A.Subsurface geology of the Fayoum region[M.Sc.thesis].Fac.of Science, Alexandria Univ.Egypt, 1968 |
| [14] | Swedan A H.Contributions to the geology of El-Fayoum area[Ph.D.thesis].Fac.of Science, Cairo Univ., Egypt, 1986 Swedan A H.Contributions to the geology of El-Fayoum area[Ph.D.thesis].Fac.of Science, Cairo Univ., Egypt, 1986 |
| [15] | Conoco C.Geological map of Egypt.Scale 1:500000, 1987 Conoco C.Geological map of Egypt.Scale 1:500000, 1987 |
| [16] | TEMIX XL 4.Temix xl V.4 User's Manual.Interpex.Colorado, USA, 2002.468 TEMIX XL 4.Temix xl V.4 User's Manual.Interpex.Colorado, USA, 2002.468 |
| [17] | Massoud U, El Qady G, Metwaly M, et al. Delineation of shallow subsurface structure by azimuthal resistivity sounding and joint inversion of VESTEM data:case study near lake qaroun, El Fayoum, Egypt. Pure Appl.Geophys., 2009, 166: 701-719. DOI:10.1007/s00024-009-0463-8 |
| [18] | Hamza U H M.Shallow geophysical studies near El Fayoum city[M.Sc.thesis].Fac.Sci., Suez Canal Univ., Ismailia, Egypt, 1999 Hamza U H M.Shallow geophysical studies near El Fayoum city[M.Sc.thesis].Fac.Sci., Suez Canal Univ., Ismailia, Egypt, 1999 |
| [19] | GEM-300.GEM-300 Ver.1.10 Multi-frequency Electroma-gnetic Profiler User's Manual.Geophysical Survey Systems Inc.(GSSI), 1998.79 GEM-300.GEM-300 Ver.1.10 Multi-frequency Electroma-gnetic Profiler User's Manual.Geophysical Survey Systems Inc.(GSSI), 1998.79 |
| [20] | Won I J. A wideband electromagnetic exploration method-Some theoretical and experimental results. Geophysics, 1980, 45: 928-940. DOI:10.1190/1.1441097 |
 2010, Vol. 53


