 2010, Vol. 53


2. Institute of Seismology, China Earthquake Administration, Wuhan 430071, China
2. 中国地震局地震研究所, 武汉 430071
Earthquake-induced precursory signals are always a topic discussed by scientists. Conventional seismic monitoring techniques along with knowledge of earthquake-associated signals had widely utilized to disclose an association between anomalous geophysical phenomena and earthquakes. However, due to the complexity of earthquake preparation process, identifying the real earthquake precursors from numerous and complicated geophysical signals is still a challenging problem.
Many reports have presented the possible associations between anomalous electromagnetic emissions in a broad frequency range (DC-VHF) and earthquakes[1~13]. The generation of seismo-electromagnetic emissions has been verified by the experim ents[14~21]. In the recent 40 years, the ionospheric disturbances possibly associated with seismic activity have also increasingly attracted attention of geophysicists. Since the Great Alaska Earthquake in 1964, the anomalies of the Vertical Total Electron Content (VTEC) or the peak electron density NmF2 a few days before strong earthquakes have extensively been reportedE[22~36]. In these seismo-ionospheric anomalies reported, the VTEC or NmF2 around the epicenters showed anomalous enhancement or decrease several days before earthquakes. In identifying the disturbance source of ionospheric anomalies, some scholars gave valuable reference information, which provide the possibility for validating the seismo-ionospheric signals[31, 32, 37~41]. Besides, many theoretical and experimental studies have been made, and some possible physical mechanisms of seismo-ionospheric effects have also been put forward. Among these possible physical mechanisms, the enhanced lithosphere-·atmosphere-ionosphere (LAI) coupling and acoustic gravity waves (AGW) generation in earthquake preparation zone are the most popular interpretations of seismo-ionospheric effects[32, 42~51].
In this paper, we will use GPS technique to examine the ionospheric variations during the Ms8. 0 Wenchuan earthquake (epicenter: 31. 0° N, 103.4° E) which occurred at 06: 28UT (14 : 28LT) on 12 May 2008. in Sichuan province, China. As one kind of ionospheric sounding technique with high efficiency and low cost. GPS has been widely used in space weather research. Owing to the utilization of two ultra high frequency waves. the VTEC derived from GPS measurements is a feasible parameter in investigating the seismo-ionospheric disturbances. Moreover, the increasing number of ground-based GPS receivers provides the possi-bility of simultaneously, continuously and precisely monitoring the variations of ionospheric VTEC[52~54]. Therefore, if the pre-earthquake ionospheric anomalies do exist. GPS VTEC technique should have the ability to detect them.
In the following parts. we will introduce the procedure to derive GPS VTEC and examine the ionospheric VTEC variations during Wenchuan earthquake. Further, the features of the pre-earthquake ionospheric anomalies are analyzed and the sources probably related with the ionospheric anomalies are also discussed.
2 Observation and method for identifying ionospheric anomaliesTotal Electron Content (TEC) is an important ionospheric parameter for space weather research and defined as the line integral of electron density along the propagation path of the radio waves from satellite to ground receiver. Since sionosphere is a dispersive medium, we can derive the TEC from the geometry-free linear combination of phase-smoothed pseudo-range P1/P2[55, 56]:

|
(1) |
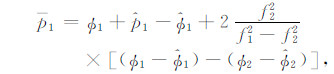
|
(2) |
|
(3) |
where ϕi(i=1, 2) is the carrier phase measurement after gross error is eliminated and cycle slip is repaired, and 
Seen from the above, the derivation of TEC from phase-smoothed pseudo range is rather simple. However, the TEC contains the differen-tial instrumental biases introduced by GPS satellite and receiver. Therefore, the estimation of the differential instrumental biases is vital in calcula-ting precisely the real TEC. In order to estimate the instrumental biases, a single-layer ionospheric model (VTEC model) in a sun-fixed coordinate system is usually introduced[56].So, the TEC from formula (1) may be written as:

|
(4) |
where 
Due to the comparability of daily variations in the ionosphere, if there are not sudden changes in the solar-terrestrial environment, the VTEC over a given point could not generate large day-to-day variations in a short period. So, under the assumption of a norma]distribution for the VTEC, we computed the mean value of the previous 10-day VTECs and the associated standard deviation σ to construct the upper bound u+2σ and the lower bound u-2σ. During the process of identifying ionospheric anomalies, the upper/lower bounds form the normal reference threshold. If an observed VTEC in the following day goes beyond either the associated lower or upper bound, we declare that a negative or positive ionospheric anomaly is detected.
3 Analysis and InterpretationIn this part, using continuous GPS stations the observations 0f 25 in China (Fig. 1), we examined the variations of ionospheric VTEC during W enchuan earthquake. The sampling rate of each GPS receiver is 30 seconds. The unit of VTEC is TECu (1TECu=10 16electrons/m2) in the present paper.

|
Fig. 1 The distribution of the GPS stations (black hollow triangles). The black pentacle denotes the epicenter of Wenchuan earthquake |
In view of the strong influence of solar and geomagnetic activities on the ionosphere, the solar-terrestrial environment should be taken into account in identifying the disturbance source of ionospheric anomalies. Fig. 2 presents the variations of solar F10. 7 flux and geomagnetic activity indices (Kp, Dst) during the earthquake. One can see that the solar activity was rather quiet within 18 days before the earthquake, while a series of geomagnetic disturbances and three weak geomagnetic storms (Kp≥4) were recorded from April 24 to May 6, 2008. After May 7, the geomagnetic activity was low and rather quiet (Kp≤2, Dst≥-20 nT).

|
Fig. 2 From April 24 to May 17, 2008 (UT) : (a) The solar F10. 7 flux; (b) The geomagnetic Kp index; (c) The geomagnetic equatorial Dst index. The vertical dashed line indicates the tme of Wenchuan earthquake. |
Using the method mentioned above, we computed the time series of ionospheric VTECs over LUZH GPS station which is the nearest one to the epicenter of Wenchuan earthquake. Fig. 3 demonstrates the statistical analysis results of VTEC variations during Wenchuan earthquake. Seen from Fig. 3, the VTEC showed the negative or positive anomalies 13, 9, 6 and 3 days before Wenchuan earthquake. Especially on May 9, namely 3 days before Wenchuan earthquake, the positive anomalies are the most remarkable. Moreover, two positive anomalies were detected on May 3, 2008.

|
Fig. 3 The tme series of VTEC over LUZH GPS station from April 25 to May 14, 2008 (UT). The red/blue and black curves represent the upper / lower bounds and observed VTEC, respectively. The black arrows point to the anomalies. The little black circle dot points out the time of Wenchuan earthquake |
In order to display these anomalies of VTEC more roundly and clearly, taking the corresponding upper or lower bound as a reference, we created the di ferential two-dimensional VTEC (ΔVTEC) maps around the epicenter in the periods of ionospheric VTEC anomalies. Fig. 4, 5, 6, 7 and 8 describe the distributions of ΔVTEC 13, 9, 6 and 3 days before Wenchuan earthquake, respectively. Here, ΔVTEC stands for the absolute magnitude with which the observed VTEC goes beyond the upper or lower bound. ΔVTEC < 0 stands for the negative anomalies. ΔVTEC=0 implies that the observed VTEC just lies between the upper bound and lower bound. ΔVTEC > 0 stands for the positive anomalies.

|
Fig. 4 The ΔVTEC distribution around the epicenter of Wenchuan earthquake at: (a)06:00UT; (b)07:00UT; (c)08:00UT; (d)09:00UT; (e)10:00UT on April29, 2008.The black pentacle represents the epicenter |

|
Fig. 5 The ΔVTEC distribution around the epicenter of Wenchuan earthquake at: (a) 03 : 00UT; (b) 04 : 00UT; (c) 05 : 00UT; (d) 06 : 00UT; (e) 07 : 00UTon May 3, 2008. The black pentacle represents the epicenter |

|
Fig. 6 The ΔVTEC distribution around the epicenter of Wenchuan earthquake at: (a) 13 : 00UT; (b) 14 : 00UT; (c) 15 : 00UT; (d) 16 : 00UT; (e) 17 : 00UT; (f) 18 : 00UT on May 3, 2008. The black pentacle represents the epicenter |

|
Fig. 7 The ΔVTEC distribution around the epicenter of Wenchuan earthquake at: (a)06:00UT; (b)07:00UT; (c)08:00UT; (d)09:00UT; (e)10:00UTon May6, 2008. The black pentacle represents the epicenter |

|
Fig. 8 The ΔVTEC distribution around the epicenter of Wenchuan earthquake at: (a)08:00UT; (b)09:00UT; (c)10:00UT; (d)11:00UT; (e)12:00UT on May9, 2008.The black pentacle represents the epicenter |
From Fig. 4, 5, 6, 7 and 8, we see clearly the amplitude-size and spatial coverage of the VTECs below the lower bound or beyond the upper bound. One obvious feature is that the VTEC anomalies drifted from east to west with the rotation of the Earth in all the 4 anomalous days. In other words, the area of the VTEC anomalies in any one of the 4 days almost located over the same place in the sun-fixed reference frame. Moreover, relative to the non-perturbed state of the ionosphere, at the tive peak times of ionospheric anomalies, the maximum variability amplitude of the ionospheric VTEC around the epicenter in the 4 anomalous days exceeded 40%, , 40%, , 80%, 40%, and 70%, (Fig. 9) respectively. Besides, all the ionospheric anomalies lasted beyond 4 hours in the 4 days. However, due to the limited observation area, we can't determine exactly how long the onospheric VTEC anomalies lasted.

|
Fig. 9 In comparison with the mean value of the previous 10-day VTECs, the distributions of the relative variability of the VTEC around the epicenter of Wenchuan earthquake at five peak times: (a) 08 : 00UT, April 29, 2008; (b) 05 : 00UT, May 3, 2008; (c) 16 : 00UT, May 3, 2008; (d) 08 : 00UT, May 6, 2008; (e) 10 : 00UT, May 9, 2008. The black pentacle represents the epicenter |
On the basis of the above analysis, we may declare that the ionospheric VTEC displayed the anomalous variations before Wenchuan earthquake. However, are all these ionospheric anomalies related with Wenchuan earthquake? To search the source of the ionospheric disturbances, we reviewed the level of solar and geomagnetic activity. Seen from Fig. 2, the solar-terrestrial environment was quiet after May 7, so the ionospheric anomalies on May 9 couldn't come from the sudden variations of the solar or geomagnetic activities. Moreover, the ionospheric anomalies have a local effect at the given time point during the anomalous period. Generally speaking, the low and relatively quiet activities of the sun and geomagnetism could not cause the large ionospheric disturbances. Therefore, the positive anomalies on May 9 could be related to Wenchuan earthquake. As for the ionospheric anomalies on the other 3 days, they just appeared in the period when a series of geomagnetic disturbances were happening. From Fig. 4, 5, 6, and 7, all these ionospheric anomalies look like local effects at the given time point. In a few days before April 29, although strong geomagnetic disturbances (3 < Kp < 4) happened, it still did not reach a level of weak storm. Moreover, the geomagnetic conditions were quiet (Dst≥-20 nT, Kp≤3 and the daily sum of Kp is lower than 20) as a whole on April 29, so it may be difficult to infer that the ionospheric anomalies on April 29 were a result of geomagnetic-effects. However, the anomalies appeared 13 days before Wenchuan earthquake, which is far away from the time scale (0~5 days) of seismo-ionospheric signal summarized by Pulinets et al. [32] and Liu et al.[28, 62]. Therefore, it can not be determined whether these ionospheric anomalies were associated with the earthquake. On May 3, the ionospheric anomalies (Fig. 5) in the afternoon is probably related to the Wenchuan earthquake because the geomagnetic conditions were almost quiet (Kp≤3 and Dst≥-20 nT) during the ionospheric anomalies and a few hours before, while the ionospheric anomalies (Fig. 6) in the night had a long-span spatial effects, especially along the east-west direction, so it could be caused by the continuous geomagnetic disturbances (2 < Kp≤3 and Dst < -20 nT) on May 3. On May 6, the geomagnetic activity reached a level of weak storm (Kp≥4 and Dst < -20 nT) and the ionospheric anomaly had a large spatial distribution (Fig. 7), therefore, the ionospheric anomalies on that day may be a result of geomagnetic effects.
In addition, due to the thermospheric dynamics caused by various types of atmospheric disturbances from lower atmosphere, the VTEC may generate signiticant day-to-day variations[63]. However, compared with a non-perturbed state of the ionosphere, the relative variability associated with thermospheric dynamics usually does not go beyond 30%[32, 64~66]. However, seen from Fig. 9, the maximal relative variability of the VTEC obviously went beyond the limk of 30%, during the ionospheric anomalies in all the 4 days, in comparison with the mean value of the previous 10-day VTECs. Moreover, the spatial sizes of the VTEC decrease and enhancement by more than 30%, extended larger than 1500 km in latitude and 4000 km in longitude at the five peak times of the ionospheric anomalies. According to the large relative variability of VTEC, we may exclude the influence on the ionosphere from meteorological effects.
Summarizing the above analysis, we can draw a conclusion that the positive and negative VTEC anomalies had appeared before Wenchuan earthquake, while the positive anomalies in the afternoon of May 3 and on May 9 are possibly the seismo-ionospheric signals.
4 Discussion and ConclusionAnalyzing the ground-based GPS VTEC data, we found the positive and negative ionospheric VTEC anomalies before Wenchuan earthquake. These ionospheric anomalies appeared 13, 9, 6 and 3 days before Wenchuan earthquake. In the 4 days of ionospheric anomalies, the spatial sizes of the VTEC decrease or enhancement by more than 30% were larger than 1500 km in latitude and 4000 km in longitude. Moreover, the ionospheric anomalies lasted beyond 4 hours and drifted from east to west in any one of the 4 days. In view of the solar-terrestrial environment and the characters of the ionospheric disturbances, we think that the VTEC anomalies in the afternoon of May 3 and on May 9 around the epicenter are most likely the ionospheric precursors of Wenchuan earthquake.
As for the mechanism of the seismo-ionospheric effects, two popular theories were put forward. The first one is that the acoustic gravity waves (AGW) from the lithospheric gas discharge in the vicinity of an active tectonic fault penetrate into the ionosphere to cause ionospheric oscillation[43]. However, the theoretic calculations[67] and experi-mental result[24] of the M=6. 7 Northridge earthquake of 17 January 1994 showed that the VTEC variations associated with AGW were 2~2. 5 order of magnitude lower than the background one. Based on this point, Pulinets and Boyarchuk [32] thought the penetration of AGW into the ionosphere is quite improbable and its precursory abilities may be neglected. The second one is that one extra electric field on the Earth's surface penetrates into the ionosphere and then generate the E×B drift. In earthquake preparation zone, the increasing radon emanation from active faults and cracks before earthquakes can ionize the near ground atmosphere producing a large vertical electric field on the Earth's surface[32]. It was also experimentally validated by Freund[68] that the mobile positive holes can be activated in the crust by microfractures during the dilatancy stage of earthquake preparation, and the diffusion and outflow of these holes can generate high electric fields on the Earth's surface. Through a quasi-electrostatic model of atmosphere-thermosphere-ionosphere coupling, Kim and Hegai[69], Pulinets et al. [70] and Sorokin et al. [71]showed that a strong vertical electric field on the Earth surface could penetrate into the ionosphere and modify its dynamics and electron density distribution prior to the earthquake onset.
Heretofore, a few scholars had also studied the seismo-ionospheric effects of Wenchuan earthquake. Zhao et al. [72] analyzed the NmF2 from ionosondes and the VTEC from GPS measurements. and found the ionospheric anomalies over the epicenter of Wenchuan earthquake on May 2, 3, 6, 7 and 9. Examining the solar-terrestrial environ-ment and characters of ionospheric anomalies, they thought the enhancement of electron density or VTEC on May 2 and 3 could be caused by the geomagnetic disturbances through a global-scale disturbance map (RTEC, subtract the 12-day median value) which is formed by singling out the maximum disturbed TEC at every grid point during 10 hours, and the decrease of electron density on May 6 and 7 is not clear whether they are related to the storms or the Wenchuan earthquake, while the anomalous enhancement accompanied by its coun-terpart in the southern hemisphere on May 9 is probably associated with seismo-ionospheric coup-ling process. Later, according to the global ionosphere map (GIM, ftp://cddisa.gsfc.nasa.gov) and the ionospheric occultation observation of FORMOSAT 3/COSMIC satellites, Liu et al. [73] also reported that the ionospheric VTEC significantly reduced in the afternoon of 4~6 days and the late evening of 3 days before Wenchuan earthquake, while extremely enhanced in the south and south-east of the epicenter along with their geomagnetic conjugate points in the afternoon of May 9. Further, considering the low Dst index during Wenchuan earthquake, they thought that all these ionospheric anomalies are the indications of seismo-generated electrom agnetic emissions. However, they didn't analyze the decrease of ionospheric VTEC on April 29, although the anomalous decrease is extremely striking, which was showed in their paper. Recently, Zhang et al. [74] found the dramatic decrease of the o+ density recorded by DEMETER satellite around the epicenter of W enchuan earthquake during the period of 10:00~13:00 LT on May 9 and thought that this abnormal phenomenon may be related to the earthquake. All these scholars mentioned above thought that the E × B drift was probably the explanation for seismo-ionospheric effects, while the E was one extra electric field which possibly originated from the increasing radon emanation, the photoelectrons provided by seismo-generated thermal radiations or the mobile positive holes activated in the crust bv microfractures during the dilatancy stage of earthquake preparation. Besides, some anomalies have been found in VLF transmi-tter signals and other parameters[75, 76].
Based on the above research results, it won widespread recognition that the ionospheric anoma-lies on May 9 were probably the precursors of Wenchuan earthquake. As for the ionospheric anomalies in the other periods, due to the differences of observations or methods for identifying anomalies, scholars have different views. In the present paper, relative to the future epicenter, the ionospheric anomalies probably related to the earthquake showed a long-distance drift from east to west (Fig. 5 and 8), which is hardly explained only using one extra electric field. Therefore, the possible coupling process of the earthquake-ionosphere needs a further investigation.
Up to now, earthquake forecast, especially short-term earthquake forecast, has not make a substantive breakthrough. Identifying different precursor signals is still a mainstream method for earthquake forecast. Compared with other known precursor signals of earthquake, seismo-ionospheric precursors have an advantage in determining the approximate time of earthquake. Recently, the statistical studies have proved that the anomalous variations in the ionosphere appeared within the time interval 0~5 days prior to the main shock[28, 32, 62]. So. the ionospheric precursors are very valuable in the short-term earthquake forecast.
Out of question, the seismo-ionospheric effects increase our confidence in fulfilling earthquake forecast. However, only from the great earthquake in specific earthquake preparation zone (e. g., Wenchuan earthquake), we can not draw a universal conclusion that the pre-earthquake ionospheric VTEC anomalies related with strong earthquake must appear. Before the real physical mechanism of the seismo-ionospheric effects has been founded, we still need to make statistical analysis of more earthquakes to sum up the characters of ionospheric disturbances related to earthquakes.
AcknowledgementsThis work has been supported by the Director Foundation of the Institute of Seismology, Chinese Earthquake Administration (grant No. IS200916012), Nation Key Technology R & D Program (grant No. 2OO8BAC35BO2) and National High Technology Research and Development Program of China (grant No. 2007AA12Z169). In addition, we thank the Crust M ovement Observation Network of China for providing the GPS observation data. the World Data Center for Geomagnetism, Kyoto for providing geomagnetic equatorial Dst index, and the NOAA National Geophysical Data Center for providing the data of solar F10. 7 flux and geomagnetic Kpindex.
| [1] | Gokhberg M B, Morgunov V A, Yoshino T, et al. Experimental measurements of EM emissions possibly related to earthquakes in Japan. Journal of Geophysical Research, 1982, 87: 7824-7829. DOI:10.1029/JB087iB09p07824 |
| [2] | Oike K, Ogawa T.Electromagnetic radiations from shallow earthquakes observed in the LF range.Journal of Geomagnetism and Geoelectricity, 1986, 38:1031-1040 |
| [3] | Parrot M, Mogilevsky M M. VLF emissions associated with earthquakes and observed in the ionosphere and the magnetosphere. Physics of the Earth and Planetary Interior, 1989, 57: 86-99. DOI:10.1016/0031-9201(89)90218-5 |
| [4] | Fujinawa Y, Takahashi K. Emission of electromagnetic radiation preceding the Ito seismic swarm of 1989. Nature, 1990, 347: 376-378. DOI:10.1038/347376a0 |
| [5] | Fujinawa Y, Takahashi K. Electromagnetic radiations associated with major earthquakes. Physics of the Earth and Planetary Interior, 1998, 105: 249-259. DOI:10.1016/S0031-9201(97)00117-9 |
| [6] | Hayakawa M, Fujisawa Y.EM Phenomena Related to Earthquake Prediction.Terra Scientific (TERAPUB), Tokyo, 1994 |
| [7] | Molchanov O, Haykawa M, Rafalsky V. Penetration characteristics of electromagnetic emissions from an underground seismic source into the atmosphere, ionosphere, and magnetosphere. Journal of Geophysical Research, 1995, 106(A2): 1691-1712. |
| [8] | Molchanov O A, Hayakawa M. Subionospheric VLF signal perturbations possibly related to earthquakes. Journal of Geophysical Research, 1998, 103: 17489-17504. DOI:10.1029/98JA00999 |
| [9] | Hayakawa M.Atmospheric and Ionospheric Electromagnetic Phenomena Associated with Earthquakes.TERRAPUB, Tokyo, 1999 |
| [10] | Varotsos P A.The Physics of Seismic Electric Signals.TerraPub, Tokyo, 2005 |
| [11] | Rozhnoi A, Molchanov O, Solovieva M, et al. Possible seismo-ionosphere perturbations revealed by VLF signals collected on ground and on a satellite. Nat.Hazards Earth Syst.Sci., 2007, 7: 617-624. DOI:10.5194/nhess-7-617-2007 |
| [12] | Prattes G, Schwingenschuh K, Eichelberger H U, et al. Multi-point ground-based ULF magnetic field observations in Europe during seismic active periods in 2004 and 2005. Nat.Hazards Earth Syst.Sci., 2008, 8: 501-507. DOI:10.5194/nhess-8-501-2008 |
| [13] | Zhang X M, Qian J D, Ouyang X Y, et al. Ionospheric electromagnetic perturbations observed on DEMETER satellite before Chile M7.9 earthquake. Earth Sci, 2009, 22: 251-255. DOI:10.1007/s11589-009-0251-7 |
| [14] | Ogawa T, Oike K, Miura T. Electromagnetic radiations from rocks. Journal of Geophysical Research, 1985, 90: 6245-6249. DOI:10.1029/JD090iD04p06245 |
| [15] | Cress G, Brady B, Rowell G. Sources of electromagnetic radiation from fracture of rock samples in the laboratory. Geophysical Research Letters, 1987, 14: 331-334. DOI:10.1029/GL014i004p00331 |
| [16] | Yamada I, Masuda K, Mizutni H. Electromagnetic and acoustic emission associated with rock fracture. Physics of the Earth and Planetary Interior, 1989, 57: 157-168. DOI:10.1016/0031-9201(89)90225-2 |
| [17] | O'Keefe S G, Thiel D. Electromagnetic emissions during rock blasting. Geophysical Research Letters, 1995, 18: 889-892. |
| [18] | Huang Q, Ikeya M. Seismic electromagnetic signals (SEMS) explained by a simulation experiment using electromagnetic waves. Physics of the Earth and Planetary Interiors, 1998, 109(3-4): 107-114. DOI:10.1016/S0031-9201(98)00135-6 |
| [19] | Gershenzon N, Bambakidis G. Modeling of seismo-electromagnetic phenomena. Russian Journal of Earth Sciences, 2001, 3(4): 247-275. DOI:10.2205/2001ES000058 |
| [20] | Li S Y, Tang L B, Liu J X, et al. Experimental investigation of precursory low-frequency events before strong earthquakes. Seismological and Geomagnetic Observation and Research, 2002, 23(4): 1-7. |
| [21] | Huang Q. Controlled analogue experiments on propagation of seismic electromagnetic signals. Chinese Science Bulletin, 2005, 50(17): 1956-1961. DOI:10.1360/982004-312 |
| [22] | Davies K, Baker D M. Ionospheric effect observed around the time of Alaska earthquake of March 28, 1964. Journal of Geophysical Research, 1965, 70(9): 172-179. |
| [23] | Hayakawa M, Fujinawa Y.Electromagnetic Phenomena Related to Earthquake Prediction.Terra Scientific Publishing Company, Tokyo, Terrapub, 1994 |
| [24] | Calais E, Minster J B. GPS detection of ionospheric TEC perturbations following the January 17, 1994, Northridge Earthquake. Geophysical Research Letters, 1995, 22: 1045-1048. DOI:10.1029/95GL00168 |
| [25] | Chmyrev V M, Isaev N V, Serebryakova O N, et al. Small-scale plasma inhomogeneities and correlated ELF emissions in the ionosphere over an earthquake region. Journal of Atmospheric and Solar-Terrestrial Physics, 1997, 59(9): 967-974. DOI:10.1016/S1364-6826(96)00110-1 |
| [26] | Liperovsky V A, Pokhotelov O A, Liperovskaya E V, et al. Modification of sporadic E-layers caused by seismic activity. Surveys in Geophysics, 2000, 21: 449-486. DOI:10.1023/A:1006711603561 |
| [27] | Liu J Y, Chen Y I, Chuo Y J, et al. Variations of ionospheric total electron content during the Chi-Chi earthquake. Geophysical Research Letters, 2001, 28: 1383-1386. DOI:10.1029/2000GL012511 |
| [28] | Liu J Y, Chuo Y J, Shan S J, et al. Pre-earthquake ionospheric anomalies monitored by GPS TEC. Annales Geophysicae, 2004, 22: 1585-1593. DOI:10.5194/angeo-22-1585-2004 |
| [29] | Gaivoronskaya T V, Pulinets S A. Analysis of F2-layer variability in the areas of seismic activity. Preprint IZMIRAN, Moscow, 2002, 2(1145): 1-20. |
| [30] | Plotkin V V. GPS detection of ionospheric perturbation before the 13 February 2001, El Salvador earthquake. Natural Hazards and Earth System Sciences, 2003, 3: 249-253. DOI:10.5194/nhess-3-249-2003 |
| [31] | Pulinets S A, Legen'ka A D. Spatial-temporal characteristics of large scale distributions of electron density observed in the ionospheric F-region before strong earthquakes. Cosmic Res., 2003, 41: 221-229. DOI:10.1023/A:1024046814173 |
| [32] | Pulinets S A, Boyarchuk K. Ionospheric Precursors of Earthquakes. Berlin: Springer, 2004. |
| [33] | Trigunait A, Parrot M, Pulinets S A, et al. Variation of ionospheric electron density during the Bhuj seismic event. Annales Geophysicae, 2004, 22: 4123-4131. DOI:10.5194/angeo-22-4123-2004 |
| [34] | Krankowski A, Zakharenkova I E, Shagimuratov I I. Response of the ionosphere to the Baltic Sea earthquake of 21 September, 2004. Acta Geophysica, 2006, 54(1): 90-101. DOI:10.2478/s11600-006-0008-9 |
| [35] | Zakharenkova I E, Krankowski A, Shagimuratov I I. Modification of the low-latitude ionosphere before December 26, 2004 Indonesian earthquake. Natural Hazards and Earth System Sciences, 2006, 6: 817-823. DOI:10.5194/nhess-6-817-2006 |
| [36] | Zakharenkova I E, Shagimuratov I I, Tepenitzina N Yu, et al. Anomalous modification of the ionospheric total electron content prior to the 26 September 2005 Peru earthquake. Journal of Atmospheric and Solar-Terrestrial physics, 2008, 70: 1919-1928. DOI:10.1016/j.jastp.2008.06.003 |
| [37] | Kelly M C. The Earth's Ionosphere:Plasma Physics and Electrodynamics. 1989. |
| [38] | Davies K.Ionospheric Radio.Peter Peregrinus Ltd, London, 1990 |
| [39] | Pulinets S A. Seismic activity as a source of the ionospheric variability. Advances in Space Research, 1998, 22(6): 903-906. DOI:10.1016/S0273-1177(98)00121-5 |
| [40] | Shang S P, Guo J S, Shi J K, et al. Morphologies of global ionospheric disturbances during different type geomagnetic disturbance events. Chinese J.Geophys., 2003, 46(1): 11-17. DOI:10.1002/cjg2.v46.1 |
| [41] | Pulinets S A, Legen'ka A D, Gaivoronskaya T V, et al. Main phenomenological features of ionospheric precursors of strong earthquakes. Journal of Atmospheric and Solar-terrestrial Physics, 2003, 65: 1337-1347. DOI:10.1016/j.jastp.2003.07.011 |
| [42] | Lin'kov E M, Petrova L N, Osipiv K S. Seismic gravitational pulsations of the earth and atmospheric disturbances as possible precursors of strong earthquakes. Transaction of USSR Academy of Science, Earth Science, 1991, 306: 13-16. |
| [43] | Shalimov S L, Gokhberg M B. Lithosphere-ionosphere coupling mechanism and its application to the earthquake in Iran on June 20, 1990. A review of ionospheric measurements and basic assumptions.Physics of the Earth and Planetary Interiors, 1998, 105: 211-218. |
| [44] | Gokhberg M B, Shalimov S L. The lithosphere and ionosphere relationship and its modeling. Russian J.Earth Sciences, 2000, 2(2): 95-108. DOI:10.2205/2000ES000032 |
| [45] | Pilipenko V, Shalimov S, Uyeda S, et al. Possible mechanism of the over-horizon reception of FM radio waves during earthquake preparation period. Proceedings of the Japan Academy, ser.B, 2001, 77: 125-130. DOI:10.2183/pjab.77.125 |
| [46] | Varotsos P, Hdjicontis V, Nowick A. The physical mechanism of seismic electric signals. Acta Geophysica Polonica, 2001, 49: 416-421. |
| [47] | Hayakawa M, Molchanov O A.Seismo-Electromagnetics:Lithosphere-Atmosphere-Ionosphere Coupling.TERRAPUB, Tokyo, 2002 |
| [48] | Molchanov O, Fredorov E, Schekotov A, et al. Lithosphere-atmosphere-ionosphere coupling as governing mechanism for preseismic short-term events in atmosphere and ionosphere. Natural Hazards and Earth System Sciences, 2004, 4: 757-767. DOI:10.5194/nhess-4-757-2004 |
| [49] | Rapoport Y, Grimalsky V, Hayakawa M, et al. Change of ionosphere plasma parameters under the influence of electric field which has lithospheric origin and due to radon emanation. Physics and Chemistry of the Earth, 2004, 29: 579-587. DOI:10.1016/j.pce.2003.09.018 |
| [50] | Yoshida S, Ogawa T. Electromagnetic emissions from dry and wet granite associated with acoustic emission. Journal of Geophysical Research, 2004, 109(B9): B09204. |
| [51] | Kamogawa M. Preseismic lithosphere-atmosphere-ionosphere coupling. EOS, Transactions of the American Geophysical Union, 2006, 87(40): 417-424. |
| [52] | Mannucci A J, Wilson B D, Yuan D N, et al. A global mapping technique for GPS-derived ionospheric electron content measurements. Radio Science, 1998, 33(3): 565-582. DOI:10.1029/97RS02707 |
| [53] | Jakowski N, Heise S, Wehrenpfennig A, et al. GPS/GLONASS-based TEC measurements as a contributor for space weather forecast. Journal of Atmospheric and Solar-Terrestrial Physics, 2002, 64: 729-735. DOI:10.1016/S1364-6826(02)00034-2 |
| [54] | Otsuka Y, Ogawa T, Saito A, et al. A new technology for mapping of total electron content using GPS network in Japan. Earth Planets Space, 2002, 58(5): 529-534. |
| [55] | Schaer S.Mapping and predicting the Earth's ionosphere using the global positioning system[Ph.D.dissertation].Astronomical Institute, University of Berne, Switzerland, 1999 |
| [56] | Azpilicueta F, Brunini C, Radicella S M. Global ionospheric maps from GPS observations using modip latitude. Advance in Space Research, 2006, 38: 2324-2331. DOI:10.1016/j.asr.2005.07.069 |
| [57] | Wilson B D, Mannucci A J.Instrument biases in ionospheric measurements derived from GPS data.Proceedings of ION GPS'93, Salt Lake City, 1993 |
| [58] | Sardon E, Rius A, Zarraoa N. Estimation of the transmitter and receiver differential biases and the ionospheric total electron content from global positioning system observations. Radio Science, 1994, 29(3): 577-586. DOI:10.1029/94RS00449 |
| [59] | Ma G, Maruyama T. Derivation of TEC and estimation of instrumental biases from GEONET in Japan. Annales Geophysicae, 2003, 21(10): 2083-2093. DOI:10.5194/angeo-21-2083-2003 |
| [60] | Gao Y, Heroux P, Kouba J.Estimation of GPS receiver and satellite L1/L2 signal delay biases using data from CACS.Proceedings of KIS-94, Banff, Canada, August 30-September 2, 1994 |
| [61] | Komjathy J.Global ionospheric total electron content mapping using the Global Positioning System[Ph.D.thesis].Fredericton:University of New Brunswick, 1997 |
| [62] | Liu J Y, Chen Y I, Chuo Y J, et al. A statistical investigation of pre-earthquake ionospheric anomaly. J.Geophys.Res., 2006, 111: A05304. DOI:10.1029/2005JA011333 |
| [63] | Kazimirovski E S. Coupling from below as a source of ionospheric variability:a review. Annals of Geophysics, 2002, 45: 1-29. DOI:10.1016/S0065-2687(02)80006-1 |
| [64] | Forbes J M, Palo S E, Zhang X L. Variability of the ionosphere. Journal of Atmospheric and Solar-Terrestrial Physics, 2000, 62: 685-693. DOI:10.1016/S1364-6826(00)00029-8 |
| [65] | Rishbeth H, Mendillo M. Patterns of F2-layer variability. Journal of Atmospheric and Solar-Terrestrial Physics, 2001, 63: 1661-1680. DOI:10.1016/S1364-6826(01)00036-0 |
| [66] | Mendillo M, Rishbeth H, Roble R G, et al. Modelling F2-layer seasonal trends and day-to-day variability driven by coupling with the lower atmosphere. Journal of Atmospheric and Solar-Terrestrial Physics, 2002, 64: 1911-1931. DOI:10.1016/S1364-6826(02)00193-1 |
| [67] | Davies J B, Archambeau C B. Modeling of atmospheric and ionospheric disturbances from shallow seismic sources. Phys.Earth Planet.Inter., 1998, 105: 183-199. DOI:10.1016/S0031-9201(97)00090-3 |
| [68] | Freund F. Time-resolved study of charge generation and propagation in igneous rocks. J.Geophys.Res., 2000, 105: 11001-11019. DOI:10.1029/1999JB900423 |
| [69] | Kim V P, Hegai V V.A possible presage of strong earthquakes in the nighttime mid latitude associated with earthquakes.In:Hayakawa M ed.Atmospheric and Ionoshperic Electroma-gnetic Phenomena Associated with Earthquakes.Terra Scientific Publishing Company, Tokyo, 1999, 619-627 |
| [70] | Pulinets S A, Boyarchuk K A, Hegai V V, et al. Quasielectrostatic model of atmosphere-thermosphere ionosphere coupling. Adv.Space Res., 2000, 26(8): 1209-1218. DOI:10.1016/S0273-1177(99)01223-5 |
| [71] | Sorokin V M, Chmyrev V M, Yaschenko A K. Electrodynamic model of the lower atmosphere and the ionosphere coupling. J.Atmos.Sol.Terr.Phys., 2001, 63: 1681-1691. DOI:10.1016/S1364-6826(01)00047-5 |
| [72] | Zhao B, Yu T, Wang M, et al. Is an unusual large enhancement of ionospheric electron density linked with the 2008 great Wenchuan earthquake? J. Geophys.Res., 2008, 113: A11304. DOI:10.1029/2008JA013613 |
| [73] | Liu J Y, Chen Y I, Chen C H, et al. Seismoionoshperic GPS total electron content anomalies observed before the 12 May 2008 Mw7.9 Wenchuan earthquake. J.Geophys.Res., 2009, 114: A04320. DOI:10.1029/2008JA013698 |
| [74] | Zhang X, Shen X, Liu J, et al. Analysis of ionospheric plasma perturbations before Wenchuan earthquake. Nat.Hazards Earth Syst.Sci., 2009, 9: 1259-1266. DOI:10.5194/nhess-9-1259-2009 |
| [75] | He Y F, Yang D M, Chen H R, et al. SNR changes of VLF radio signals detected onboard the DEMETER satellite and their possible relationship to the Wenchuan earthquake. Sci.China Ser.D, 2009, 52. DOI:10.1007/s11430-009-0064-5 |
| [76] | Zeng Z C, Zhang B, Fang G Y, et al. The analysis of ionospheric variations before the Wenchuan earthquake with DEMETER data. Chinese J.Geophys., 2009, 52(1): 11-19. |