急性缺血性脑卒中(acute ischemic stroke,AIS)是目前世界范围内主要的致死、致残原因之一[1-2],发作3~6 h内进行静脉溶栓对患者的有效治疗和预后评估有重要作用[3]。因此及时、准确地确定缺血半暗带至关重要[4]。全脑计算机断层扫描灌注成像(computed tomography perfusion imaging,CTP)技术可快速确定梗死区和缺血半暗带,并且可用于评估脑组织缺血性病变的严重程度及干预治疗对缺血性损害的保护效果[5-7]。全脑CTP检查需要对头颅进行反复扫描,辐射剂量不容忽视,调整采样方式是降低辐射剂量的有效方法之一。本研究拟采用第3代双源计算机断层扫描(computed tomography,CT)评估不同采样方式对CTP灌注参数和辐射剂量的影响,探讨符合临床诊断的优化扫描方案并降低辐射剂量。
1 资料和方法 1.1 临床资料连续收集我院2016年11月至2017年6月的56例受检者。纳入标准:临床表现为疑似急性脑卒中症状,如偏瘫、语言障碍及头晕等且在6 h内有相应症状发作,进行颅脑CT平扫及全脑CTP检查。排除标准:碘过敏者,严重肾病及无法配合完成检查者,妊娠妇女,烟雾病、脑血管畸形及颅脑手术术后患者,经颅脑CT平扫检查确诊有出血灶的患者。本研究通过天津医科大学总医院伦理委员会审批,所有受检者均签署知情同意书。
1.2 CTP扫描方案所有检查均采用第3代双源CT机(SOMATOM Force, Siemens Healthineers, Forchheim,Germany)。颅脑CT平扫检查参数:探测器准直为128 mm×0.6 mm,机架旋转时间为250 ms/rot,扫描螺距为0.6,管电压为120 kV,管电流为260 mA,层厚为5 mm,层间距为5 mm。
采用螺旋扫描和摇篮床技术进行全脑CTP检查,探测器准直及机架旋转时间同上,扫描螺距为1.2,管电压为70 kV,管电流为120 mA。应用双筒高压注射器经肘前静脉留置针注射40 mL非离子型碘造影剂(碘含量为370 mg/mL,Ultravist,Bayer Schering Pharma,Berlin,Germany),注射速率为4.0 mL/s,并以同样速率注射生理盐水20 mL。延迟7 s后进行全脑CTP扫描,采样时间间隔为1.5 s,持续37.5 s,获得25组图像。使用联合迭代重建算法进行重建,层厚为10 mm,间隔为10 mm。
1.3 后处理与CTP参数测量将全脑CTP图像传至西门子工作站(syngo.via,Siemens Healthineers)进行图像后处理和数据分析。首先对图像进行自动校正,以减少运动伪影。设定阈值范围为20~100 HU,排除空气、脑室、脑沟及骨骼等的信号。于大脑前动脉近端设置输入动脉感兴趣区(region of interest,ROI),采用自动检测的方式得到动脉最大增强值,用该值减去血管部分得到脑实质图像。在窦汇处选取静脉ROI以校正输入动脉ROI的部分容积效应。最终经去卷积法计算重建得到灌注伪彩图。通过手动放置ROI测量得到脑组织的时间-密度曲线(time-attenuation curve,TAC),计算灌注参数:血流量(blood flow,BF)、血容量(blood volume,BV)、平均通过时间(mean transit time,MTT)。
使用不同采样时间点获得不同时间点采样方式的CTP扫描方案。(1)第1组:标准对照组,采样间隔为1.5 s,采用初始采集的灌注图像进行重建(图 1A);(2)第2组:3 s采样间隔组,间隔3 s选取初始灌注图像数据,将选取后得到的图像进行重建[8](图 1B);(3)第3组:以动脉TAC的上升点和下降点作为分界点,扫描前期(动脉TAC上升点之前)和后期(动脉TAC下降点之后)采样间隔为3 s,中间(动脉TAC上升点与下降点之间)采样间隔为1.5 s(图 1C);(4)第4组:动脉TAC和静脉TAC顶点间的采样间隔为1.5 s,前、后的采样间隔为3 s(图 1D)。

|
图 1 各CTP扫描方案组TAC示意图 Fig 1 Diagrammatic drawing of TAC for each CTP scanning protocol group A: Group 1 (scanning interval of 1.5 s as the standard control group); B: Group 2 (scanning interval of 3 s); C: Group 3 (scanning interval of 3 s in pre-ascending and pro-descending and scanning interval of 1.5 s in the intermediate period); D: Group 4 (scanning interval of 1.5 s between the peak of artery and vein and other scanning interval of 3 s). CTP: Computed tomography perfusion; TAC: Time-attenuation curve; CT: Computed tomography; HU: Hounsfield unit |
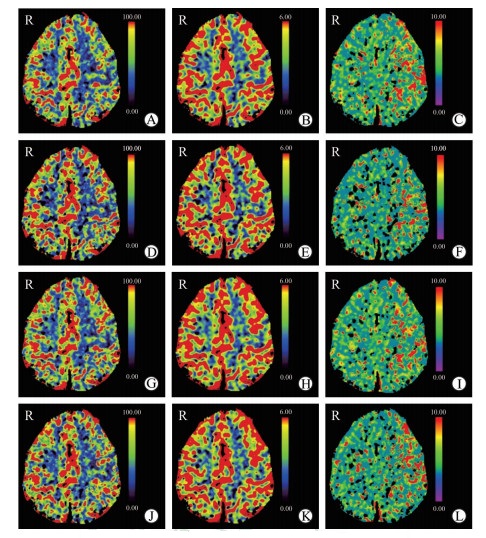
CT平扫和CTP扫描均未见AIS表现者为无AIS组,选取半卵圆中心层面、基底节层面及颅底层面3个代表性层面进行测量。圆形ROI放置于脑实质(灰质或白质)中,ROI面积为0.26~0.3 cm2,对称测量左侧和右侧脑实质,测量时避开脑实质边缘、脑沟、脑室及血管,各组ROI放置于相同位置,获得的灌注伪彩图见图 2。AIS患者为AIS组,测量时将圆形ROI放置于缺血区域,ROI面积同无AIS组,并以对称的方式在对侧脑实质放置相同ROI,得到双侧相同位置的灌注参数值,在测量时亦避开脑实质边缘、脑沟、脑室及血管,获得的灌注伪彩图见图 3。

|
图 2 无AIS者各CTP扫描方案组灌注伪彩图 Fig 2 Pseudo-color perfusion maps of each CTP scanning protocol group in patients without AIS A-C: Group 1 (scanning interval of 1.5 s as the standard control group); D-F: Group 2 (scanning interval of 3 s); G-I: Group 3 (scanning interval of 3 s in pre-ascending and pro-descending and scanning interval of 1.5 s in the intermediate period); J-L: Group 4 (scanning interval of 1.5 s between the peak of artery and vein and other scanning interval of 3 s). A, D, G, J: Blood flow; B, E, H, K: Blood volume; C, F, I, L: Mean transit time. The pseudo-color perfusion maps were reconstructed by different time sampling modes containing different information. Group 3 was closest to group 1, group 4 lost the most information. AIS: Acute ischemic stroke; CTP: Computed tomography perfusion |

|
图 3 AIS患者各CTP扫描方案组灌注伪彩图 Fig 3 Pseudo-color perfusion maps of each CTP scanning protocol group in AIS patients A-C: Group 1 (scanning interval of 1.5 s as the standard control group); D-F: Group 2 (scanning interval of 3 s); G-I: Group 3 (scanning interval of 3 s in pre-ascending and pro-descending and scanning interval of 1.5 s in the intermediate period); J-L: Group 4 (scanning interval of 1.5 s between the peak of artery and vein and other scanning interval of 3 s). A, D, G, J: Blood flow; B, E, H, K: Blood volume; C, F, I, L: Mean transit time. The information of pseudo-color perfusion maps of four groups was similar to the ones in the patients without AIS. The patient was a 67-year-old female, with infarction in the left parietal temporal lobe and the centrum semiovale. The pseudo-color perfusion map showed that the blood flow in this area was significantly reduced. AIS: Acute ischemic stroke; CTP: Computed tomography perfusion |
1.4 图像质量评分
采用双盲方式对两组图像的图像质量进行定性分析。将每例无AIS者或AIS患者的不同采样方式分组所得的灌注伪彩图存为一组,灌注伪彩图包括血流量、血容量和MTT图像,由2名影像科医师对各组图像的图像质量进行评分,若意见不一致则讨论决定最终评分等级。图像评分采用Likert 4级评分法[9]:1分为图像质量优,对诊断无影响;2分为图像质量良好,诊断基本不受影响;3分为图像质量尚可,诊断稍困难,但尚能做出诊断;4分为图像质量差,诊断困难。每位医师均使用西门子工作站观察图像,并且在必要时使用测量工具以便更好地判断图像质量。
1.5 辐射剂量记录CTP扫描后扫描仪自动生成的受检者辐射剂量报告中的CT剂量指数(CT dose index,CTDI)和剂量-长度乘积(dose length product,DLP)。计算有效辐射剂量(effective dose,ED)公式为ED=DLP×转换系数k [k=0.002 1 mSv/(mGy • cm)][10]。上述辐射剂量参数除以采样次数即为单次采样的相应数值,乘以调整后的采样次数即得4组的辐射剂量参数相应数值。
1.6 统计学处理应用SPSS 22.0软件进行数据处理。通过4种不同采样方式获得的灌注参数数据经正态性检验均不符合正态分布,以中位数(范围)表示,采用Mann-Whitney U检验进行两组间比较,对差异无统计学意义的两种采样方式之间采用Bland-Altman分析进行一致性检验,落在95%置信区间(confidence interval,CI)内的点以百分比(落在95% CI内的点/点的总数)表示;采用Pearson相关分析进行相关性分析。检验水准(α)为0.05。
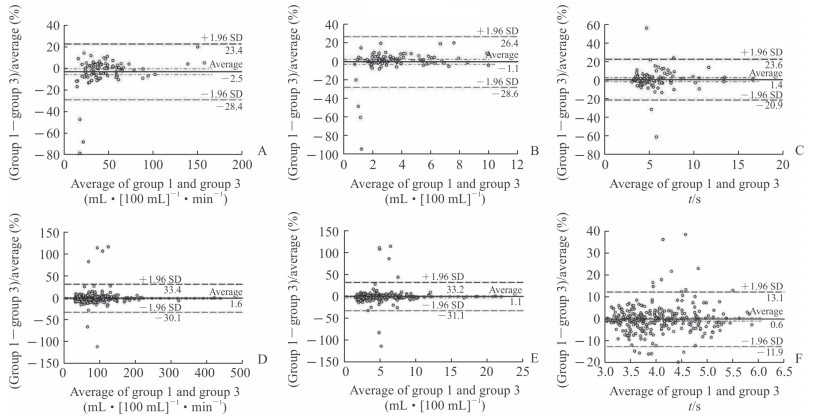
2 结果 2.1 灌注参数分析结果56例受检者中5例确诊有出血灶、4例有手术史,最终入组47例受检者,包括男33例、女14例,年龄为(61±9)岁。AIS组19例(男11例),无AIS组28例(男22例),两组每例患者缺血区域和同一部位对侧脑实质共放置10个ROI,分别获得的数据点总数为190和280。放置ROI测量灌注参数值并且对测得的灌注参数值进行定量分析,AIS组(n=190)血流量、血容量、MTT分别为40.68(10.29~194.94)mL/(100 mL • min)、2.87(0.58~11.53)mL/(100 mL)、4.86(3.01~16.75)s,无AIS组(n=280)分别为73.90(18.76~425.90)mL/(100 mL • min)、4.40(0.99~25.91)mL/(100 mL)、3.80(3.00~7.41)s,两组比较差异均有统计学意义(Z=-16.30、-9.90、-14.65,P均<0.01)。组间分析结果(表 1)显示,在AIS患者中,第2组血流量较第1组增加,第2组和第4组MTT较第1组均缩短,差异均有统计学意义(Z=-5.26、-3.38、-4.09,P均<0.01),而第3组血流量、血容量、MTT与第1组相比差异均无统计学意义(P均>0.05);对于无AIS者,第4组MTT与第1组相比缩短,差异有统计学意义(Z=-2.44,P<0.01),而第2组和第3组血流量、血容量、MTT与第1组相比差异均无统计学意义(P均>0.05)。综合所有入组受检者参数的统计结果,第3组与第1组相比血流量、血容量和MTT差异均无统计学意义(P均>0.05)。Bland-Altman一致性分析结果(图 4)显示,AIS患者中第1组与第3组之间血流量、血容量和MTT的一致性较好,95% CI分别是-28.4~23.4、-28.6~26.4和-20.9~23.6,分别有98.4%(187/190)、98.4%(187/190)和97.9%(186/190)的点落在一致性界限内;无AIS者在第1组与第3组之间血流量、血容量和MTT的一致性较好,95% CI分别是-30.1~33.4、-31.1~33.2和-11.9~13.1,分别有97.9%(274/280)、97.5%(273/280)和95.0%(266/280)的点落在一致性界限内。
|
|
表 1 AIS患者及无AIS者各组灌注参数的比较 Tab 1 Comparison of perfusion parameters of 4 groups between AIS and non-AIS patients |

|
图 4 第1组和第3组的Bland-Altman分析图 Fig 4 Bland-Altman analysis of group 1 and group 3 A-C: AIS; D-E: Non-AIS. A, D: BF; B, E: BV; C, F: MTT. 1.96 SD and -1.96 SD represent the upper and lower bounds of confidence interval, respectively. Group 1: Scanning interval of 1.5 s as the standard control group; Group 3: Scanning interval of 3 sin pre-ascending and pro-descending and scanning interval of 1.5 s in the intermediate period. AIS: Acute ischemic stroke; BF: Blood flow; BV: Blood volume; MTT: Mean transit time; SD: Standard deviation |
2.2 图像质量评分主观分析结果
47例受检者以不同采样方式分为4组,且每组分别重建血流量、血容量及MTT灌注伪彩图,共有14 100幅图像进行图像质量评分,结果显示第1组所有图像均可以达到诊断水平,第2组2.13%(1/47)的图像质量评分为4分,第3组所有图像均可以达到诊断水平,第4组4.25%(2/47)的图像质量评分为4分。综上所述,与第1组即标准对照组相比,其他3组中第3组图像主观评分最佳。
2.3 各组辐射剂量比较第1组采用初始数据,持续扫描37.5 s,时间间隔为1.5 s,连续扫描曝光25次。CTDI和DLP(探测器宽度为96 mm)平均值分别为78.66 mGy和1 168.38 mGy•cm。ED为2.45 mSv,平均每次曝光的ED为0.098 mSv。各组曝光次数、ED及与占标准扫描ED值的百分比见表 2。
|
|
表 2 各组曝光次数及标准扫描ED值的百分比比较 Tab 2 Comparison of exposure times and percentage of standard ED value in each group |
2.4 推荐扫描方案
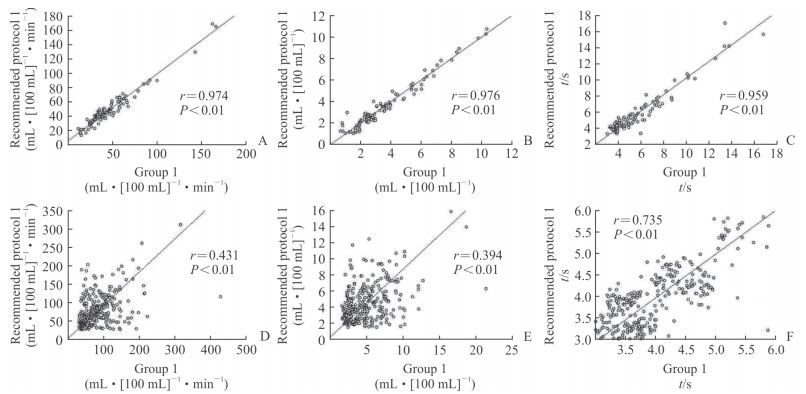
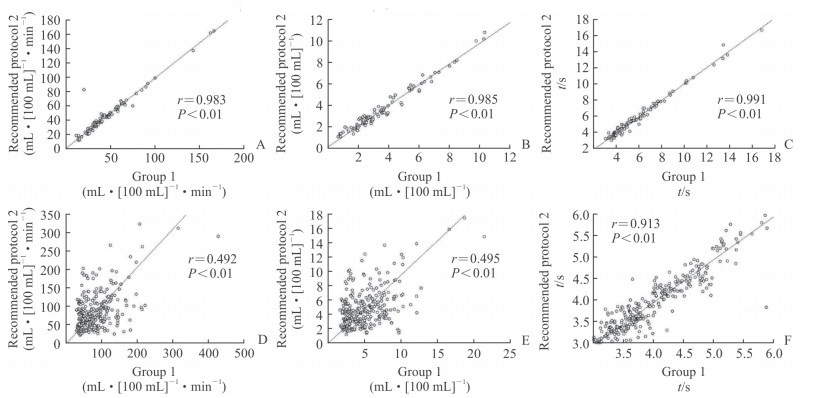
经过灌注参数分析、主观分析及辐射剂量统计数据分析,第3组扫描方案不影响诊断结果,且能有效降低辐射剂量。根据本研究中的记录可得动脉TAC曲线上升界点时间平均值为10.5(4.5~19.5)s,动脉TAC曲线下降界点时间平均值为31.5(25.5~34.5)s。因此,按照第3组采样方式及所记录的时间点设立两种推荐方案:方案一为上升界点10.5 s,下降界点31.5 s;方案二为上升界点4.5 s,下降界点31.5 s。用同样方式测得灌注参数血流量、血容量和MTT。对AIS患者和无AIS者两种方案测得的3个灌注参数分别与第1组即标准对照组进行相关性分析,绘制的方案一和方案二散点图分别见图 5、6,结果显示AIS患者和无AIS者两种推荐方案所得灌注参数均与第1组相关性较好(推荐方案一:r=0.974、0.976、0.959和0.431、0.394、0.735,P均<0.01;推荐方案二:r=0.983、0.985、0.991和0.492、0.495、0.913,P均<0.01)。计算ED值分别为1.96 mSv和2.16 mSv,占标准扫描ED值的百分比分别为80.00%和88.16%。

|
图 5 AIS患者和无AIS者推荐扫描方案一与第1组(标准对照组)相关分析散点图 Fig 5 Correlation analysis of perfusion parameters between recommended protocol 1 and group 1 (standard control group) in AIS and non-AIS patients A-C: AIS; D-F: Non-AIS. A, D: BF; B, E: BV; C, F: MTT. Group 1: Scanning interval of 1.5 s as the standard control group; AIS: Acute ischemic stroke; BF: Blood flow; BV: Blood volume; MTT: Mean transit time |

|
图 6 AIS患者和无AIS者推荐扫描方案二与第1组(标准对照组)相关分析散点图 Fig 6 Correlation analysis of perfusion parameters between recommended protocol 2 and group 1 (standard control group) in AIS and non-AIS patients A-C: AIS; D-F: Non-AIS. A, D: BF; B, E: BV; C, F: MTT. Group 1: Scanning interval of 1.5 s as the standard control group. AIS: Acute ischemic stroke; BF: Blood flow; BV: Blood volume; MTT: Mean transit time |
3 讨论
X线类检查主要缺点是电离辐射,CTP扫描也不例外,较高的辐射剂量会使患癌风险上升[11]。为了减小对患者的损害,降低辐射剂量,已有许多研究对此进行了论述,强调降低辐射剂量的重要性及相关不同技术的应用[8, 12-17]。降低辐射剂量的常用方法有降低管电压[13-14]、降低管电流[15]及使用合适的采样间隔[8, 16-17]。其中,加大采样间隔被认为可大幅度降低辐射剂量[8]。Wintermark等[16]研究表明采样间隔>1 s不会影响诊断准确性。本研究所采用的第3代双源CT,标准采样间隔为1.5 s,已经扩大采样间隔并降低辐射剂量。本研究的目的是在不影响临床诊断的前提下,探讨能否调整采样方式进一步降低辐射剂量。而Goh等[8]研究强调如果采样间隔>3 s会影响图像质量而使诊断准确度显著降低。因此,本研究设立第2组即3 s采样间隔组进行新设备的适用性验证,而第3组及第4组均以不同方式适当加大采样间隔,但均不超过3 s,也均降低了辐射剂量。
无论是传统的电影扫描技术还是第3代双源CT的摇篮床技术,对于CTP检查图像的获取均需采用连续扫描的方式,扫描范围不变,总扫描时间不变,若采样间隔短则曝光次数多。因此采样间隔与辐射剂量呈正比,但是间隔时间过长则可能影响诊断结果的准确性。Goh等[8]研究建议使用CTP检查进行诊断时扫描采样间隔应<3 s。Wintermark等[16]研究也得到类似结果,认为AIS患者采用3 s采样间隔所得全脑灌注图像不影响诊断结果。然而,上述研究中采用的设备为多排螺旋CT,与目前使用的第3代双源CT不同,本研究也探讨了3 s采样间隔对CTP检查的影响,结果并不理想,其原因可能是与扫描设备不同有关。因此,3 s采样间隔并非适用于所有机型,需要探讨更佳的方法。
本研究每组采样方式均采用TAC确定,TAC上升及下降界点的早晚与造影剂的注射速率和受检者心率有关,而造影剂增强的持续时间即TAC从开始上升至下降结束的持续时间与造影剂的团注剂量有关[16]。本研究所有受检者造影剂注射均采用相同的注射剂量和速率,分别为40 mL、4.0 mL/s,排除了造影剂注射剂量和速率对于TAC的影响,但是无法排除受检者心率的影响。本研究分组依据动静脉TAC特点及灌注参数计算原理,提出第3组及第4组的采样方法。血流量、血容量和MTT等灌注参数的计算原理为菲克(Fick)定律,经过推算得到血流量的计算公式为BF=[d/dt ct(t)∣max]/[ca(t)∣max],其中ct为组织中造影剂浓度,ca为动脉中造影剂浓度[18],由此公式可以看出TAC中对于计算灌注参数最重要的采样点为顶点及确定最大斜率的时间点,因此在TAC开始上升前或下降结束后的采样点可以适当减少,即加大采样间隔、减少曝光次数,从而降低辐射剂量。以上为设立第3组的理论基础。CTP检查的目的是观察组织的灌注情况,而造影剂流动顺序为动脉、组织、静脉,因此可依据动脉及静脉TAC特点,确定组织灌注曲线顶点的范围。组织灌注部分应保留,而其他部分可适当延长采样间隔以减少辐射剂量。以上为设立第4组的理论基础。本研究表明,第3组与第1组计算的灌注参数基本相似且不影响临床诊断,比第4组所得结果更佳。
根据上述血流量的计算公式[18]可知计算灌注参数最重要的采样点为顶点及确定最大斜率的时间点,因此顶点前的采样点可适当保留。本研究第3组以动脉TAC的上升点和下降点作为界点,扫描前期和后期采样间隔为3 s,中间采样间隔为1.5 s。根据实验中记录的界点时间的平均值和最小值,提出两种推荐方案,两种方案均与第1组相关性较好,辐射剂量均减低。两种推荐方案各有优势,方案一辐射剂量低,方案二扫描成功率更高、图像质量更佳,但是辐射剂量较方案一稍高。因此,在工作中应依据实际情况选择。
本研究存在一定局限性。首先,样本量小,本研究结论仍需大样本研究进一步验证。其次,研究对象为AIS患者及有AIS症状但CT或CTP检查未发现病灶者,本研究结论也需在其他疾病病例中进一步验证。
综上所述,采用“以动脉TAC的上升点和下降点作为界点,扫描前期和后期采样间隔3 s,中间部分采样间隔1.5 s”的全脑灌注采样扫描方案与标准扫描方式的灌注参数一致,可以保证诊断需要的图像质量,并有效降低辐射剂量。根据患者实际情况选择上升和下降界点可以实现对患者的个性化扫描,并有潜力应用于实际临床工作、有效降低辐射剂量,更好地推广全脑CTP检查。
| [1] |
MAO H, LIN P, MO J, LI Y, CHEN X, RAINER T H, et al. Development of a new stroke scale in an emergency setting[J]. BMC Neurol, 2016, 16: 168. DOI:10.1186/s12883-016-0695-z |
| [2] |
GITTLER M, DAVIS A M. Guidelines for adult stroke rehabilitation and recovery[J]. JAMA, 2018, 319: 820-821. DOI:10.1001/jama.2017.22036 |
| [3] |
POWERS W J, RABINSTEIN A A, ACKERSON T, ADEOYE O M, BAMBAKIDIS N C, BECKER K, et al. 2018 guidelines for the early management of patients with acute ischemic stroke:a guideline for healthcare professionals from the American Heart Association/American Stroke Association[J]. Stroke, 2018, 49: e46-e110. DOI:10.1161/STR.0000000000000158 |
| [4] |
GÓMEZ-PINEDO U, SANCHEZ-ROJAS L, BENITO-MARTIN M S, LENDINEZ C, LEÓN-ESPINOSA G, RASCÓN-RAMIREZ F J, et al. Evaluation of the safety and efficacy of the therapeutic potential of adipose-derived stem cells injected in the cerebral ischemic penumbra[J]. J Stroke Cerebrovasc Dis, 2018, 27: 2453-2465. DOI:10.1016/j.jstrokecerebrovasdis.2018.05.001 |
| [5] |
DONAHUE J, WINTERMARK M. Perfusion CT and acute stroke imaging:foundations, applications, and literature review[J]. J Neuroradiol, 2015, 42: 21-29. DOI:10.1016/j.neurad.2014.11.003 |
| [6] |
ZHU G, MICHEL P, AGHAEBRAHIM A, PATRIE J T, XIN W, ESKANDARI A, et al. Computed tomography workup of patients suspected of acute ischemic stroke:perfusion computed tomography adds value compared with clinical evaluation, noncontrast computed tomography, and computed tomography angiogram in terms of predicting outcome[J]. Stroke, 2013, 44: 1049-1055. DOI:10.1161/STROKEAHA.111.674705 |
| [7] |
TSOGKAS I, KNAUTH M, SCHREGEL K, BEHME D, WASSER K, MAIER I, et al. Added value of CT perfusion compared to CT angiography in predicting clinical outcomes of stroke patients treated with mechanical thrombectomy[J]. Eur Radiol, 2016, 26: 4213-4219. DOI:10.1007/s00330-016-4257-y |
| [8] |
GOH V, LIAW J, BARTRAM C I, HALLIGAN S. Effect of temporal interval between scan acquisitions on quantitative vascular parameters in colorectal cancer:implications for helical volumetric perfusion CT techniques[J]. AJR Am J Roentgenol, 2008, 191: W288-W292. DOI:10.2214/AJR.07.3985 |
| [9] |
GORDIC S, HUSARIK D B, DESBIOLLES L, LESCHKA S, FRAUENFELDER T, ALKADHI H. High-pitch coronary CT angiography with third generation dual-source CT:limits of heart rate[J]. Int J Cardiovasc Imaging, 2014, 30: 1173-1179. DOI:10.1007/s10554-014-0445-5 |
| [10] |
FISHER D R, FAHEY F H. Appropriate use of effective dose in radiation protection and risk assessment[J]. Health Phys, 2017, 113: 102-109. DOI:10.1097/HP.0000000000000674 |
| [11] |
BACH P B, MIRKIN J N, OLIVER T K, AZZOLI C G, BERRY D A, BRAWLEY O W, et al. Benefits and harms of CT screening for lung cancer:a systematic review[J]. JAMA, 2012, 307: 2418-2429. DOI:10.1001/jama.2012.5521 |
| [12] |
OTHMAN A E, AFAT S, BROCKMANN M A, NIKOUBASHMAN O, BROCKMANN C, NIKOLAOU K, et al. Radiation dose reduction in perfusion CT imaging of the brain:a review of the literature[J]. J Neuroradiol, 2016, 43: 1-5. DOI:10.1016/j.neurad.2015.06.003 |
| [13] |
LI Z L, LI H, ZHANG K, LI W J, CHEN X, WU B, et al. Improvement of image quality and radiation dose of CT perfusion of the brain by means of low-tube voltage (70 kV)[J]. Eur Radiol, 2014, 24: 1906-1913. DOI:10.1007/s00330-014-3247-1 |
| [14] |
CORCUERA-SOLANO I, MCLELLAN A M, DOSHI A H, PAWHA P S, TANENBAUM L N. Whole-brain adaptive 70-kVp perfusion imaging with variable and extended sampling improves quality and consistency while reducing dose[J]. AJNR Am J Neuroradiol, 2014, 35: 2045-2051. DOI:10.3174/ajnr.A4043 |
| [15] |
RIEDERER I, ZIMMER C, PFEIFFER D, WUNDERLICH S, POPPERT H, RUMMENY E J, et al. Radiation dose reduction in perfusion CT imaging of the brain using a 256-slice CT:80mAs versus 160mAs[J]. Clin Imaging, 2018, 50: 188-193. DOI:10.1016/j.clinimag.2018.03.021 |
| [16] |
WINTERMARK M, SMITH W S, KO N U, QUIST M, SCHNYDER P, DILLON W P. Dynamic perfusion CT:optimizing the temporal resolution and contrast volume for calculation of perfusion CT parameters in stroke patients[J]. AJNR Am J Neuroradiol, 2004, 25: 720-729. |
| [17] |
ABELS B, KLOTZ E, TOMANDL B F, VILLABLANCA J P, KLOSKA S P, LELL M M. CT perfusion in acute ischemic stroke:a comparison of 2-second and 1-second temporal resolution[J]. AJNR Am J Neuroradiol, 2011, 32: 1632-1639. DOI:10.3174/ajnr.A2576 |
| [18] |
MEIER P, ZIERLER K L. On the theory of the indicator-dilution method for measurement of blood flow and volume[J]. J Appl Physiol, 1954, 6: 731-744. DOI:10.1152/jappl.1954.6.12.731 |
 2019, Vol. 40


