2. 第二军医大学长海医院泌尿外科, 上海 200433;
3. 第二军医大学长海医院病理科, 上海 200433
2. Department of Urology, Changhai Hospital, Second Military Medical University, Shanghai 200433, China;
3. Department of Pathology, Changhai Hospital, Second Military Medical University, Shanghai 200433, China
磁共振成像(magnetic resonance imaging,MRI)因其良好的软组织对比及多参数的扫描方式,在前列腺癌早期诊断、病灶定位、预测Gleason评分、评估有无包膜及精囊侵犯、引导靶向穿刺、评估疗效等方面得到越来越广泛的应用[1, 2, 3, 4, 5, 6, 7]。这些应用的实现离不开功能磁共振成像技术的进步和发展,尤其是扩散加权成像(diffusion weighted imaging,DWI)。
DWI是一种在体无创测量组织水分子布朗运动的成像方式,并具有无需对比剂能反应出所检测组织的细胞密度、细胞膜完整性等优点[8, 9]。在临床上前列腺癌的诊断常联合DWI和T2WI,根据其信号及形态表现做出综合判断。但DWI的信号强度除与组织固有的生物学特征相关外,其最重要的影响因素即为所选择施加的扩散敏感梯度场大小——b值。目前临床上关于DWI在前列腺癌领域的应用中,b值的选择尚无统一定论。特别是3-T DWI在前列腺癌诊断的相关研究中,各研究单位所选择的b值差异显著,所报道的结果也不尽相同[10]。这种缺乏统一扫描标准的现状大大限制了DWI在前列腺癌诊断中的广泛运用。本研究采用多b值DWI针对前列腺癌进行研究,以磁共振超声融合靶向穿刺联合12针系统穿刺病理结果为金标准,通过测定不同b值下前列腺癌及正常组织的信号强度,探究3-T DWI显示前列腺癌的最优b值。
1 材料和方法 1.1 临床资料自2014年6月至2014年12月,前瞻性招募临床拟诊前列腺癌患者43例,患者年龄53~82岁,平均年龄(67.50±7.41)岁。所有患者均于穿刺前行包括常规T1WI、T2WI解剖成像及多b值DWI序列在内的MRI检查。
1.2 MR检查方法所有患者MRI检查均在Siemens Magnetom 3.0 T Skyra超导型成像仪上完成。射频发射采用内置体部线圈,磁共振信号接收采用体表线圈,体表线圈由腹部相控阵线圈与脊柱相控阵线圈组合而成。先行前列腺常规矢状面、冠状面及横断面的高分辨率T2WI及横断的T1WI扫描,而后行横断位单次激发平面回波成像DWI扫描。磁共振成像脉冲序列及主要参数详见表 1。
|
|
表 1 磁共振成像脉冲序列及主要参数 Tab 1 MRI protocols and sequence parameters |
所有患者在完成MRI检查后,由两名经验丰富的影像科医师共同读片,根据患者DWI和T2WI表现确定患者是否有可疑灶。如有则行磁共振超声融合靶向穿刺+12针系统穿刺,如无则行单纯12针系统穿刺。所有患者均先行靶向穿刺后行系统穿刺,排除系统穿刺出血对靶向穿刺的影响。所有穿刺病理放入预先标记好穿刺点的标本瓶中,交由病理科医师进行病理学检查。
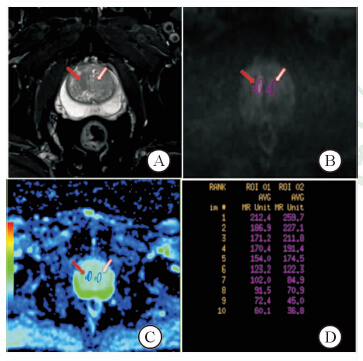
1.4 病理结果同影像的匹配及数据测量以病理结果为金标准,选定感兴趣区 (region of interest,ROI)。如靶向穿刺区为前列腺癌,则该区域即为癌灶ROI,如癌灶位于非靶向穿刺区域,则根据预先设置好的12针系统穿刺区域及穿刺阳性点与磁共振图像进行匹配,划定病灶ROI。正常组织的ROI根据病理结果避开肿瘤区和尿道组织选定,正常组织的ROI尽量选择在和癌灶同一扫描层面,如病灶层面全部为肿瘤组织,则调整至其他层面。ROI选定均使用GE公司多b值后处理平台,首先将包含10个b值的扩散加权成像序列导入该后处理平台,并根据病理结果调整显示病灶b值及窗位窗宽至最佳。于该图像下选定癌灶ROI,根据病理结果避开包含癌灶组织及尿道划定正常组织ROI,并测定各自ROI的信号强度,具体操作如图 1。

|
图 1 扩散加权成像上感兴趣区的划定 Fig 1 Region of interest on the diffusion weighted image A: Axial high resolution-T2WI,red arrow indicated the stripped T2 low signal intensity cancer area,white arrow indicated the normal area; B: Axial-DWI (b=1 500 s/mm2),red arrow indicated the cancer area,white arrow indicated the normal area; C: Standard ADC pseudocolor images,red arrow indicated the cancer area,white arrow indicated the normal area; D: Signal intensities of lesion and normal tissue with different b values |
采用SPSS 16.0软件进行数据分析,利用Wilcoxon Signed Ranks非参数配对检验分析不同b值病灶和正常组织信号强度是否具有显著性差异。利用受试者工作特征(receiver operating characteristics,ROC)曲线分析不同b值诊断效能,探究最优诊断效能b值,并计算曲线下面积(area under the curve,AUC)、诊断敏感性和特异性。检验水准(α)为0.05。
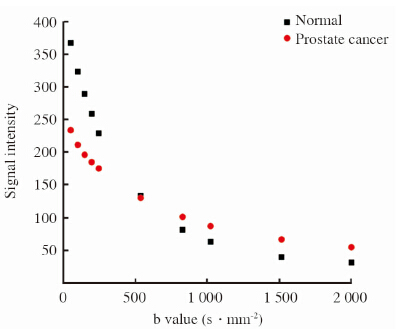
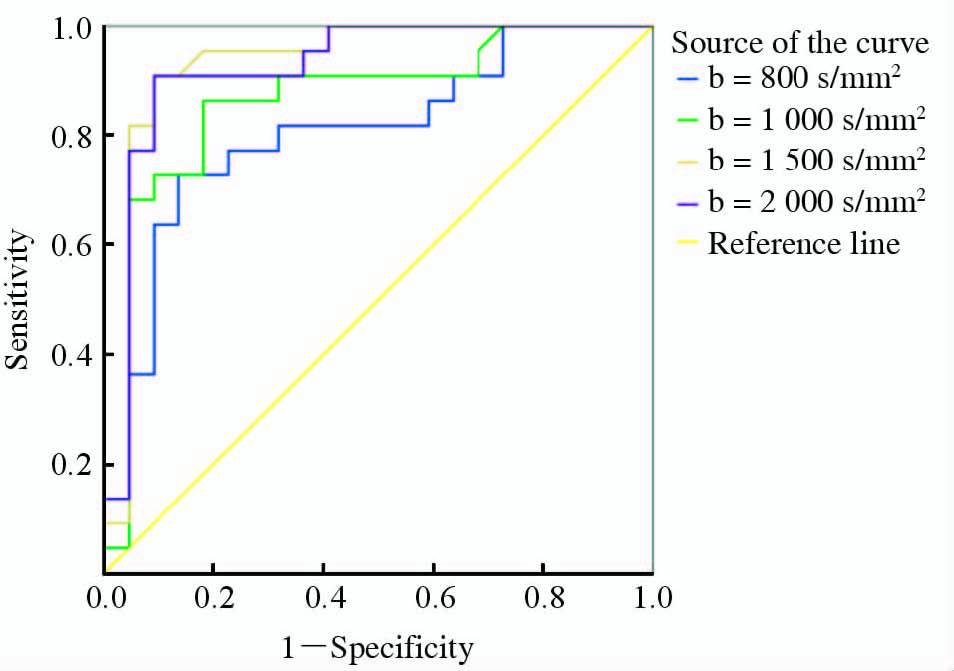
2 结 果入组的患者共43例,22例确诊为前列腺癌,16例为良性前列腺增生,5例为前列腺炎。在明确诊断为前列腺癌的22例患者中16例患者在b值为1 500 s/mm2的DWI显示病灶较为清晰,6例患者在b值为2 000 s/mm2 DWI显示病灶较为清晰。描述性统计分析提示癌灶及正常组织的信号强度均随着b值的不断增加出现衰减,在b值为500 s/mm2时信号衰减曲线出现交叉。b<500 s/mm2时正常组织信号相对较高,b>500 s/mm2病灶的信号逐渐高于正常组织(图 2)。 利用非参数Wilcoxon Signed Ranks将不同b值进行配对检验,评定不同b值下前列腺癌和正常组织的信号强度是否有差异(表 2),结果表明当b<500 s/mm2和b>500 s/mm2时差异均有统计学意义(P<0.01),当b=500 s/mm2时差异无统计学意义(P=0.236)。ROC分析提示b=200 s/mm2时AUC最小(0.719),诊断的信号强度的cut-off值为212.1,诊断的敏感性和特异性分别为0.591和0.955;b=1 500 s/mm2时AUC最大(0.933),诊断的信号强度cut-off值为49.2,诊断的敏感性和特异性分别为0.909和0.909。详见表 3及图 3。

|
图 2 正常前列腺组织和前列腺癌组织伴随b值不断增加的信号衰减曲线 Fig 2 Signal intensity attenuation curve of the normal prostate and prostate cancer tissues with the increase of b values |
|
|
表 2 正常前列腺组织和前列腺癌组织在不同b值扩散加权成像平均信号强度比较 Tab 2 Comparison of mean signal intensity of different b values between the normal prostate and prostate cancer tissues |
|
|
表 3 不同b值的ROC曲线诊断效能分析 Tab 3 ROC curve diagnostic performance analysis between different b values |

|
图 3 不同b值的ROC曲线 Fig 3 ROC curves between different b values ROC:Receiver operating characteristics |
DWI作为诊断前列腺癌的一种有效的MR功能成像方法,长期困扰我们的问题即为关键参数b值的选择。本研究结果表明随着b值的增加,前列腺癌组织和正常前列腺组织的信号强度均会出现衰减,但衰减的趋势有所不同,在b<500 s/mm2时正常前列腺组织信号相对较高,在b=500 s/mm2时前列腺癌组织和正常前列腺组织信号强度相当,在b>500 s/mm2时病灶信号强度逐渐高于正常前列腺组织。据此我们可以推断前列腺正常组织的信号强度在低b值时信号较高,是因低b值DWI存在较为明显的T2残留效应[11],而非组织中真正的水分子扩散状态。在低b值DWI中由于其T2残留效应的存在,我们无法将前列腺癌的T2低信号和诸如前列腺增生、慢性前列腺炎、前列腺瘢痕组织等前列腺良性疾病的T2低信号区分开来,因此本研究只选择在b值大于500 s/mm2的DWI中进行ROC分析。从分析结果可以看出,当b=1 500 s/mm2时AUC最大(0.933),诊断的敏感性和特异性分别为0.909和0.909,即b=1 500 s/mm2时,DWI具有显示前列腺癌病灶的最大能力。前人研究表明:b>1 000 s/mm2时,DWI大大消除了T2残留效应[11],因此在b=1 500 s/mm2能较好地反映组织内水分子的扩散状态。
Jie等[10]在针对DWI在前列腺癌诊断中的一项meta分析研究表明,DWI在前列腺癌的诊断中有着较高的准确性,但限制其临床广泛应用的主要原因是缺乏统一的扫描标准,这其中最重要的就是如何选择b值,因此探究DWI最优的b值就显得特别重要。Quentin等[12]在对前列腺癌DWI研究中指出,随着b值的增加,在前列腺组织中表现为相对高信号的病灶提示为前列腺癌的可能性比较大。依此我们可以看出,随着b值的增加,正常前列腺组织的信号衰减更快,而前列腺癌组织细胞密度相对较大,水分子扩散更加受限,故信号衰减相对较慢[8]。 该研究表明在DWI中可以单纯通过信号强度来判断前列腺组织的良恶性。但该研究中DWI仅选择了5个b 值 (0、250、500、750、1 000 s/mm2),未涉及高于1 000 s/mm2者,而本研究表明最佳诊断的b值为1 500 s/mm2。Metens等[13]通过运用多b值(0、1 000、1 500、2 000、2 500 s/mm2)方法对3.0 T MR DWI前列腺癌诊断研究分析也得出最优诊断b值为1 500 s/mm2,与本研究结果是一致的。Wang等[14]专门针对高b值扩散加权成像在前列腺癌诊断中的效能进行研究,b值设置为0、1 000、1 500及2 000 s/mm2。该研究也得出与我们一致的结论。但该两项研究的b值设置更加偏向于高b值,低于1 000 s/mm2的b值未涉及,因此未能发现诊断效能最差的b值。
综上所述,本研究表明采用DWI技术诊断前列腺癌时,癌灶的信号强度和癌旁正常组织的信号强度随着b值的提高呈现不同的衰减特征,在b值为500 s/mm2时癌灶和非癌灶信号强度最为接近,超过500 s/mm2后癌灶与非癌症组织的信号强度对比度逐渐加大,在b值为1 500 s/mm2时信号强度具有最佳诊断效能。
| [1] | Le J D,Tan N,Shkolyar E,Lu D Y,Kwan L,Marks L S,et al.Multifocality and prostate cancer detection by multiparametric magnetic resonance imaging: correlation with whole-mount histopathology[J].Eur Urol,2015,67: 569-576. |
| [2] | Hambrock T,Somford D M,Huisman H J,van Oort I M,Witjes J A,Hulsbergen-van de Kaa C A,et al.Relationship between apparent diffusion coefficients at 3.0-T MR imaging and Gleason grade in peripheral zone prostate cancer[J].Radiology,2011,259:453-461. |
| [3] | Kim C K,Park S Y,Park J J,Park B K.Diffusion-weighted MRI as a predictor of extracapsular extension in prostate cancer [J].AJR Am J Roentgenol,2014,202:W270-W276. |
| [4] | Soylu F N,Peng Y,Jiang Y,Wang S,Schmid-Tannwald C,Sethi I,et al.Seminal vesicle invasion in prostate cancer: evaluation by using multiparametric endorectal MR imaging [J].Radiology,2013,267:797-806. |
| [5] | Radtke J P,Kuru T H,Boxler S,Alt C D,Popeneciu I V,Huettenbrink C,et al.Comparative analysis of transperineal template saturation prostate biopsy versus magnetic resonance imaging targeted biopsy with magnetic resonance imaging-ultrasound fusion guidance[J].J Urol,2015,193:87-94. |
| [6] | Kim A Y,Kim C K,Park S Y,Park B K.Diffusion-weighted imaging to evaluate for changes from androgen deprivation therapy in prostate cancer [J].AJR Am J Roentgenol,2014,203:W645-W650. |
| [7] | Decker G,Mürtz P,Gieseke J,Träber F,Block W,Sprinkart A M,et al.Intensity-modulated radiotherapy of the prostate: dynamic ADC monitoring by DWI at 3.0 T[J].Radiother Oncol,2014,113:115-120. |
| [8] | Zelhof B,Pickles M,Liney G,Gibbs P,Rodrigues G,Kraus S,et al.Correlation of diffusion-weighted magnetic resonance data with cellularity in prostate cancer [J].BJU Int,2009,103:883-888. |
| [9] | Lang P,Wendland M F,Saeed M,Gindele A,Rosenau W,Mathur A,et al.Osteogenic sarcoma: noninvasive in vivo assessment of tumor necrosis with diffusion-weighted MR imaging[J].Radiology,1998,206:227-235. |
| [10] | Jie C,Rongbo L,Ping T.The value of diffusion-weighted imaging in the detection of prostate cancer: a meta-analysis [J].Eur Radiol,2014,24:1929-1941. |
| [11] | Geijer B,Sundgren P C,Lindgren A,Brockstedt S,Ståhlberg F,Holtås S.The value of b required to avoid T2 shine-through from old lucunar infarcts in diffusion-weighted imaging [J].Neuroradiology,2001,43:511-517. |
| [12] | Quentin M,Schimmöller L,Arsov C,Rabenalt R,Antoch G,Albers P,et al.Increased signal intensity of prostate lesions on high b-value diffusion-weighted images as a predictive sign of malignancy [J].Eur Radiol,2014,24:209-213. |
| [13] | Metens T,Miranda D,Absil J,Matos C.What is the optimal b value in diffusion-weighted MR imaging to depict prostate cancer at 3T? [J].Eur Radiol,2012,22:703-709. |
| [14] | Wang X,Qian Y,Liu B,Cao L,Fan Y,Zhang J J,et al.High b value diffusion-weighted MRI for the detection of prostate cancer at 3 T[J].Clin Radiol,2014,69:1165-1170. |
 2015, Vol. 36


