 2019, Vol. 37
扩展功能
文章信息
- 乔大伟, 王红亮
- QIAO DaWei, WANG HongLiang
- 基于粒度小波变换分析的四川盐源盆地沉积特征及其对盆地形成演化的指示意义
- Sedimentary Characteristics of the Yanyuan Basin in Southwest Sichuan Province based on Grain Size Wavelet Transform Data and Their Effects on Basin Evolution
- 沉积学报, 2019, 37(4): 713-722
- ACTA SEDIMENTOLOGICA SINCA, 2019, 37(4): 713-722
- 10.14027/j.issn.1000-0550.2018.165
-
文章历史
- 收稿日期:2018-04-02
- 收修改稿日期: 2018-09-02


新生代期间的印度—亚欧板块碰撞导致了区域地壳的变形、缩短加厚以及青藏高原的大幅度隆升[1-12],而板块碰撞引起的高原隆升则成为影响亚洲乃至全球气候环境变化的重要因素[13-21]。因此,印度—亚欧板块碰撞历史以及高原隆升的环境效应一直是国内外学者研究的热点。以前关于印度—亚欧板块碰撞过程及其动力学机制的研究主要集中在与之相关的大型断裂带,并取得了很多重要进展[22-26]。同时,在板块碰撞过程中,也形成了一系列与碰撞作用密切相关的沉积盆地,其形成演化对揭示板块碰撞及青藏高原阶段性隆升的历史同样具有重要的指示意义,因而也引起很多学者的高度关注[27-31]。
位于青藏高原东南缘的盐源盆地是在板块碰撞过程中形成的构造逸出盆地[27],是研究新生代期间印度—亚欧板块碰撞及青藏高原阶段性隆升历史的理想地区。前人通过大量钻孔资料的定性分析对盆地的沉积特征及其构造指示意义进行了初步探讨,认为盐源盆地是在中新世—上新世印度板块与亚欧板块碰撞过程中形成的,代表了晚新生代期间印度—亚欧板块一次重要的碰撞事件[27]。但是,由于受地层切割深度的限制,到目前为止还没有对盆地内完整沉积地层的时代开展过详细的研究工作,关于地层沉积特征的研究也需要通过更多数据的分析来深化相关认识。
本文对盐源盆地的完整沉积序列进行了粒度测试,并利用小波变换技术对粒度的时间序列进行了分析。根据小波变换曲线特征及时频色谱图,识别出不同次级的突变,分析了一级突变限定的三个阶段的粒度特征,确定了不同阶段的沉积相。在此基础上,结合区域构造分析,探讨了盆地演化与印度—欧亚板块碰撞及青藏高原阶段性隆升之间的关系。
1 盐源盆地的区域地质背景盐源盆地位于四川省的西南边缘,构造部位处于红河断裂带和鲜水河—小江断裂带之间的川滇地块(图 1)。该盆地是一个封闭的自流盆地,盆地内部海拔高度在2 320 m左右,四周为海拔超过3 000 m的高山。盆地形态不规则,近东西向展布,东西向延伸超过40 km,南北向宽约20 km。盐源断裂是控制盆地形成演化的重要断裂,该断裂位于盆地的南缘,呈近东西向延伸,北盘为下降盘,南盘为上升盘,地貌反差大,沿断裂带发育呈线性展布的冲洪积扇,扇头均向东偏移,是盐源断裂对扇体切割、错断的结果,说明盐源断裂为活动性断裂[27]。盆地周缘的主要岩石类型为志留系灰岩和粉砂岩、石炭系灰岩和粉砂岩、二叠系玄武岩、下三叠统海相复理石沉积、上三叠统陆相含煤碎屑岩、古新统—始新统海相复理石沉积,盆地内部主要为上新统及第四系含大量褐煤的陆相碎屑岩[28]。本文研究的地层是形成于盆地内部的上新统及第四系碎屑岩,充填地层具有南厚、北薄的特点,南部最厚可达640 m,北部地层厚度仅约13.5 m[27]。

|
| 图 1 盐源盆地构造位置图 Fig.1 Tectonic position of the Yanyuan Basin |
由于盐源盆地内部地层的后期切割较浅,所以很难通过天然露头获得上新世—第四纪期间形成的完整沉积序列样品。为此,在盆地南部地层沉积厚度较大的梅雨镇附近通过钻探获取了完整的岩芯,钻孔位置的GPS坐标为:27°26.1'N,101°22.1'E,岩芯总长度560 m。其中,上部的557.9 m为上新统—第四系地层,其下的2.1 m为三叠纪碎屑岩。上新统—第四系地层岩性以细颗粒的黏土和褐煤层为主,中间夹有多层细砂、粗砂及少量的砂砾石层,地层岩性柱状剖面如图 2a所示。

|
| 图 2 盐源盆地沉积地层柱状剖面(a)及粒度中值粒径记录(b) 1.砂砾石;2.粗砂;3.细砂;4.黏土;5.褐煤 Fig.2 Stratigraphic column (a) and grain size record (b) of the deposits in the Yanyuan Basin 1. sand gravel; 2. coarse sand; 3. fine sand; 4. clay; 5. Lignite |
磁性地层学研究表明,岩芯上部的557.9 m地层形成于上新世到早更新世,起止时间为5.4~1.8 Ma,磁性地层研究结果将另文发表。本次研究,我们按照10 cm的间距对整个序列进行了粒度测试。在样品的前处理过程中,首先加入10 mL 30%的H2O2,加热至140 ℃去除有机质;然后加入10 mL 10%的盐酸,加热至200 ℃去除碳酸盐;最后加入10 mL 0.05 mol/L的(NaPO3)6分散剂,并用超声波清洗机振荡10分钟后上机测量。样品测量在英国Marvern仪器有限公司生产的Mastersizer2000上完成,重复测量的相对误差 < 1%。除去砂砾石层及少部分无机碎屑颗粒含量极低的褐煤层样品无法在激光粒度仪上进行测试外,共获得了5 314个粒度数据,测试样品的最大间距不超过2 m,能够满足数据分析的要求。
3 盐源粒度数据的小波变换分析 3.1 小波变换的基本原理小波变换是由法国从事石油信号处理的工程师、地球物理学家Morlet在1974年首先提出的,为应用数学的一个分支。Morlet建立了最初的反演公式,但并未得到广泛认可,之后法国数学家Meyer和理论物理学家Grossman、法国学者Daubechies和Mallat对小波变换理论的发展及应用做出了重要贡献。
小波变换继承和发展了短时傅立叶变换局部化的思想,同时又克服了窗口大小不随频率变化等缺点,能够提供一个随频率改变的“时间—频率”窗口,是进行信号时频分析和处理的理想工具,其主要特点是通过变换能够充分突出问题在某些方面的特征。因此,小波变换在许多领域都得到了成功的应用,特别是小波变换的离散数据算法已被广泛用于许多问题的变换研究中。
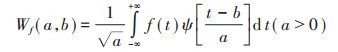
小波变换实质上就是将某一小波函数Ψ(t)的自变量t进行位移伸缩处理后,与需处理的原函数f(t)作内积,从而得到具有参数a(伸缩参数)和b(位移参数)的函数Wf(a, b),即:
通常Ψ(t)具有有限的支撑集,即在t的一个有限集合。例如,在[0, T]之外全都为0,记为suppΨ(t)=T。此时,上述积分只在包含b的视窗[b, aT+b]内部不等于0,而视窗的位置随b移动,其大小随a伸缩,因而将参数a定义为尺度因子,参数b定义为位移因子。另外,上述积分可以化成褶积,因此小波变换将视窗中的f(t)进行滤波处理,此滤波是一种带通滤波。尺度因子a越大频带越窄,视窗越大越模糊,对应信号的长周期分量,可用于划分长周期旋回;反之,尺度因子a越小频带越宽,视窗越小,分辨率越高,对应信号的短周期分量,可用于划分中、短及超短周期旋回。小波变换分析在信号异常点的检测和处理[32]、海洋学与气候学的分析[33]等众多领域都有很好的应用效果,特别是在测井数据分析与地层层序划分上得到了广泛的应用[34-45]。沉积学方面,自然界中一切复杂的沉积周期都是由多个不同级别的简单周期叠加而成,沉积旋回是沉积作用的周期性重复。因此,将能够反映沉积特征的原始数据进行小波变换处理后,可以显示总的频率结构,从而分析各个频率段之间的突变点或突变区域,反应在地质上就是沉积环境的突变。沉积物粒度变化是沉积特征的直接反应,因而应该能够很好地反应地层的旋回性、周期性特征。
3.2 盐源粒度数据的小波变换分析盐源盆地上新世—早更新世沉积序列中值粒径随深度变化曲线如图 2b所示。我们以磁性地层中极性转换点的年龄作为时间控制点,按照10 cm的间隔进行线性内插获得了本次研究所需要的时间标尺。在此基础上,在粒度中值粒径变化的时间序列(图 3)上进行了小波变换分析。本文中的小波变换图件,均是基于MATLAB软件中的Wavelet Design & Analysis插件制作的。

|
| 图 3 盐源盆地粒度中值粒径变化的时间序列 Fig.3 Time series of grain size variations for deposits in the Yanyuan Basin |
在对粒度数据进行小波变换的分析过程中,我们分别选取a = 256、a = 64、a = 32及a = 66四个不同尺度的曲线作为划分突变面的标准。其中,a = 256、a = 64及a = 32分别对应于沉积作用的一级突变、二级突变和三级突变,a = 66的小波变换曲线及小波系数的时频色谱图作为划分各级突变的辅助图件。
图 4为盐源粒度中值粒径时间序列的小波变换分析结果。在小波变换系数的时频色谱图中,横坐标为小波变换函数中的尺度因子a;纵坐标为采样点序数,可经换算转换为深度值(m),从而进一步转换为年代(Ma B.P.)。图 4中一系列的亮色、暗色像素点代表了在不同采样序数点处取不同的尺度因子a时小波变换系数值的不同,颜色由亮到暗代表了小波变换系数的由高到低。小波变换系数值是位移因子与尺度因子的函数,其值的大小揭示了小波函数与原始信号的相似程度,也可理解为原始信号与小波的协方差。粒度数据经小波变换后已经成为时间—尺度域二维空间的函数。在同一尺度因子上,相同的颜色代表着这一系列的沉积地层处于同一旋回。根据此原理,可以通过观察不同尺度因子上对应颜色的不同划分不同级次的旋回。图 4中左侧的四条曲线为不同尺度因子所对应的小波变换曲线,横坐标为小波变换系数值,其周期性反映了原始信号的周期性。因此,根据不同尺度因子的小波函数曲线特征,可达到在原始信号上划分不同级次突变面的目的。

|
| 图 4 盐源粒度中值粒径变化的小波变换分析结果 Fig.4 Wavelet transform results of grain size variations for deposits in the Yanyuan Basin |
在尺度a = 256的小波变换曲线上,根据曲线的振荡趋势结合时频色谱图,可以划分出2个一级突变,大致分别位于时间标尺的4.7 Ma和3.6 Ma处。从图 4可以看出,小波变换曲线在4.7 Ma之前表现为高幅震荡特征,在4.7~3.6 Ma表现为低幅震荡特征,在3.6 Ma之后表现为高幅震荡特征;时频色谱图的高尺度因子区域(即时频色谱图的右侧区域)在4.7 Ma之前表现为亮色像素点特征,在4.7~3.6 Ma表现为暗色像素点特征,在3.6 Ma之后则表现为亮色像素点特征。按照同样的划分原则,根据尺度a = 64时的小波变换曲线及时频色谱图可以划分出6个二级突变,大致分别位于时间标尺的5.3 Ma、3.1 Ma、2.7 Ma、2.5 Ma、2.1 Ma和1.9 Ma处;根据尺度a =32时的小波变换曲线及时频色谱图可以划分出6个三级突变,大致分别位于时间标尺的4.2 Ma、3.95 Ma、3.3 Ma、3.2 Ma、2.8 Ma和2.3 Ma处。
从盐源盆地上新世—早更新世沉积地层粒度小波变换的分析结果可以看出,小波变换能够直观地反映粒度变化中存在的潜在周期,在一定程度上克服了人工划分过程中人为因素的影响,为沉积界面的定量划分提供了一种有效方式。
4 粒度小波变分析对盆地演化的指示意义根据盐源粒度中值粒径小波分析得到的不同级次的突变反应了不同时间尺度和不同级别的构造、沉积环境的变化。其中,级别越高的突变对区域构造、环境变化的指示意义越明显。因此,本文重点通过粒度变化的一级突变并结合不同时段粒度分布特征的分析,对盐源盆地形成演化及其对区域构造的指示意义进行初步探讨。
4.1 一级突变不同阶段的粒度特征根据粒度小波变换的一级突变面,将盐源盆地上新世—早更新世沉积地层划分为上、中、下三段。为了揭示沉积环境变化和盆地的形成演化过程,我们对每一段的沉积相特征进行了分析。
沉积物的粒度分布特征可以反映搬运、沉积过程中的动力学特征[46-47]。在粒度分布的频率曲线上,通常把曲线中的高点称为峰(亦称众数),如果样品中只有一个峰,称为单峰,若有两个或两个以上的峰,则称为双峰或多峰。粒度分布范围窄且具有突出的单峰,说明沉积物分选较好,而峰态比较宽缓且所在粒级的百分比含量较低则反应了较差的分选性。不同搬运动力条件下形成的沉积物具有不同的粒度分布特征,因而使其成为沉积相划分的有效方法[48-52]。根据盐源盆地上新世—早更新世沉积序列典型样品的粒度分布特征分析,该序列上、中、下三段的沉积相特征如下所述。
下段(深度为557.9~418.2 m,时间跨度为5.4~ 4.7 Ma):该段主要为浅湖亚相,在粒度分布的频率曲线上(图 5a),主要表现为不对称的双峰分布特征,峰值区间较宽,碎屑颗粒分选一般,主要粒度组分的范围为10~100 μm。在中值粒径变化曲线中(图 2b、图 3)呈现下细上粗的反序列,中值粒径相对较大。在尺度a = 256的小波变换曲线上(图 4)则表现为高幅震荡的特征。

|
| 图 5 盐源盆地沉积相及盆地形成演化阶段划分 Fig.5 The sedimentary facies of the deposits in the Yanyuan Basin and the evolutionary stages of the basin |
中段(深度为418.2~233.8 m,时间跨度为4.7~ 3.6 Ma):该段主要为深湖、半深湖亚相。粒度频率曲线主要表现为单峰分布特征(图 5b),碎屑颗粒分选较好,峰值区的体积百分含量较高,粒度范围较窄,以粉细砂、黏土为主,主要粒度组分的分布范围为1~ 10 μm。该段粒度中值粒径整体上都很小(图 2b、图 3),在尺度a = 256时的小波变换曲线(图 4)上表现为低幅震荡特征。
上段(深度为233.8~0 m,时间跨度为3.6~ 1.8 Ma):该段主要为浅湖亚相、滨湖亚相或河流相沉积。浅湖亚相的粒度分布频率曲线与下段相类似,也具有明显的双峰分布特征(图 5c)。滨湖亚相与河流相沉积在粒度分布的频率曲线(图 5d)上很难区分,都具有明显的多峰分布特征。与浅湖亚相样品相比(图 5c),滨湖亚相或河流相样品中的粗粒级峰更加突出(图 5d),反映了较强的水动力条件。该段在中值粒径曲线上(图 2b、图 3)呈现多个下粗上细的正序列的叠加,整体上为下细上粗的反序列,中值粒径整体偏大。尺度a = 256时的小波变换曲线(图 4)与下段相似,呈现出高幅震荡的特征。
4.2 粒度一级突变对盆地形成演化的指示意义从盐源盆地上新世—早更新世沉积地层不同时段的沉积相分析可以看出,该序列为一套以湖泊、河流相沉积为主的地层。结合粒度中值粒径和小波变换的分析结果,盐源盆地上新世—早更新世沉积序列反应了水体由浅变深再变浅的过程,表明盆地经历了形成(5.4~4.7 Ma)、扩张(4.7~3.6 Ma)和萎缩充填(3.6~1.8 Ma)三个演化阶段。
已有研究表明[27],新近纪盐源盆地的形成是川滇地块向南东挤出过程中形成的构造逸出盆地,挤出作用使该区由原来的逆冲挤压状态转变为引张状态下的构造逃逸系统。尽管关于印度板块和亚欧板块在晚新生代碰撞演化的时间到目前为止还没有统一的认识,但是我们的研究结果可以为板块碰撞及高原隆升历史的研究提供有力证据。Wang et al.[22]的研究表明,鲜水河—小江断裂的初始活动至少发生在4 Ma以前;Roger et al.[23]的U-Pb和Ar40/Ar39测年结果显示鲜水河—小江断裂西北段的鲜水河断裂在12.8 Ma开始活动,Zhang et al.[24]的进一步研究表明鲜水河断裂在5~3.5 Ma也存在一期明显的活动;Wang et al.[25]的研究认为鲜水河—小江断裂的鲜水河段初始活动在13 Ma,而小江段的活动时间为5 Ma;元谋盆地的磁性地层研究表明元谋断裂(属于小江断裂系)的初始活动时间为5 Ma[29],而对小龙潭盆地的磁性地层研究结果则显示小江断裂的初始活动时间为13 Ma[30]。综合上述研究成果,我们认为13 Ma和5 Ma可能代表了晚新生代期间印度—欧亚板块两次重要的碰撞事件。因此,上新世早期盐源盆地的形成(5.4~4.7 Ma)应该对应于印度—亚欧板块的一次重要碰撞事件,而发生于3.6 Ma的沉积环境巨变则对应于青藏高原的一个重要隆升期[53-56]。
5 结论基于盐源盆地上新世—早更新世沉积粒度数据的小波变换分析结合不同时段地层的沉积相特征,得到以下几个方面的认识:
(1)小波变换能够直观地反映粒度变化的潜在周期,为沉积界面的定量划分提供了一种有效方式。根据小波系数值的周期震荡特征和时频色谱图,盐源盆地上新世—早更新世沉积地层可以划分出2个一级突变、6个二级突变和6个三级突变,这些突变反映了不同时间尺度构造、沉积环境的变化。
(2)对不同时段典型样品粒度分布特征的分析表明,该序列为一套以湖泊、河流相沉积为主的地层,结合粒度小波变换的一级突变,盐源盆地的形成演化可以划分为三个阶段:5.4~4.7 Ma是盆地的形成阶段,主要为浅湖亚相沉积,粒度总体较粗,在粒度小波变换曲线中表现为高幅震荡特征;4.7~3.6 Ma是盆地的扩张阶段,主要为深湖、半深湖亚相沉积,粒度总体较细,粒度小波变换曲线表现为低幅震荡特征;3.6~1.8 Ma为盆地的萎缩充填阶段,其沉积相和小波变换曲线特征与盆地的形成阶段相似。
(3)上新世早期盐源盆地的形成对应于印度—亚欧板块的一次重要碰撞事件,而发生于3.6 Ma的沉积环境巨变则对应于青藏高原的一个重要隆升期。
| [1] |
Molnar P, Tapponnier P. Cenozoic tectonics of Asia:Effects of a continental collision[J]. Science, 1975, 189(4201): 419-426. doi: 10.1126/science.189.4201.419 |
| [2] |
Tapponnier P, Molnar P. Active faulting and tectonics in China[J]. Journal of Geophysical Research, 1977, 82(20): 2905-2930. doi: 10.1029/JB082i020p02905 |
| [3] |
Tapponnier P, Peltzer G, Le Dain Ay, et al. Propagating extrusion tectonics in Asia:New insights from simple experiments with plasticine[J]. Geology, 1982, 10(12): 611-616. doi: 10.1130/0091-7613(1982)10<611:PETIAN>2.0.CO;2 |
| [4] |
Burke K, Sengör C. Tectonic escape in the evolution of the continental crust[M]//Barazangi M, Brown L. Reflection seismology: The continental crust. Washington DC: American Geophysical Union, 1986, 14: 41-53.
|
| [5] |
Houseman G, England P. Finite strain calculations of continental deformation:1. Method and general results for convergent zones[J]. Journal of Geophysical Research:Solid Earth, 1986, 91(B3): 3651-3663. doi: 10.1029/JB091iB03p03651 |
| [6] |
England P, Houseman G. Finite strain calculations of continental deformation:2. Comparison with the India-Asia collision zone[J]. Journal of Geophysical Research:Solid Earth, 1986, 91(B3): 3664-3676. doi: 10.1029/JB091iB03p03664 |
| [7] |
England P C, Houseman G A, Osmaston M F, et al. The mechanics of the Tibetan plateau[J]. Philosophical Transactions of the Royal Society A:Mathematical, Physical and Engineering Sciences, 1988, 326(1589): 301-320. doi: 10.1098/rsta.1988.0089 |
| [8] |
Peltzer G, Tapponnier P. Formation and evolution of strike-slip faults, rifts, and basins during the India-Asia collision:An experimental approach[J]. Journal of Geophysical Research:Solid Earth, 1988, 93(B12): 15085-15117. doi: 10.1029/JB093iB12p15085 |
| [9] |
Avouac J P, Tapponnier P. Kinematic model of active deformation in central Asia[J]. Geophysical Research Letters, 1993, 20(10): 895-898. doi: 10.1029/93GL00128 |
| [10] |
England P, Molnar P. Right-lateral shear and rotation as the explanation for strike-slip faulting in eastern Tibet[J]. Nature, 1990, 344(6262): 140-142. doi: 10.1038/344140a0 |
| [11] |
Yin A, Harrison T M. Geologic evolution of the Himalayan-Tibetan orogen[J]. Annual Review of Earth and Planetary Sciences, 2000, 28(1): 211-280. doi: 10.1146/annurev.earth.28.1.211 |
| [12] |
Tapponnier P, Xu Z Q, Roger F, et al. Oblique stepwise rise and growth of the Tibet Plateau[J]. Science, 2001, 294(5547): 1671-1677. doi: 10.1126/science.105978 |
| [13] |
Raymo M E, Ruddiman W F, Froelich P N. Influence of late Cenozoic mountain building on ocean geochemical cycles[J]. Geology, 1988, 16(7): 649-653. doi: 10.1130/0091-7613(1988)016<0649:IOLCMB>2.3.CO;2 |
| [14] |
Ruddiman W F, Kutzbach J E. Forcing of late Cenozoic northern hemisphere climate by plateau uplift in southern Asia and the American west[J]. Journal of Geophysical Research:Atmospheres, 1989, 94(D15): 18409-18427. doi: 10.1029/JD094iD15p18409 |
| [15] |
Broccoli A J, Manbe S. The effects of orography on mid-atitude northern hemisphere dry climates[J]. Journal of Climate, 1992, 5(11): 1181-1201. doi: 10.1175/1520-0442(1992)005<1181:TEOOOM>2.0.CO;2 |
| [16] |
Kutzbach J E, Prell W L, Ruddiman W F. Sensitivity of Eurasian climate to surface uplift of the Tibetan Plateau[J]. Journal of Geology, 1993, 101(2): 177-190. doi: 10.1086/648215 |
| [17] |
Flower B P, Kennett J P. Middle Miocene ocean-climate transition:High-resolution oxygen and carbon isotopic records from Deep Sea Drilling Project Site 588A, southwest Pacific[J]. Paleoceanography, 1993, 8(6): 811-843. doi: 10.1029/93PA02196 |
| [18] |
Ruddiman W F. Tectonic uplift and climate change[M]. New York: Plenum Press, 1997: 19-40.
|
| [19] |
Manabe S, Terpstra T B. The effects of mountains on the general circulation of the atmosphere as identified by numerical experiments[J]. Journal of the Atmospheric Sciences, 1974, 31(1): 3-42. doi: 10.1175/1520-0469(1974)031<0003:TEOMOT>2.0.CO;2 |
| [20] |
An Z S, Kutzbach J E, Prell W L, et al. Evolution of Asian monsoons and phased uplift of the Himalaya-Tibetan plateau since Late Miocene times[J]. Nature, 2001, 411(6833): 62-66. doi: 10.1038/35075035 |
| [21] |
Guo Z T, Ruddiman W F, Hao Q Z, et al. Onset of Asian desertification by 22 Myr ago inferred from loess deposits in China[J]. Nature, 2002, 416(6877): 159-163. doi: 10.1038/416159a |
| [22] |
Wang E, Burchefiel B C, Royden L H, et al. Late Cenozoic Xianshuihe-Xiaojiang, Red River, and Dali Fault systems of southwestern Sichuan and central Yunnan, China[J]. Geological Society of America Special Paper, 1998, 327: 1-108. |
| [23] |
Roger F, Calassou S, Lancelot J, et al. Miocene emplacement and deformation of the Konga -Shan granite (Xianshui He Fault Zone, West Sichuan, China):Geodynamic implications[J]. Earth and Planetary Science Letters, 1995, 130(1/2/3/4): 201-216. |
| [24] |
Zhang Y Q, Chen W, Yang N. 40Ar/39Ar dating of shear deformation of the Xianshuihe fault zone in west Sichuan and its tectonic significance[J]. Science China Series D:Earth Science, 2004, 47(9): 794-803. |
| [25] |
Wang S F, Fang X M, Zheng D W, et al. Initiation of slip along the Xianshuihe fault zone, eastern Tibet, constrained by K/Ar and fission-track ages[J]. International Geology Review, 2009, 51(12): 1121-1131. doi: 10.1080/00206810902945132 |
| [26] |
Wang Y J, Fan W M, Zhang Y H, et al. Kinematics and 40Ar/39Ar geochronology of the Gaoligong and Chongshan shear systems, western Yunnan, China:Implications for early Oligocene tectonic extrusion of SE Asia[J]. Tectonophysics, 2006, 418(3/4): 235-254. |
| [27] |
李勇, 侯中健, 司光影, 等. 青藏高原东南缘晚第三纪盐源构造逸出盆地的沉积特征与构造控制[J]. 矿物岩石, 2001, 21(3): 34-43. [Li Yong, Hou Zhongjian, Si Guangying, et al. Sedimentary characteristics and tectonic controls in Neogene Yanyuan tectonic escape basin in southeastern Qinghai-Tibet plateau[J]. Journal of Mineralogy and Petrology, 2001, 21(3): 34-43. doi: 10.3969/j.issn.1001-6872.2001.03.006] |
| [28] |
卢海建, 王二七, 李仕虎, 等. 青藏高原东南缘构造旋转变形分析:以四川盐源盆地古地磁研究为例[J]. 中国地质, 2015(5): 1188-1201. [Lu Haijian, Wang Erqi, Li Shihu, et al. Rotational deformation of the southeastern margin of Tibet:A paleomagnetic study of the Yanyuan Basin, Sichuan province[J]. Geology in China, 2015(5): 1188-1201. doi: 10.3969/j.issn.1000-3657.2015.05.002] |
| [29] |
Zhu R X, Potts R, Pan Y X, et al. Paleomagnetism of the Yuanmou Basin near the southeastern margin of the Tibetan Plateau and its constraints on Late Neogene sedimentation and tectonic rotation[J]. Earth and Planetary Science Letters, 2008, 272(1/2): 97-104. |
| [30] |
Li S H, Deng C L, Dong W, et al. Magnetostratigraphy of the Xiaolongtan Formation bearing Lufengpithecus keiyuanensis in Yunnan, southwestern China:Constraint on the initiation time of the southern segment of the Xianshuihe -Xiaojiang fault[J]. Tectonophysics, 2015, 655: 213-226. doi: 10.1016/j.tecto.2015.06.002 |
| [31] |
Li S H, Deng C L, Yao H T, et al. Magnetostratigraphy of the Dali Basin in Yunnan and implications for late Neogene rotation of the southeast margin of the Tibetan Plateau[J]. Journal of Geophysical Research, 2013, 118(3): 791-807. |
| [32] |
Mallat S, Hwang W L. Singularity detection and processing with wavelets[J]. IEEE Transactions on Information Theory, 1992, 38(2): 617-643. doi: 10.1109/18.119727 |
| [33] |
Meyers S D, Kelly B G, O'Brien J J. An introduction to wavelet analysis in oceanography and meteorology:with application to the dispersion of Yanai waves[J]. Monthly Weather Review, 1993, 121(10): 2858-2866. doi: 10.1175/1520-0493(1993)121<2858:AITWAI>2.0.CO;2 |
| [34] |
李霞, 范宜仁, 杨立伟, 等. 测井曲线小波变换特性在层序地层划分中的应用[J]. 大庆石油地质与开发, 2006, 25(4): 112-115. [Li Xia, Fan Yiren, Yang Liwei, et al. Application of wavelet inversion characteristics of logging curve in the classification of sequence stratigraphy[J]. Petroleum Geology & Oilfield Development in Daqing, 2006, 25(4): 112-115. doi: 10.3969/j.issn.1000-3754.2006.04.040] |
| [35] |
余继峰, 李增学. 测井数据小波变换及其地质意义[J]. 中国矿业大学学报, 2003, 32(3): 336-339. [Yu Jifeng, Li Zengxue. Wavelet transform of logging data and its geological significance[J]. Journal of China University of Mining & Technology, 2003, 32(3): 336-339. doi: 10.3321/j.issn:1000-1964.2003.03.029] |
| [36] |
马飞宙, 余继峰, 鲁静, 等. 测井数据小波变换在层序地层分析中的应用研究[J]. 中国煤炭地质, 2007, 19(4): 70-73. [Ma Feizhou, Yu Jifeng, Lu Jing, et al. An applied research on well logging data wavelet transform in sequence stratigraphic analysis[J]. Coal Geology of China, 2007, 19(4): 70-73. doi: 10.3969/j.issn.1674-1803.2007.04.024] |
| [37] |
王艳忠, 操应长, 远光辉. 小波分析在深水砂砾岩和泥页岩地层层序划分中的应用[J]. 天然气地球科学, 2012, 23(2): 251-258. [Wang Yanzhong, Cao Yingchang, Yuan Guanghui. Application of wavelet analysis in sequence division of deepwater glutenite and shale layer[J]. Natural Gas Geoscience, 2012, 23(2): 251-258.] |
| [38] |
阎辉, 李鲲鹏, 张学工, 等. 测井曲线的小波变换特性在自动分层中的应用[J]. 地球物理学报, 2000, 43(4): 568-573. [Yan Hui, Li Kunpeng, Zhang Xuegong, et al. Wavelet transform properties of well log and their application in automatic segmentation[J]. Chinese Journal of Geophysics, 2000, 43(4): 568-573. doi: 10.3321/j.issn:0001-5733.2000.04.018] |
| [39] |
王亚辉, 赵鹏肖, 左倩媚, 等. 测井信号小波变换在层序地层划分中的应用:以南海北部莺歌海盆地D14井黄流组为例[J]. 沉积与特提斯地质, 2011, 31(4): 58-63. [Wang Yahui, Zhao Pengxiao, Zuo Qianmei, et al. An application of the wavelet transformation to sequence stratigraphy:A case study of the Huangliu Formation in the Yinggehai Basin, northern South China Sea[J]. Sedimentary Geology and Tethyan Geology, 2011, 31(4): 58-63. doi: 10.3969/j.issn.1009-3850.2011.04.009] |
| [40] |
房文静, 范宜仁, 李霞, 等. 基于测井数据小波变换的准层序自动划分[J]. 吉林大学学报(地球科学版), 2007, 37(4): 833-836. [Fang Wenjing, Fan Yiren, Li Xia, et al. Parasequence automatical partition based on wavelet transform of logging data[J]. Journal of Jilin University (Earth Science Edition), 2007, 37(4): 833-836.] |
| [41] |
付文钊, 余继峰, 杨锋杰, 等. 小波变换与Hilbert-Huang变换应用于层序划分的比较[J]. 煤炭学报, 2013, 38(增刊2): 434-441. [Fu Wenzhao, Yu Jifeng, Yang Fengjie, et al. Comparative study of the application of wavelet transform and Hilbert-Huang transform to the demarcation of sequences[J]. Journal of China Coal Society, 2013, 38(Suppl2): 434-441.] |
| [42] |
王辉, 黎明碧, 唐勇, 等. 基于小波变换的ODP1148A井测井层序地层研究[J]. 地球物理学进展, 2015, 30(2): 672-680. [Wang Hui, Li Mingbi, Tang Yong, et al. Logging sequence stratigraphy study of ODP hole 1148A logging based on wavelet transform[J]. Progress in Geophysics, 2015, 30(2): 672-680.] |
| [43] |
朱剑兵, 纪友亮, 赵培坤, 等. 小波变换在层序地层单元自动划分中的应用[J]. 石油勘探与开发, 2015, 32(1): 84-86. [Zhu Jianbing, Ji Youliang, Zhao Peikun, et al. Application of wavelet transform in auto-identify units of stratigraphy sequence[J]. Petroleum exploration and Development, 2015, 32(1): 84-86.] |
| [44] |
李占东, 刘赛, 王海生. 小波时频变换应用于层序划分:以XB地区为例[J]. 地球物理学进展, 2014, 29(2): 774-779. [Li Zhandong, Liu Sai, Wang Haisheng. Application of wavelet time frequency transform in strata sequence division-Take XB areas as an example[J]. Progress in Geophysics, 2014, 29(2): 774-779.] |
| [45] |
杨宁, 王贵文, 赖锦, 等. 应用伽马测井曲线小波变换计算粒度参数[J]. 现代地质, 2012, 26(4): 778-783. [Yang Ning, Wang Guiwen, Lai Jin, et al. Application of gamma curves wavelet transform to calculate grain size parameters[J]. Geoscience, 2012, 26(4): 778-783. doi: 10.3969/j.issn.1000-8527.2012.04.020] |
| [46] |
Doeglas D J. Grain-size indices, classification and environment[J]. Sedimentology, 1968, 10(2): 83-100. doi: 10.1111/j.1365-3091.1968.tb01101.x |
| [47] |
Visher G S. Grain size distributions and depositional processes[J]. Journal of Sedimentary Research, 1969, 39(3): 1074-1106. |
| [48] |
何华春, 丁海燕, 张振克, 等. 淮河中下游洪泽湖湖泊沉积物粒度特征及其沉积环境意义[J]. 地理科学, 2005, 25(5): 590-596. [He Huachun, Ding Haiyan, Zhang Zhenke, et al. Grain-size characteristics and their environmental significance of Hongze Lake sediments[J]. Scientia Geographica Sinica, 2005, 25(5): 590-596. doi: 10.3969/j.issn.1000-0690.2005.05.013] |
| [49] |
李继彦, 董治宝, 李恩菊, 等. 察尔汗盐湖雅丹地貌沉积物粒度特征研究[J]. 中国沙漠, 2012, 32(5): 1187-1192. [Li Jiyan, Dong Zhibao, Li Enju, et al. Grain-size characteristics of the deposits from Yardang Landforms in the Charhan salt lake area[J]. Journal of Desert Research, 2012, 32(5): 1187-1192.] |
| [50] |
范天来, 范育新. 频率分布曲线和概率累积曲线在沉积物粒度数据分析中应用的对比[J]. 甘肃地质, 2010(2): 32-37. [Fan Tianlai, Fan Yuxin. A comparison of grain size expression methods:A case study[J]. Gansu Geology, 2010(2): 32-37.] |
| [51] |
殷志强, 秦小光, 吴金水, 等. 中国北方部分地区黄土、沙漠沙、湖泊、河流细粒沉积物粒度多组分分布特征研究[J]. 沉积学报, 2009, 27(2): 343-351. [Yin Zhiqiang, Qin Xiaoguang, Wu Jinshui, et al. The multimodal grainsize distribution characteristics of loess, desert, lake and river sediments in some areas of northern China[J]. Acta Sedimentologica Sinica, 2009, 27(2): 343-351.] |
| [52] |
李华勇, 张虎才, 陈光杰, 等. 云南高原湖泊表层沉积物粒度特征及环境指示意义[J]. 沉积学报, 2017, 35(3): 499-507. [Li Huayong, Zhang Hucai, Chen Guangjie, et al. The grain size distribution characteristics of surface sediments from plateau lakes in Yunnan province and their environmental significances[J]. Acta Sedimentologica Sinica, 2017, 35(3): 499-507.] |
| [53] |
Li J, Fang X M, van der Voor R, et al. Late Cenozoic magnetostratigraphy (11-0 Ma) of the Dongshanding and Wangjiashan sections in the Longzhong Basin, western China[J]. Geologie en Mijnbouw, 1997, 76(1/2): 121-134. doi: 10.1023/A:1003153717799 |
| [54] |
Amano K, Tarira A. Two-phase uplift of higher Himalayas since 17 Ma[J]. Geology, 1992, 20(5): 391-394. doi: 10.1130/0091-7613(1992)020<0391:TPUOHH>2.3.CO;2 |
| [55] |
施雅风, 李吉均, 李炳元. 青藏高原晚新生代隆升与环境变化[M]. 广州: 广东科技出版社, 1998. [Shi Yafeng, Li Jijun, Li Bingyuan. Uplift and environmental changes of Qinghai-Xizang (Tibetan) Plateau in the Late Cenozoic[M]. Guangzhou: Guangdong Science & Technology Press, 1998.]
|
| [56] |
Wang G C, Kai C, Zhang K X, et al. Spatio-temporal framework of tectonic uplift stages of the Tibetan Plateau in Cenozoic[J]. Science China Earth Science, 2011, 54(1): 29-44. doi: 10.1007/s11430-010-4110-0 |