Parkinson's disease (PD) is currently the second most common neurodegenerative disorder of the central nervous system with causes unknown, and its most obvious motor symptoms are shaking, rigidity, hypokinesia, abnormal gait, while its classical pathologic features include early death of dopaminergic neurons in the substantia nigra (SN) and presence of Lewy bodies. So far, there is no cure for PD though some treatments, like medicine and physical surgery, can improve symptoms temporarily. And the diagnosis of PD heavily relies on the medical history and neurobehavioral examination, and the most routine method is grading based on clinical manifestation, the early diagnostic accuracy of which is less than 75%. Moreover, this subjective diagnostic procedure is quietly experience-dependent for physicians. It's clinically meaningful for the determination of treatment protocols and the evaluation of healing efficacy to find biomarkers that could be used to objectively assess the progress of PD.
With high spatial resolution and excellent tissue contrast, magnetic resonance imaging (MRI) is one useful tool for functional and molecular imaging, and is widely applied to the study of PD. In 1986, Duguid et al.[1] found that the SN compacta of PD patients significantly become narrower compared to the healthy elderly via MRI T2-weighted images. In 2011, Baudrexel et al.[2] revealed that the subthalamic cortex-striatum connectivity of PD patients in bilateral prefrontal lobe decreased with the help of resting-state functional MRI (fMRI) while the volume of their striatum and cortex thickness didn't alter significantly. In 2012, the fractional anisotropy (FA) of PD patients' SN from diffusion tensor imaging (DTI) was found decreased compared to the healthy controls[3] and Langkammer et al.[4] confirmed the presence of ion accumulation in SN using quantitative susceptibility mapping (QSM). Some studies[5, 6] based on magnetization transfer contrast imaging showed a significant change of magnetic transfer ratio (MTR) in PD patients' SN and basal ganglia. Although these methods are valuable for further study of PD, none of these fMRI techniques could be served as a golden standard for diagnosis.
As an emerging molecular imaging modality, chemical exchange saturation transfer (CEST) imaging has proven its own value in the study of cerebral ischemia[7], gliomas[8, 9], tissue pH quantification[10] and nuclear Overhauser effect (NOE)[11]. In 2014, Li et al.[12] in Beijing hospital firstly applied the amide proton transfer (APT) imaging to the study of PD patients and the results suggested that CEST signal from endogenous amide proton could be helpful in diagnosis of PD. In further studies[13], APT had shown its potential in grading of PD progress which performed better than DTI. Bagga et al.[14] from University of Pennsylvania found that GluCEST signals of striatum and motor cortex of subacute 1-methyl-4-phenyl-1, 2, 3, 6-tetrahydropyridine (MPTP)-induced mice strengthened in comparison with that of control group, which agreed with the magnetic resonance spectroscopy (MRS) results.
The quantification used in the studies mentioned above was mainly based on Z-spectrum asymmetry analysis. However, it could be easily interfered by direct saturation (DS), asymmetric magnetization transfer (MT) and NOE effects. In our study, we compared the analysis method based on Z-spectrum asymmetry with that one combining 5-pool Lorentzian fitting with inverse Z-spectrum analysis, and discussed the possible source of CEST signal at δ 2.0 of the acute MPTP-induced PD model mice.
1 Materials and methods 1.1 Acute MPTP-induced PD mice modeling 1.1.1 Experimental animalsAll male C57BL/6 mice (6~8 weeks, 20~25 g) were procured from the experimental animal center of Southern Medical University (SMU), and housed for a week before MPTP administration. The Institutional Animal Care and Use Committee (IACUC) of SMU approved all the experimental protocols in our study.
1.1.2 ReagentsMPTP (purity≥98%, Sigma) were purchased from Beijing Zhongchenjingnian Technology Co., Ltd. and 0.9% (w/v) normal saline was purchased Guangzhou Xindai Bio-Tec. Co., Ltd. Chloral hydrate (purity≥99%, Energy Chemical), paraformaldehyde (purity≥95%, Alfa), acetone (purity≥99.5%, Xilong Scientific Co., Ltd.), phosphate buffer solution (PBS, Beyotime), hydrogen peroxide (Amersco), methanol (purity≥99.5%, Macklin), goat serum (Beyotime), anti-TH rabbit polyclonal antibody (BBI), IgG secondary antibody (Abnova), herseradis peroxidase (BIOSS), 3'3-diaminobenzidine HCL (purity≥99%, MCE) and xylene (purity≥99%, Macklin) were acquired via CASMART.
1.1.3 The PD mice modelingAll mice were randomly divided into two groups. PD group: n=12, received MPTP (20 mg/kg), via intraperitoneal injection four times in 24 h with an interval of 2 h at least; control group: n=6, received the same volume of normal saline solution for the same period.
1.1.4 Perfusion fixation and tyrosine hydroxylase (TH) immunohistochemical analysis in SN of miceThe SN of each mouse was tested immunohistochemically so that we could evaluate the PD establishing efficacy via the loss of dopaminergic neurons and compared it with the results quantified by CEST. The detailed procedures were as follows: firstly, we anaesthetized mice deeply and intraperitoneally with 0.3 mL 4% chloral hydrate solution, performed left ventricular intubation and cut right atrium to outpour heart blood, then perfused with saline solution until liver became white to make sure blood fully drained. Then we fixed it with 50 mL 4% paraformaldehyde for 20~30 min. After the mice brain were wholly taken out, we put it into 4% paraformaldehyde. We kept the brain slice at room temperature for 1 h and then stored in acetone for 10 min, then washed it with PBS for 3~4 times (5 min per time). Then incubated in 3% hydrogen peroxide plus 60% methanol for 5 min, and washed with PBS for 15 min, blocked with 5% (v/v) goat serum for 30 min at room temperature. Added in 1:200 diluted anti-TH rabbit-mouse polyclonal antibody and incubated for 2 h at 37 ℃; removed primary antibody and then washed with PBS. Then we dropped IgG secondary antibody and incubated for 1 h at 37 ℃; after washed for several times with PBS (5 min per time), we mixed operating fluid with herseradis peroxidase (HRP), incubated for 30 min at 37 ℃ and washed again with PBS; dysphotic colored with 3'3-diaminobenzidine HCL (DAB) at room temperature and washed slowly with pure water. We then applied gradient alcohol hydration, cleared with xylene and dried naturally before coverslipping with neutral balsam. Besides replacing the primary antibody with goat serum, the process of control group stayed unchanged as the PD group.
1.2 MRI data acquisitionBruker 7 T MRI scanner performed scan schemes on mice before and at the 3rd, 10th day after PD model establishment. Three sequences naming continuous wave (CW)-CEST sequences, inversion-recovery (IR) sequences and multi-slice multi-echo (MSME) sequences, were involved.
CW-CEST consisted of a rectangular continuous wave saturation pulse for the 49 offset frequencies from -1 200 to 1 200 Hz (the interval was 50 Hz) and the rapid acquisition with relaxation enhancement (RARE) sequence. The sequence parameters were as follows: radio-frequency (RF) magnetic field amplitude=2 μT, saturation time=3 s, repetition time (TR)=5 s, echo time (TE)=4 ms, slice thickness=1.7 mm, field of view (FOV) = 13×12 mm2, matrix size=130×110, RARE factor=23, averages=2. The M0 images were acquired at 30 000 Hz. Z-spectra were B0 corrected using a water saturation shift referencing (WASSR) map. It required the same CEST sequence mentioned above for 17 offset frequencies from -150 to 150 Hz, and the parameters were as follows: RF magnetic field amplitude=0.5 μT, saturation time=500 ms, the others remained unchanged.
T1 fitted values were obtained from the IR sequence, and the TR were set as 5 500, 3 000, 1 500, 800, 400, 200, 117.859 ms. And T2 fitted values were obtained from MSME sequence (TE = 9.5~237.5 ms). The resolution of all images stayed the same.
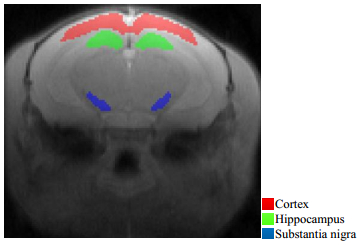
1.3 Choosing the region of interest (ROI) of the mice brainExperienced physicians conducted all the drawing of cortex, hippocampus and SN in mice brain (Fig. 1) via ITK-SNAP without telling the actual grouping of mice on the M0 images.
|
Fig. 1 ROIs of cortex, hippocampus and substantia nigra (SN) of mice brain M0 image |
The idea of magnetization transfer ratio based on asymmetry analysis (MTRasym) is borrowed from magnetization transfer contrast (MTC) imaging, and it is given by:
| $ MT{R_{{\rm{asym}}}} = 1 - \frac{{{M_z}(\mathit{\Delta }\omega )}}{{{M_z}( - \mathit{\Delta }\omega )}} $ | (1) |
Or
| $ MT{R_{{\rm{asym}}}} = \frac{{{M_z}( - \mathit{\Delta }\omega )}}{{{M_0}}} - \frac{{{M_z}(\mathit{\Delta }\omega )}}{{{M_0}}} = Z( - \mathit{\Delta }\omega ) - Z(\mathit{\Delta }\omega ) $ | (2) |
where
The theoretical analysis of BM equations by Zaiss et al.[15, 16] told that all CEST effects can be approximated by Lorentzian functions in the Z-spectrum and they are cumulative. Then they combined it with inverse Z-spectrum analysis based on the eigenspace theory and came up with the magnetization transfer ratio yielding Rex(MTRrex):
| $ MT{R_{{\rm{rex}}}} = \frac{1}{{{Z_{{\rm{lab}}}}}} - \frac{1}{{{Z_{{\rm{ref}},\,j}}}} $ | (3) |
where Zlab is the fitted Z-spectrum containing all pools and Zref, j refers to the fitted Z-spectrum of all pools except pool j. And these two can be acquired by 5-pool Lorentzian fitting:
| $ Z(\mathit{\Delta }\omega ) = \frac{{{M_z}(\mathit{\Delta }\omega )}}{{{M_0}(\mathit{\Delta }\omega )}} = {Z_{{\rm{base}}}} - \sum\limits_i {{L_i}} (\mathit{\Delta }\omega ) $ | (4) |
| $ {L_i}(\mathit{\Delta }\omega ) = {A_i}\frac{{\frac{{\mathit{\Gamma }_i^2}}{4}}}{{\frac{{\Gamma _i^2}}{4} + {{(\mathit{\Delta }\omega - {\delta _i})}^2}}} $ | (5) |
| $ Z{}_{{\rm{lab}}}(\mathit{\Delta }\omega ) = {Z_{{\rm{base}}}} - \sum\limits_i^{n = 5} {{L_i}} (\mathit{\Delta }\omega ) $ | (6) |
| $ Z{}_{{\rm{ref}}{\kern 1pt} {\rm{, }}j}(\mathit{\Delta }\omega ) = {Z_{{\rm{base}}}} - \sum\limits_{i \ne j}^{n = 5} {{L_i}} (\mathit{\Delta }\omega ) $ | (7) |
where i varies from 1 to 5 and they represent water pool, amide pool, NOE pool, MT pool and amine pool, respectively. The Lorentzian function Li of pool i is defined for the offset frequency Δω by amplitude Ai, full width at half maximum (FWHM) Γi and displacement from the frequency of free water protons δi. Zbase is used for the compensation of the constant signal loss. Meanwhile Zaiss found that MTRrex is linearly proportional to T1 under irradiation of continuous wave RF pulse and then came up with the apparent exchange-dependent relaxation (AREX):
| $ AREX = \frac{{MTR{}_{{\rm{rex}}}}}{{{T_1}}} $ | (8) |
Moreover, we calculated the integral of fitted Lorentzian functions of amide (δ 3.3~3.7, Areaamide) and amine (δ 1.8~2.2, Areaamine):
| $ Are{a_{{\rm{amide}}}} = \int_{{\kern 1pt} 3.3}^{3.7} {{L_{{\rm{amide}}}}} {\rm{d}}\omega $ | (9) |
| $ Are{a_{{\rm{amine}}}} = \int_{{\kern 1pt} 1.8}^{2.2} {{L_{{\rm{amine}}}}} {\rm{d}}\omega $ | (10) |
where Lamide and Lamine above refer to the Lorentzian functions of amide (the center resonance frequency is δ 3.5) and amine (δ 2.0).
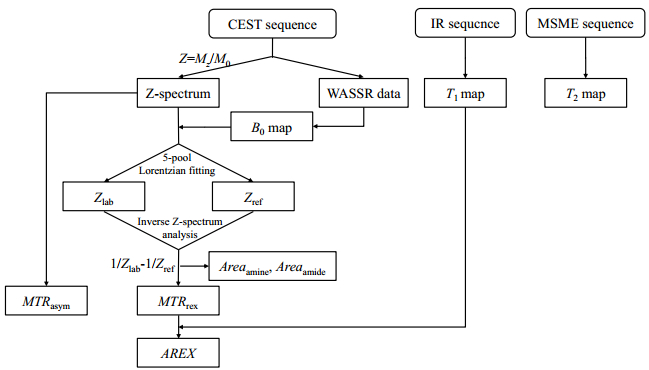
1.4.3 Processing and analysisAll images processing and data analysis was conducted with Matlab by self-written software, and the specific procedures of data process were shown in Fig. 2. The start values and boundaries of each pool were recorded in Table 1. For all results, a paired t test was used compare between different experience time points of PD group and control group via SPSS V22.0 and the difference is considered to be significant for p < 0.05.
|
Fig. 2 The scheme of data processing |
| Table 1 Starting values and boundaries for Lorentzian fitting |
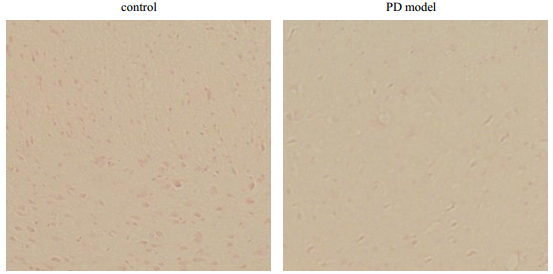
The number of TH positive neurons was significantly reduced (Fig. 3) in PD mice compared to the control group which indicated the significant loss of SN dopaminergic neurons. The results suggested the establishment of MPTP-induced PD model mice has been done successfully.
|
Fig. 3 The TH immunohistochemical analysis in SN of control and PD model mice |
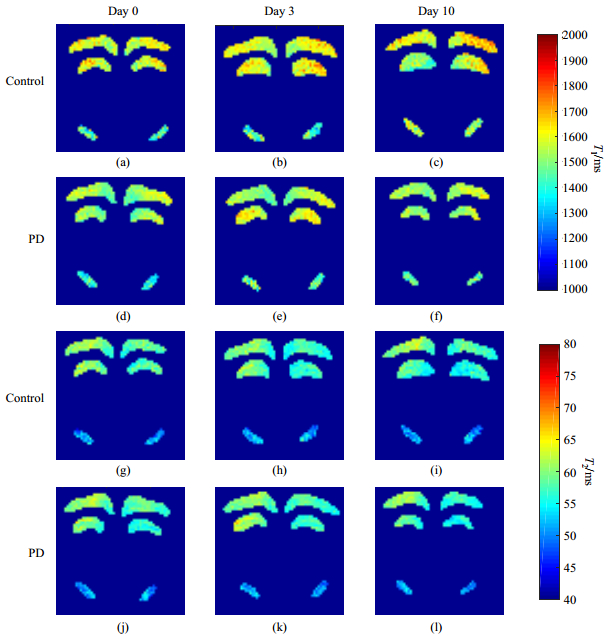
The T1 and T2 values of acute PD mice and control group at day 0 (before MPTP injection of PD group), day 3 (the 3rd day after MPTP injection) and day 10 (the 10th day after MPTP injection), were recorded in Table 2, and the T1 and T2 map of three brain regions in Fig. 4 were acquired at different time points.
| Table 2 T1 and T2 values of PD mice and control group at day 0, day 3 and day 10 |
|
Fig. 4 (a)~(f) T1 maps; (g)~(l) T2 maps |
With no significant alteration in T1 value of SN between day 0 and day 3, T1 of cortex and hippocampus of PD group increased without significance. And its T2 values of these three regions shown no significant changes between day 0 and day 3. Similarly, the rising T1 values of SN between day 0 and day 10 showed no significance while no significant changes in cortex and hippocampus. And three regions of PD group showed no significant alterations between day 3 and day 10. As for the control group, the T1 and T2 values of SN, cortex and hippocampus showed no significant difference.
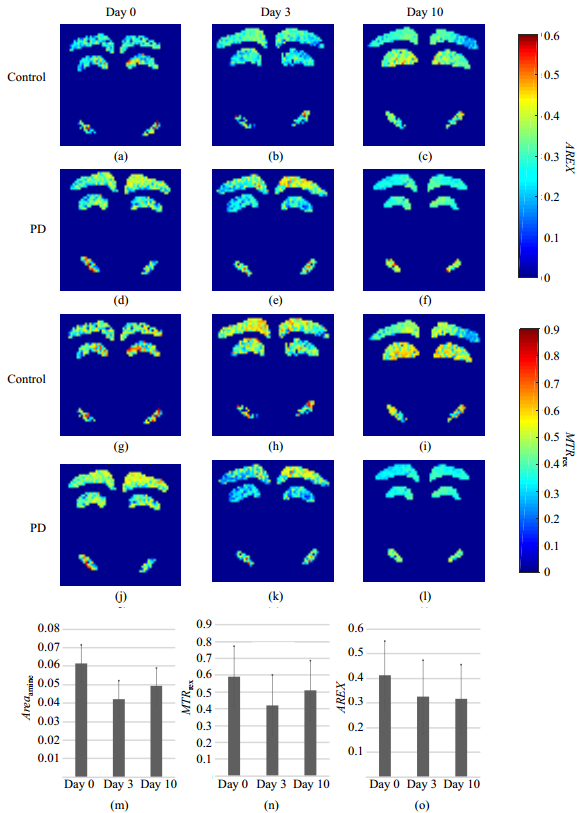
2.3 CEST quantification of cortex, hippocampus and SN in miceWe performed 5-pool Lorentzian fitting pixel by pixel on the acquired data and excluded pixels, of which the goodness of fitting was less than 90%. AREX and MTRrex map of these regions of both groups at three time points were shown in Fig. 5.
|
Fig. 5 (a)~(f) AREX maps, (g)~(l) MTRrex maps, and (m)~(o) the values of Areaamine, MTRrex and AREX at day 0, day 3 and day 10 in SN of PD mice |
In SN, MTRrex, Areaamine and AREX of PD mice decreased significantly not only between day 0 and day 3, but also between day 0 and day 10 (Table 3), while MTRasym and Areaamide showed no significant alterations. Between day 3 and day 10, no significant changes were found in the five metrics of PD mice mentioned above. In control group, no significant changes were observed in these five metrics between different time points.
| Table 3 Different quantification values in SN of mice |
As for cortex, Areaamide, Areaamine and MTRrex of PD mice decreased without significance not only between day 0 and day 3 but also between day 0 and day 10 (Table 4), while no obvious changes in MTRasym were observed. Meanwhile metrics mentioned above in PD mice showed no changes between day 3 and day 10. In control group, these metrics showed no significant alterations between different time points.
| Table 4 Different quantification values in cortex of mice |
As for hippocampus, reduction with significance was found in Areaamine and MTRrex in PD group between day 0 and day 3, and also between day 0 and day 10 (Table 5), while MTRasym, Areaamide and AREX dropped with no significance. All metrics in PD mice showed no significant changes between day 3 and day 10. In control group, changes of hippocampus in these five metrics between different time points were not significant.
| Table 5 Different quantification values in hippocampus of mice |
We studied the quantification of CEST signal at δ 2.0 of acute MPTP-induced PD mice's SN in this paper and compared the Z-spectrum asymmetry analysis method with that one based on the combination of 5-pool Lorentzian fitting and inverse Z-spectrum analysis.
After intraperitoneally administration of MPTP solution to mice, monoamine oxidase B (MAO B) turns the MPTP to 1-methyl-4-phenylpyridiniumion (MPP+). Then MPP+ passes the blood-brain barrier and causes the great loss of dopaminergic neurons in SN, which damages the function of nigrostriatal pathway and hence the onset of PD-like symptoms in mice.
The results from our experiments suggested that the T1 and T2 value of SN, cortex and hippocampus in mice's brain show no significant alteration after acute MPTP-induced mice establishment, which is consistent with earlier studies[17].
After the MRI scan of control and PD mice group at multiple time points with CEST sequence, we found that MTRrex and AREX derived from the combination of 5-pool Lorentzian fitting and inverse Z-spectrum analysis are more sensitive in the detection of SN changes than metrics based on Z-spectrum asymmetry analysis, the causes of which is as follows: 1) The CEST, NOE and DS effects that mixes in Z-spectrum are not always symmetry to the resonance offset of free water. 2) MT effect crosses all over the Z-spectrum and its asymmetry becomes worse with increasing B1. 3) Signals with close resonance frequency in the Z-spectrum would overlap which makes them hard to distinguish. 4) Quantification metrics based on Z-spectrum asymmetry are easily affected by T1 relaxation. In our study, the applied B0 and B1 were strong, which surely aggravated the asymmetry of MT and DS effects, and the NOE effect on the other side of Z-spectrum which originated from the mobile proteins became clearer. Therefore, simple Z-spectrum asymmetry quantification metrics, MTRasym, would be inevitably contaminated by these effects and these overlapping signals and T1 relaxation of each pool worsened this situation. It indicated that MTRasym may not function well in vivo.
However, the direct application of multi-pool Lorentzian fitting of Z-spectrum would bring some problems. The assumption of no interaction between different pools is not valid in general especially when it comes to high RF pulse amplitude and high exchange rate[18], and the fitted Lorentzian curves wrongly strengthen the signal close to δ 0. Another drawback of this method is that the physical basic of the fitted parameters is hard to interpret. Researchers therefore developed one new quantification metrics, MTRrex, by combining it with inverse Z-spectrum analysis. Theoretically, this method can eliminate interference from T2 relaxation, DS and MT effects in quantifying CEST signals[15], and MTRrex is mainly about the flip angle of effective angle, T1 and Rex[19] (the exchange-dependent relaxation rate in the rotating frame) while AREX, in addition, can greatly correct for T1 relaxation. Generally this analysis method would perform better in quantifying CEST effects in vivo than MTRasym, and in our study, MRTrex and AREX do have a better sensitivity in telling changes in acute MPTP-induced PD mice's SN.
On the other hand, the experimental results about area of amide peak at δ 3.5 in the Z-spectrum suggested amide proton transfer (APT) imaging can't apply in this animal PD model which is inconsistent with some studies[12, 13] on PD human patients. Maybe the amide level of SN after MPTP administration is unchanged or insignificantly changed in mice. Similarly, ion accumulation in subacute MPTP-induced PD mice is not easily observable[20] while it is common in human patients. The specific pathogenesis of animal PD models and PD patients still needs further investigations. The peak area at δ 2.0 in the Z-spectrum was altered significantly before and after establishment of PD mice. So the MT effect across the whole Z-spectrum probably stay unchanged, which means that the semi-solid component in SN doesn't alter after MPTP administration and hence this quantification could effectively indicate changes of CEST effect at that offset.
In 2014, Adriane et al.[21] scanned the brain of 21 PD patients and 24 healthy volunteers by 3D-MRS and the result pointed out that N-acetyl aspartate (NAA), choline, inositol and creatine significantly decreased in PD patients while glutamate and glutamine slightly increased. Some of these metabolites were proven available in CEST experiments. In the studies on Z-spectrum signals at δ 2.0 recently, Cai et al.[22] found that this signal in glioma of rat model is strongly correlated with the tumor progress, and the signal source is mainly from the creatine after cross-comparison with MRS results. The further researches by Zu et al.[23] suggested that the great contribution from proteins, amino acids and polypeptides besides creatine to CEST signal at δ 2.0 can not be ignored. Therefore, we believe that the reduction of creatine and relative proteins may play a key role in the signal decrease after combining our CEST experiments results with the MRS results of PD patients in earlier study. However, the exact components of CEST signal source at δ 2.0 in PD mice's SN so far still remain unclear. The less specificity may limit the clinical application of CEST.
3 ConclusionIn this study, we performed two different analysis on the CEST signal at δ 2.0 of cortex, SN, hippocampus of acute MPTP-induced PD mice, which indicates that CEST can be applied to detection of SN destructions in PD mice. And the quantification metrics (MTRrex and AREX) derived from the combination of multi-pool Lorentzian fitting and inverse Z-spectrum analysis is superior to the frequently-use Z-spectrum asymmetry one (MTRasym). However, partial volume effect inevitably exists due to the limitation of used sequences in experiment and it may weaken the accuracy of results. We would exploit 3D-CEST to perform full-brain scan to improve the quality of data in our further research.
| [1] | DUGUID J R, DE LA PAZ R, DEGROOT J. Magnetic resonance imaging of the midbrain in Parkinson's disease[J]. Ann Neurol, 1986, 20(6): 744-747. DOI: 10.1002/(ISSN)1531-8249. |
| [2] | BAUDREXEL S, WITTE T, SEIFRIED C, et al. Resting state fMRI reveals increased subthalamic nucleus-motor cortex connectivity in Parkinson's disease[J]. Neuroimage, 2011, 55(4): 1728-1738. DOI: 10.1016/j.neuroimage.2011.01.017. |
| [3] | PRAKASH B D, SITOH Y Y, TAN L C, et al. Asymmetrical diffusion tensor imaging indices of the rostral substantia nigra in Parkinson's disease[J]. Parkinsonism Relat Disord, 2012, 18(9): 1029-1033. DOI: 10.1016/j.parkreldis.2012.05.021. |
| [4] | LANGKAMMER C, PIRPAMER L, SEILER S, et al. Quantitative susceptibility mapping in parkinson's disease[J]. PLoS One, 2016, 11(9): e0162460. DOI: 10.1371/journal.pone.0162460. |
| [5] | AU W L, ADAMS J R, TROIANO A, et al. Neuroimaging in Parkinson's disease[J]. J Neural Transm Suppl, 2006(70): 241-248. |
| [6] | TAMBASCO N, PELLICCIOLI G P, CHIARINI P, et al. Magnetization transfer changes of grey and white matter in Parkinson's disease[J]. Neuroradiology, 2003, 45(4): 224-230. DOI: 10.1007/s00234-002-0925-5. |
| [7] | WANG M Y, HONG X H, CHANG C F, et al. Simultaneous detection and separation of hyperacute intracerebral hemorrhage and cerebral ischemia using amide proton transfer MRI[J]. Magn Reson Med, 2015, 74(1): 42-50. DOI: 10.1002/mrm.25690. |
| [8] | ZAISS M, WINDSCHUH J, GOERKE S, et al. Downfield-NOE-suppressed amide-CEST-MRI at 7 Tesla provides a unique contrast in human glioblastoma[J]. Magn Reson Med, 2017, 77(1): 196-208. DOI: 10.1002/mrm.v77.1. |
| [9] | ZAISS M, WINDSCHUH J, PAECH D, et al. Relaxation-compensated CEST-MRI of the human brain at 7 T: Unbiased insight into NOE and amide signal changes in human glioblastoma[J]. Neuroimage, 2015, 112: 180-188. DOI: 10.1016/j.neuroimage.2015.02.040. |
| [10] |
TAO Q, YI P W, WEI G J, et al. Recent progress on the method, principle and application of pH imaging based on chemical exchange saturation transfer mechanism[J].
Chinese J Magn Reson, 2018, 35(4): 505-519.
陶泉, 易佩伟, 魏国境, 等. 基于CEST机制的pH成像方法、原理和应用[J]. 波谱学杂志, 2018, 35(4): 505-519. |
| [11] |
ZHANG M, LU J H, CAI C B, et al. Effects of lipids signals on nuclear overhauser enhancement contrast imaging at 7 T[J].
Chinese J Magn Reson, 2015, 32(4): 606-617.
张苗, 卢建华, 蔡聪波, 等. 7 T下脂肪对基于NOE的磁共振对比成像的影响[J]. 波谱学杂志, 2015, 32(4): 606-617. |
| [12] | LI C M, PENG S, WANG R, et al. Chemical exchange saturation transfer MR imaging of Parkinson's disease at 3 Tesla[J]. Eur Radiol, 2014, 24(10): 2631-2639. DOI: 10.1007/s00330-014-3241-7. |
| [13] | LI C M, WANG R, CHEN H B, et al. Chemical exchange saturation transfer mr imaging is superior to diffusion-tensor imaging in the diagnosis and severity evaluation of Parkinson's disease: A study on substantia nigra and striatum[J]. Front Aging Neurosci, 2015, 7: 198. |
| [14] | BAGGA P, CRESCENZI R, KRISHNAMOORTHY G, et al. Mapping the alterations in glutamate with GluCEST MRI in a mouse model of dopamine deficiency[J]. J Neurochem, 2016, 139(3): 432-439. DOI: 10.1111/jnc.2016.139.issue-3. |
| [15] | ZAISS M, XU J Z, GOERKE S, et al. Inverse Z-spectrum analysis for spillover-, MT-, and T1-corrected steady-state pulsed CEST-MRI-application to pH-weighted MRI of acute stroke[J]. NMR Biomed, 2014, 27(3): 240-252. DOI: 10.1002/nbm.v27.3. |
| [16] | WINDSCHUH J, ZAISS M, MEISSNER J E, et al. Correction of B1-inhomogeneities for relaxation-compensated CEST imaging at 7 T[J]. NMR Biomed, 2015, 28(5): 529-537. DOI: 10.1002/nbm.v28.5. |
| [17] | SAEED U, COMPAGNONE J, AVIV R I, et al. Imaging biomarkers in Parkinson's disease and Parkinsonian syndromes: current and emerging concepts[J]. Transl Neurodegener, 2017, 6: 8. DOI: 10.1186/s40035-017-0076-6. |
| [18] | VAN ZIJL P C M, LAM W W, XU J D, et al. Magnetization transfer contrast and chemical exchange saturation transfer MRI. Features and analysis of the field-dependent saturation spectrum[J]. Neuroimage, 2017, 168: 222-241. |
| [19] | ZAISS M, BACHERT P. Chemical exchange saturation transfer (CEST) and MR Z-spectroscopy in vivo: a review of theoretical approaches and methods[J]. Phys Med Biol, 2013, 58(22): R221-R269. DOI: 10.1088/0031-9155/58/22/R221. |
| [20] |
GUAN J J, FENG Y Q. Quantitative magnetic resonance imaging of brain iron deposition: comparison between quantitative susceptibility mapping and transverse relaxation rate (R2*) mapping[J].
Journal of Southern Medical University, 2018, 38(3): 305-311.
关基景, 冯衍秋. 脑铁沉积的MR定量分析方法:定量磁化率成像与横向弛豫率成像比较[J]. 南方医科大学学报, 2018, 38(3): 305-311. DOI: 10.3969/j.issn.1673-4254.2018.03.10. |
| [21] | GROGER A, KOLB R, SCHAFER R, et al. Dopamine reduction in the substantia nigra of Parkinson's disease patients confirmed by in vivo magnetic resonance spectroscopic imaging[J]. PLoS One, 2014, 9(1): e84081. DOI: 10.1371/journal.pone.0084081. |
| [22] | CAI K J, SINGH A, POPTANI H, et al. CEST signal at 2ppm (CEST@2ppm) from Z-spectral fitting correlates with creatine distribution in brain tumor[J]. NMR Biomed, 2015, 28(1): 1-8. |
| [23] | ZU Z L, LOUIE E A, LIN E C, et al. Chemical exchange rotation transfer imaging of intermediate-exchanging amines at 2 ppm[J]. NMR Biomed, 2017, 30(10). DOI: 10.1002/nbm.3756. |
 2019, Vol. 36
