Ni-based catalysts are widely used in many important industrial reactions, such as hydrogenation[1], oxidation[2], and reforming of alcohols[3]. However, carbon deposition on Ni at high temperature during operation often leads to deactivation of the catalyst[4, 5]. Previous studies show that Ni/CeO2 is an efficient and low-cost catalyst for many important catalytic reactions including water-gas shift reaction[6], ethanol steam reforming[7], dry reforming of methane[8], which can also be very stable at reaction conditions. It is shown that Ni ions can be embedded in the ceria fluorite lattice, i.e., the Ce ions can be replaced by the Ni ions in the mixed oxide and the structure maintain the fluorite type[6]. Such special structural configuration is considered as the key to the good catalytic properties of Ce1-xNixO2-y solid solution. X-ray diffraction (XRD) data, which is based on the long-range order of the materials, shows that the highest concentration of Ni ions in such solid solution is within the range of 10%~12%. However, the value of surface Ni species during catalytic reactions occurrence, which is important for catalytic performance, may be different from that extracted from XRD measurements.
Solid-state nuclear magnetic resonance (NMR) spectroscopy, a powerful characterization method providing rich short-range order information for solids, is complementary to the information obtained from XRD[9, 10]. Recently, 17O solid-state NMR spectroscopy, combined with density functional theory (DFT) calculations, was demonstrated as a new approach to extract surface structural information of oxide nanomaterials[11-14]. In particular, oxygen ions at 1st, 2nd and 3rd layers of ceria nanoparticles[15] can be differentiated based on their distinct NMR shifts. Since Ni ion is likely in a +2 oxidation state[6], large electronic dipole interactions can lead to broad resonance peaks or decreases in intensities of sharp peaks. Such changes give an opportunity to analyze the concentrations of surface Ni ions. Here we demonstrate the analysis of Ni ions' concentration in the surface of Ni/CeO2 based on 17O magic-angle spinning (MAS) NMR data.
1 Experimental section 1.1 Material preparationCeria nanorods exposing {111} facets were prepared by a hydrothermal method according to the procedures introduced by Mai et al.[16]. The obtained sample was calcined at 700 ℃ and denoted as CeO2-700. Ni/CeO2 samples with different concentrations of Ni ion {n(Ni)/[n(Ni)+n(Ce)]=10% and 20% in the starting materials} were prepared by an impregnation method using CeO2-700 followed by calcination of the Ni-containing CeO2 at different temperatures (300 ℃ and 500 ℃). These samples were denoted 10 % NiCe-500, 20% NiCe-300 and 20% NiCe-500 according to their Ni concentrations and calcination temperatures. The materials still expose {111} facets after impregnation and calcination (Fig. S1 and S2, available in the online version).
1.2 17O-enrichment proceduresSamples were first heated at 300 ℃ for 3 h under vacuum before cooling down to the room temperature. After that, a same amount of H217O (90 % in 17O, Isotec Inc.) were introduced to the samples via a vacuum system and the mixture were treated at 100 ℃ or the room temperature.
1.3 NMR experiments17O MAS NMR experiments were performed on a 9.4 T Bruker Avance Ⅲ spectrometer with a 4.0 mm MAS probe operating at 54.2 MHz at ambient temperature. All the samples were packed inside the rotors in a N2 dry glove box and spun at a MAS rate of 14 kHz. A single pulse sequence with an excitation pulse of 1.3 μs corresponding to a hard π/6 pulse was used in all experiments. The recycle delays were set to 0.5 s and 0.1 s, for CeO2-700 and Ni-containing samples, respectively, both of which were optimized to ensure quantitative measurements. All the chemical shifts were externally referenced to water at δ 0.0.
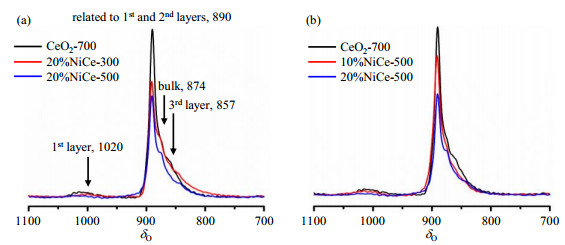
2 Results and discussion 2.1 The influence of Ni concentration and calcination temperatures on 17O MAS NMR spectraFig. 1 shows the 17O MAS NMR spectra of different 17O-enriched samples treated at room temperature. For all the samples, a strong and sharp peak at δ 890, along with shoulders at δ 874 and δ 857 can be observed. According to our previous results[15], the peaks at δ 857 and δ 874 can be assigned as oxygen ions in the 3rd layer and the bulk part of the nanorods (4th layer or deeper), respectively. The major resonance at δ 890 has been observed using dynamic nuclear polarization (DNP) NMR[17], which was assigned to the oxygen ions at 2nd layer. However, such strong signal arising from the oxygen species of the 2nd layer seems to be contradicted to the very small peak at approximately δ 1 020 due to oxygen species in the 1st layer. This discrepancy may be related to the presence of a relatively large amount of water adsorbed on the surface for the samples studied here and the one with DNP NMR, which was removed by heating the materials under vacuum at 100 ℃ in our previous studies. Therefore, the signal at δ 890 may be tentatively assigned to the surface oxygen species (1st and 2nd layer) with water molecules nearby. Nonetheless, a decrease in the intensity can be clearly observed for all the signals at lower frequencies (δ 890, 874 and 857). This can be attributed to the incorporation of Ni2+ in the lattice. The Ni2+ can broaden the resonance peak. The resonance signals of oxygen directly bound to Ni2+ are usually as broad as several thousand ppm due to large electron-nuclear spin interactions, while oxygen ions further away exhibit relatively narrow linewidths[18, 19]. In our case, since the linewidths of all the resonance peaks at lower frequencies are only around δ 20~30, the signals due to the oxygen ions bound to Ni2+ are practically eliminated. Clearly, with the increase of Ni in the starting material, the signal intensity decreases, indicating more Ni2+ are incorporated in the lattice. At the same time, the increase in the thermal treatment temperature also leads to the decrease in the spectral intensity, suggesting that higher temperature can cause more Ce ions to be replaced by Ni ions. The relative intensities arising from the oxygen ions in the 3rd layer in the Ni-containing samples compared to the parent CeO2-700 sample, are extracted by using NUTS NMR data processing software (Acorn NMR Inc.) (Fig. S3, available in the online version) and shown in Table 1.
|
Fig. 1 17O MAS NMR spectra of different 17O-enriched samples at room temperature. (a) Samples calcined at different temperatures; (b) Samples with different concentration of Ni loadings |
| Table 1 The fractions of the 17O ions in the 3rd layer of the 17O-enriched samples at room temperature |
17O MAS NMR experiments were also performed on the 17O-enriched samples at 100 ℃ and the corresponding spectra are shown in Fig. 2. The resonance peaks at δ 1 033, 925 and 878 can be assigned to the oxygen ions in the 1st, 2nd layer and bulk part of ceria nanorods, respectively, although the resolution does not allow the oxygen ions at the 3rd layer to be resolved. Similarly, the intensities of the peaks at 2nd layer and the bulk part of the sample decrease with the incorporation of Ni. Unexpectedly, the intensity of the major resonance at δ 925 of 20% NiCe-500 arising from the oxygen ions at 2nd layer is stronger than 10% NiCe-500. XRD analysis (Fig. S4, available in the online version) shows that NiO phase is present in 20% NiCe-500. Thus, further quantitative analysis was not performed on this sample. The intensity of the signal centered at δ 1 033 due to the oxygen ions on the surface does not seem to vary much with the amount of Ni, which may be associated with its much broader linewidths. The fractions of the intensities of the signals owing to the oxygen ions in the 2nd layer in Ni/CeO2 samples, as compared to CeO2-700, are obtained and shown in Table 2.

|
Fig. 2 17O MAS NMR spectra of different 17O-enriched samples at 100 ℃. (a) Samples calcined at different temperatures; (b) Samples with different Ni loadings |
| Table 2 The fractions of the 17O ions in the 2nd layer of the 17O-enriched samples at 100 ℃ |
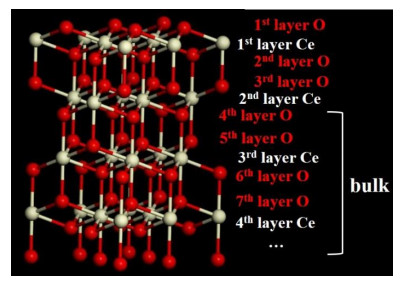
The ceria nanorods prepared mostly expose {111} facets and oxygen ions are 3-(surface) or 4-coordinated (subsurface or other). If one of the Ce4+ bound with oxygen ion is replaced by Ni2+, such oxygen ion will be invisible in the 17O NMR spectrum due to the large electron-nuclear spin interactions. Therefore, the concentration of surface Ni2+ should correlate to the decrease of 17O signals in Ni/CeO2, if another assumption is accepted that the 17O NMR resonance of oxygen ions in the 3rd coordination shell is not affected (i.e., 17O-Ce-O-Ni). However, it is possible that one oxygen ion directly connects to more than one Ni2+ ions, and some further constraints on the distribution of Ni2+ needs to be added in order to extract the concentrations of surface Ni. For the convenience of quantitative analysis, the coordinated conditions of different oxygen ions and Ni ions are listed below, according to the structure of CeO2 {111} facets (Fig. 3):
|
Fig. 3 Schematic representation of ceria nanorods exposing {111} facets |
● For oxygen ions in the 2nd layer: each Ni ion in the 1st layer influences m oxygen ions in the 2nd layer, while each Ni ion in the 2nd layer influences 1 oxygen ion in the 2nd layer;
● For oxygen ions in the 3rd layer: each Ni ion in the 1st layer influences 1 oxygen ion in the 3rd layer, while each Ni ion in the 2nd layer influences n oxygen ions in the 3rd layer.
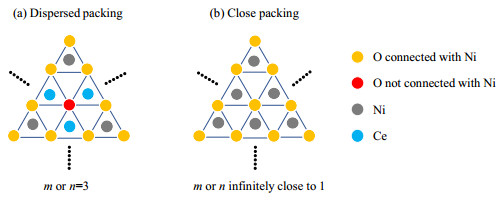
Parameters m and n reflect the distributions of Ni ions in the 1st and 2nd layer of metal ions (Ce and Ni). As shown in Fig. 4, the ranges of parameters m and n have two boundary conditions: dispersed and closed packing. The parameter m or n equals 3 in the condition of dispersed packing, in which no Ni-O-Ni environment is present [Fig. 4(a)]. If all the Ni2+ ions are connected and Ni-O-Ce environments are only found on the boundaries, parameter m or n is infinitely close to 1. Therefore, the range for the possible values of the parameter m or n is (1, 3].
|
Fig. 4 Schematic representation of dispersed (a) and close packing (b) for parameters m and n |
Based on the above assumptions and constraints, the fractions of surface Ni ions in Ni/CeO2 can be extracted. For a given sample, we can define:
x1 = fraction of Ni ions in the 1st metal ion layer calculated by Ni/(Ni+Ce);
x2 = fraction of Ni ions in the 2nd metal ion layer calculated by Ni/(Ni+Ce);
A = decrease in intensity of oxygen ions in the 2nd layer compared to CeO2-700;
B = decrease in intensity of oxygen ions in the 3rd layer compared to CeO2-700.
The decrease of the 17O NMR intensity arising from the oxygen ions in the 2nd layer is caused by Ni ions at the 1st layer and 2nd layer. After removing double counting, the first equation is obtained:
| $ m{x_1} + {x_2}(1 - m{x_1}) = A $ | (1) |
Similarly, there is a second equation for the decrease of the 17O NMR intensity arising from the oxygen ions in the 3rd layer:
| $ n{x_2} + {x_1}(1 - n{x_2}) = B $ | (2) |
A and B of different samples (Table 3) can be obtained from Table 2 and 1, respectively.
| Table 3 The values of A and B for different samples |
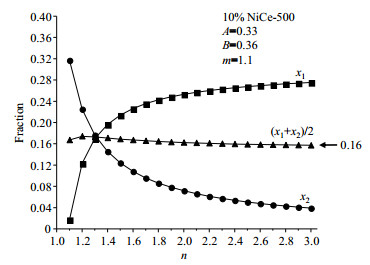
Fig. 5(a) and 5(b) show the variations of x1, x2 with parameters m and n. The values of x1 and x2 vary a lot as the parameter m or n changes. The average fractions of Ni ions in the top two layers, which are most important in catalytic applications, however, vary in a much smaller range [Fig. 5(c)]. For example, Fig. 6 shows the variations of the values of x1, x2 and (x1+x2)/2 with the parameter n when m=1.1 in 10% NiCe-500. The value of (x1+x2)/2 is close to 0.16 whatever the value of n is although different values of n mean different Ni distribution in the 2nd layer.

|
Fig. 5 Variations of x1 (a), x2 (b) and (x1 + x2)/2 (c) with the parameter m and n in 10% NiCe-500 |
|
Fig. 6 Variations of x1, x2 and (x1 + x2)/2 with the parameter n when m=1.1 in 10 % NiCe-500 |
Similar results are found when the parameter m changes. Fig. 7 shows the variations of (x1+x2)/2 with the parameter n when the parameter m equals 1.1, 1.7, 2.3 and 3.0, the values of (x1+x2)/2 are in the range of 0.16~0.17, 0.12~0.16, 0.10~0.16 and 0.09~0.16, respectively. That is, the values of (x1+x2)/2 vary from 0.09 to 0.17 in all the possible values of parameters m and n. Therefore, the average surface Ni concentration in the 1st and 2nd metal ion layers of 10% NiCe-500 is in the range of 9%~17%.
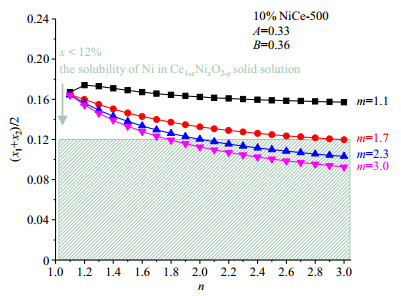
|
Fig. 7 The variation of (x1+x2)/2 with parameter n when parameter m takes different values in 10% NiCe-500. The shaded area shows the possible concentration of Ni in Ce1-xNixO2-y solid solution[6] |
It is clear that the higher the parameter m or n, the lower the values of (x1+x2)/2. When both the parameter m and n reach 3, meaning that Ni ions are distributed evenly in the top two layers of ceria, x1=0.09 and x2=0.10. This is consistent with the previous research of Ce1-xNixO2-y solid solution that the highest fraction of Ni is about 10%~12%[6]. However, if Ni ions form some kinds of clusters, our data suggest a higher concentration of Ni in the top two layers would be likely.
2.2.2 Concentration of Ni in the top two layers of 20% NiCe-300Similarly, the values of x1 and x2 change a lot with the variation of parameters m and n for 20% NiCe-300 [Fig. 8(a) and 8(b)], while the values of (x1+x2)/2 stay in a much smaller range [Fig. 8(c)]. Fig. 9 shows the variations of (x1+x2)/2 with the parameter n when the parameter m equals 1.1, 1.7, 2.3 and 3.0, the values of (x1+x2)/2 are within the range of 0.13~0.15, 0.10~0.14, 0.09~0.14 and 0.08~0.13, respectively. Therefore, the average surface Ni amount in the 1st and 2nd metal ion layers of 20% NiCe-300 is within the range of 8%~15%.

|
Fig. 8 Variations of x1 (a), x2 (b) and (x1+x2)/2 (c) with the parameters m and n in 20% NiCe-300 |

|
Fig. 9 The variation of (x1+x2)/2 with parameter n when parameter m takes different values in 20% NiCe-300. The shaded area shows the possible concentration of Ni in Ce1-xNixO2-y solid solution[6] |
Again, the higher values of parameters m and n lead to the smaller values of (x1+x2)/2. The smaller fraction of surface Ni in 20% NiCe-300 as compared to 10% NiCe-500 can be predicted by observing smaller values for A and B. This suggests that a thermal treatment temperature of 300 ℃ is not as efficient to incorporate Ni in the ceria lattice as 500 ℃.
3 ConclusionIn this study, 17O MAS NMR experiments have been performed on 17O-labeled CeO2 and Ni/CeO2 samples. Considering the coordination of Ni and O ions, as well as the distribution of Ni in the 1st and 2nd layers of ceria nanorods, we have established quantitative relationships between the Ni fractions in top two metal ion layers and the relative peak intensities of oxygen ions in the 2nd and 3rd layers. Analysis shows that the Ni concentrations in top two metal ion layers of 10% NiCe-500 and 20% NiCe-300 are within the ranges of 9%~17% and 8%~15%, respectively. This method may be extended to other complicated oxides to extract the relative concentrations of the doped paramagnetic ions.
| [1] | ZIELIŃSKI M, WOJCIECHOWSKA M. Studies of new magnesium fluoride supported nickel catalysts for toluene hydrogenation[J]. Catal Today, 2011, 169(1): 175-180. DOI: 10.1016/j.cattod.2010.10.060. |
| [2] | GONG M, LI Y G, WANG H L, et al. An advanced Ni-Fe layered double hydroxide electrocatalyst for water oxidation[J]. J Am Chem Soc, 2013, 135(23): 8452-8455. DOI: 10.1021/ja4027715. |
| [3] | VAIDYA P D, RODRIGUES A E. Insight into steam reforming of ethanol to produce hydrogen for fuel cells[J]. Chem Eng J, 2006, 117(1): 39-49. DOI: 10.1016/j.cej.2005.12.008. |
| [4] | DU X J, ZHANG D S, SHI L Y, et al. Morphology dependence of catalytic properties of Ni/CeO2 nanostructures for carbon dioxide reforming of methane[J]. J Phys Chem C, 2012, 116(18): 10009-10016. DOI: 10.1021/jp300543r. |
| [5] | THEOFANIDIS S A, GALVITA V V, POELMAN H, et al. Enhanced carbon-resistant dry reforming Fe-Ni catalyst:role of Fe[J]. ACS Catal, 2015, 5(5): 3028-3039. DOI: 10.1021/acscatal.5b00357. |
| [6] | BARRIO L, KUBACKA A, ZHOU G, et al. Unusual physical and chemical properties of Ni in Ce1-xNixO2-y oxides:structural characterization and catalytic activity for the water gas shift reaction[J]. J Phys Chem C, 2010, 114(29): 12689-12697. DOI: 10.1021/jp103958u. |
| [7] | ZHOU G, BARRIO L, AGNOLI S, et al. High activity of Ce1-xNixO2-y for H2 production through ethanol steam reforming:tuning catalytic performance through metal-oxide interactions[J]. Angew Chem Int Ed Engl, 2010, 49(50): 9680-9684. DOI: 10.1002/anie.201004966. |
| [8] | LIU Z Y, GRINTER D C, LUSTEMBERG P G, et al. Dry reforming of methane on a highly-active Ni-CeO2 catalyst:effects of metal-support interactions on C-H bond breaking[J]. Angew Chem Int Ed Engl, 2016, 55(26): 7455-7459. DOI: 10.1002/anie.201602489. |
| [9] |
LI D B, XU S, YU Z W. Application of solid-state NMR to bone and bone biomaterials[J].
Chinese J Magn Reson, 2017, 34(1): 115-129.
李东北, 许帅, 喻志武. 固体核磁共振技术在骨基生物材料研究中的应用[J]. 波谱学杂志, 2017, 34(1): 115-129. |
| [10] |
XU X J, WANG S L. Probing membrane protein interactions by 19F solid-state NMR[J].
Chinese J Magn Reson, 2019, 36(2): 238-251.
徐小俊, 王申林. 19F固体核磁共振技术研究膜蛋白相互作用的进展[J]. 波谱学杂志, 2019, 36(2): 238-251. |
| [11] | SHEN L, PENG L M. 17O solid-state NMR studies of oxygen-containing catalysts[J]. Chin J Catal, 2015, 36(9): 1494-1504. DOI: 10.1016/S1872-2067(15)60931-7. |
| [12] | DU J H, PENG L M. Recent progress in investigations of surface structure and properties of solid oxide materials with nuclear magnetic resonance spectroscopy[J]. Chinese Chem Lett, 2018, 29(6): 747-751. DOI: 10.1016/j.cclet.2018.02.012. |
| [13] | SHEN L, WU X P, WANG Y, et al. 17O solid-state NMR studies of ZrO2 nanoparticles[J]. J Phys Chem C, 2019, 123(7): 4158-4167. DOI: 10.1021/acs.jpcc.8b11091. |
| [14] | LI Y H, WU X P, JIANG N X, et al. Distinguishing faceted oxide nanocrystals with 17O solid-state NMR spectroscopy[J]. Nat Commun, 2017, 8(1): 581. DOI: 10.1038/s41467-017-00603-7. |
| [15] | WANG M, WU X P, ZHENG S J, et al. Identification of different oxygen species in oxide nanostructures with 17O solid-state NMR spectroscopy[J]. Sci Adv, 2015, 1(1): e1400133. DOI: 10.1126/sciadv.1400133. |
| [16] | MAI H X, SUN L D, ZHANG Y W, et al. Shape-selective synthesis and oxygen storage behavior of ceria nanopolyhedra, nanorods, and nanocubes[J]. J Phys Chem B, 2005, 109(51): 24380-24385. DOI: 10.1021/jp055584b. |
| [17] | HOPE M A, HALAT D M, MAGUSIN P C, et al. Surface-selective direct 17O DNP NMR of CeO2 nanoparticles[J]. Chem Commun (Camb), 2017, 53(13): 2142-2145. DOI: 10.1039/C6CC10145C. |
| [18] | HALAT D M, DERVIŞOĞLU R, KIM G, et al. Probing oxide-ion mobility in the mixed ionic-electronic conductor La2NiO4+δ by solid-state 17O MAS NMR spectroscopy[J]. J Am Chem Soc, 2016, 138(36): 11958-11969. DOI: 10.1021/jacs.6b07348. |
| [19] | HALAT D M, DUNSTAN M T, GAULTOIS M W, et al. Study of defect chemistry in the system La2-xSrxNiO4+δ by 17O solid-state NMR spectroscopy and Ni K-edge XANES[J]. Chem Mater, 2018, 30(14): 4556-4570. DOI: 10.1021/acs.chemmater.8b00747. |
 2020, Vol. 37
