2. State Key Laboratory of Petroleum Resources and Prospecting, China University of Petroleum, Beijing 102249, China
2. 油气资源与探测国家重点实验室, 中国石油大学(北京), 北京 102249
As an efficient, non-destructive detection technology for fluid and gas involved in porous media, on-line nuclear magnetic resonance (NMR) has been be widely applied in a variety of disciplines such as physics, chemistry, biology, medicine, agriculture, geology and so on, all of which have real-time demand. In contrast to traditional low-field NMR static measurement mode, on-line detections are faced to many challenges. Instruments and pulse sequences which are applicable to the static detection cannot be directly exploited for on-line measurement.
There are two modes of on-line NMR detection. One is stationary sample with mobile probe, which can be used to detect large objects, such as well logging[1], on-line scanning of building material[2] and soil moisture[3]. The other one is stationary probe with mobile sample, which can be applied to the detection of the fluid flow in real time[4, 5], such as the blood flow rate measurements[6], on-line detection for transport pipeline of gas or liquid, monitoring of chemical reaction processes, etc. In the first detection mode, the measurement responses are mainly affected by velocity, while the second one is influenced by both measurement velocity and the physical properties of the sample. The main object of this study is focused on the second detection mode.
In 1948, Bloembergen et al[7] proposed that the NMR relaxation rate of the fluid is directly related to the correlation time (τc), which describes molecular size, under the same experimental conditions. In 2003, Benjamin et al[8, 9] put forward that the parameter in Bloembergen equations[7], which describes the adjacent coupling pole spacing, is related to molecular structure, and set as the foundation for predicting fluid viscosity. In this paper, τc acts as the bridge between molecular structure and NMR relaxation, we analyze the influence of molecular dipole spacing on relaxation, and predict molecular structure by the measurement of on-line two-dimensional (2D)[10] relaxation pulse sequence.
This article is based on previous studies, the development of on-line NMR fluid analysis system and 2D relaxation time on-line measurement pulse sequence, to achieve on-line detection for flow fluid molecule.
1 Flowing effect on on-line NMR measurementsThere are striking distinctions between on-line NMR measurement of the fluid flow and the static measurement of fluid. The fluid molecules in the detection region of the NMR probe experience Brownian motion under the static measurement state, where the sample has sufficient polarization time. And the fluid does not change much in the process of collecting echo signals and the transmitting pulse sequence within the detection area. But the flow fluid sample may not have sufficient time to experience complete polarization in the motion state NMR measurement, due to the flow rate[11]. And in the process of transmitting pulse sequence and the collection of echoes, the fluid in the area of detection is constantly changing, which inevitably leads to the signal loss during acquisition. Furthermore, the physical properties of the flow fluid may change. Flow can conceal the effect of Brownian motion of fluid[12], and result in the enlargement of diffusion coefficient. This will directly affect the measurement of transverse relaxation time (T2).
It's very inefficient to directly use objective magnetization vector of pre-polarization magnet for flow fluid samples during the polarization process. Because it requires longer pre-polarization magnet, and the faster the flow rate, the longer pre-polarization magnet it requires.
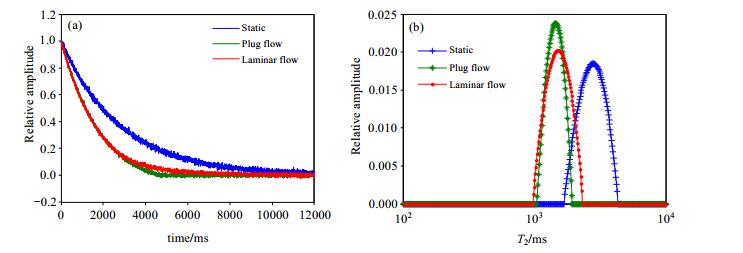
In previous work[11], we have analyzed the motion effects of well logging in oil industry and proposed motion correction method. Notably, wireline NMR logging has been is achieved by acquiring NMR signal with the continuous motion of probe and static detected sample. In other words, sample and probe keep translational motion, which is different from on-line measurement of fluid. According to the rheology property of fluid, there are four main flow states[13], such as plug, laminar, transitional and turbulent flow. For non-Newtonian fluid, all of the flow states before the formation of turbulent flow with the pressure increasing are called structure flow. Structure flow exhibits different rheological modes, including Bingham mode[14], Ostwald-de Waele power law mode, Carson model[15] and Herschel-Bulkley model[16]. The fluid of the same flow mode has different flow states, which include plug flow, laminar flow turbulent flow and so on. Fig. 1 illustrates the simulation of the influence of plug flow and laminar flow on NMR signals for Newton fluid under ideal conditions with homogenous B0 and B1. From the results of simulation, the influence of plug flow and laminar flow with the same velocity on T2spectrum are almost the same, with similar migration from the static spectrum. In other words, velocity correction of flowing liquid can refer to the method in ref. [11].
|
Figure 1 Flow effect on NMR measurement |
Low-field and on-line NMR fluid analysis system (shown in Fig. 2) consists of three parts: spectrometer, sampling control system and probe. The spectrometer system includes analog circuits and digital circuits. The analog circuit is developed by us, and the digital circuit is LapNMR which is produced by Tecmag. Sampling control system composes of an adjustable flow rate pump in order to maintain a continuous flow of fluid through the probe. Probe consists of magnet and antenna.

|
Figure 2 The schematic diagram of low-field and on-line NMR fluid analysis system |
As mentioned above, the on-line measurement of fluid flow is influenced by flow rate and fast diffusion of molecules. The former one can be curbed by the velocity correction and probe design. But the latter one is difficult to quantify due to the complex factors, which can only be solved by the development of novel pulse sequence, that are sensitive to molecular diffusion. In addition, due to the limited time of sample residence in the detection region, it is highly required that rapid and efficient pulse sequences be developed for on-line measurement.
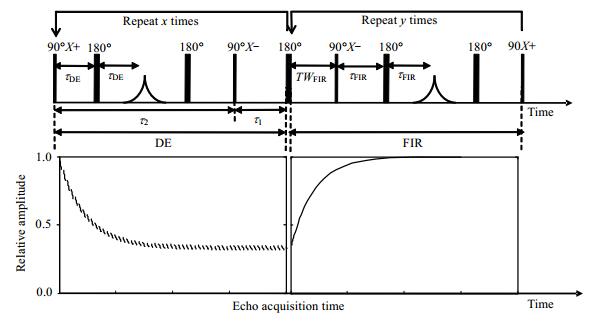
In previous work, we have proposed the DEFIR pulse sequence to measure 2D relaxation times of fluid samples. The DEFIR pulse sequence and the changing process of magnetization vector are shown in Fig. 3. It consists of two parts: an initial driven-equilibrium (DE)[17, 18] portion, followed by a fast-inversion recovery (FIR) portion. The former can rapid achieve averages of the ratio of longitudinal relaxation time to transverse relaxation time (T1/T2) in tens of milliseconds to several seconds, while the latter can determine the T1 distribution in several seconds. It's important to note that there is a 180˚ pulse transmit at the middle of DE and FIR pulse sequences which don't participate in circulation. The 2D functional relationship between T1/T2 and the T1 distribution is obtained by means of DEFIR with only two 1D measurements.
|
Figure 3 DEFIR pulse sequence and the changing process of magnetization vector |
The following formula can be obtained by DEFIR pulse sequence measurements:
| $ {\left\langle {\frac{{{T_1}}}{{{T_2}}}} \right\rangle _{{T_1}}} = \frac{{{\tau _1}}}{{{\tau _2}}}\left[ {\frac{{2{A_{{\rm{FIR}}}}\left( {\lg {T_1}} \right) - 2{A_{{\rm{DEFIR}}}}\left( {\lg {T_1}} \right)}}{{2{A_{{\rm{DEFIR}}}}\left( {\lg {T_1}} \right) - {A_{{\rm{FIR}}}}\left( {\lg {T_1}} \right)}}} \right] $ | (1) |
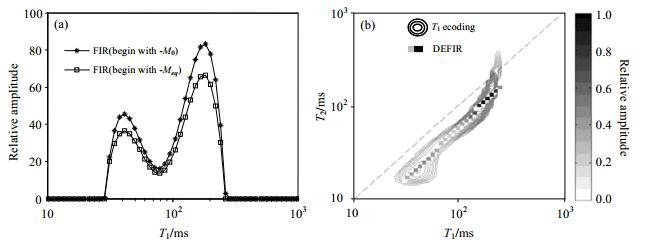
where < T1/T2> is the 2D functions relating the T1 distribution to the T1/T2 distribution, the ADEFIR(lgT1) and AFIR(lgT1) are the amplitude of T1 distribution which are determined by FIR results with two scans. According to Eq. (1), the amplitude of the T1 spectrum obtained by FIR from two scans can be used to deduce the T1/T2-T1 distribution. From this, T1-T2 distribution is obtained. A crude oil sample measurement results are shown in Fig. 4.
|
Figure 4 2D relaxation times distribution of a crude oil sample obtained by DEFIR pulse sequence measurements. (a) Measured T1 distributions by two scans Meqis the magnetization vector obtained by DE sequence, M0 is the the equilibrium sample magnetization; (b) Measured T1-T2 distributions. The equipotential line represents the T1-T2 distribution obtained by T1-ecoding pulse sequence. The solid line represents the T1-T2 distribution obtained by DEFIR sequence. The two are consistent |
Bloembergen theory is used to establish the theoretical model describing the relationship between NMR relaxation times and Brownian movement of molecules. The model relates the function of relaxation rate of proton of the detected sample and the rotational correlation time (τc):
| $ \begin{array}{l} \frac{1}{{{T_1}}} = \frac{3}{{10}}\frac{{{\gamma ^4}{\hbar ^2}}}{{{b^6}}}{\left( {\frac{{{\mu _0}}}{{4\pi }}} \right)^2}\left[ {\frac{{{\tau _c}}}{{1 + \omega _0^2\tau _c^2}} + \frac{{4{\tau _c}}}{{1 + 4\omega _0^2\tau _c^2}}} \right]\\ \frac{1}{{{T_2}}} = \frac{3}{{20}}\frac{{{\gamma ^4}{\hbar ^2}}}{{{b^6}}}{\left( {\frac{{{\mu _0}}}{{4\pi }}} \right)^2}\left[ {3{\tau _c} + \frac{{5{\tau _c}}}{{1 + \omega _0^2\tau _c^2}} + \frac{{2{\tau _c}}}{{1 + 4\omega _0^2\tau _c^2}}} \right] \end{array} $ | (2) |
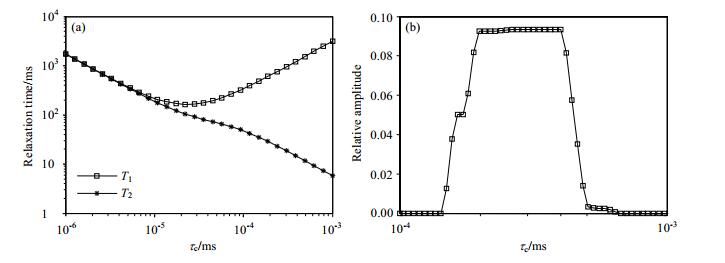
where γ is the gyromagnetic ratio; ћ is Planck's constant divided by 2π; ω0=2πf, where f is the 1H larmor frequency; μ0 is the magnetic permeability of free space, and b is the distance between two adjacent 1H on the same compound molecule. From Eq. (2), the relationship between relaxation time and τc is obtained, as shown in Fig. 5(a). To remove the effect of b, the two equations in Eq. (2) are divided:
| $ \frac{{{T_1}}}{{{T_2}}} = \frac{1}{2}\frac{{5{{\left( {1 + \omega _0^2\tau _c^2} \right)}^{ - 1}} + 2{{\left( {1 + 4\omega _0^2\tau _c^2} \right)}^{ - 1}} + 3}}{{{{\left( {1 + \omega _0^2\tau _c^2} \right)}^{ - 1}} + 4{{\left( {1 + 4\omega _0^2\tau _c^2} \right)}^{ - 1}}}} $ | (3) |
|
Figure 5 Numerical simulation and experimental results of τc distribution: (a) Relationship between relaxation time and τc at Larmor frequency of 4.26 MHz; (b) τc distributions for a crude oil sample measured by low-field and on-line NMR fluid analysis system |
The τc distribution can be obtained through the rapid measurement using DEFIR pulse sequence. Fig. 5(b) shows the measured τc distributions for a crude oil sample. Because there is direct correlation between the τc and molecular weight, so this method can be used to predict the molecular size of the sample.
Studies have shown that τc has direct correlation with molecular weight (Mw), for example, the τc of a monomeric protein in solution in nanoseconds is approximately 0.6 times of its Mw (kDa)[19]. For crude oils, it has been proved that Mw can be estimated from viscosity (η) measurements[20]. In previous work we have developed viscosity prediction method of crude oils from NMR relaxations times. This article focuses on the method for estimation of Mw of crude oils from NMR relaxations times.
With the relationship between NMR relaxation time and τc known, the relation between NMR relaxation and η can be obtained once the relation between τc and η has been established. Suppose the fluid with η has a small sphere with radius a. This sphere contains two interacting protons, whose τc is related to the radius of the sphere and influenced by the fluid viscosity. As described by the Stokes-Einstein[21] equation:
| $ {\tau _c} = \frac{{4\pi \eta {a^3}}}{{3{\rm{k}}T}} $ | (4) |
Where, T is the temperature and k is Boltzmann constant. According to Eq.(4), if the parameter a is determined, η can be inferred from τc. For the parameter a, Benjamin et al[9] carried out relevant experiments in 2007. Regardless of the complexity of the molecule structure or the saturation of hydrocarbon molecules, the measured value of a tends towards a constant a=0.43 nm. Therefore, a conclusion is obtained: when the Stokes-Einstein equation is applied to the largemolecule compound, the Brownian movement described is only part of the large molecule, that is, the local movement of a segment of the large molecule is long chain. After the molecular reorientation time τc is the mediator, η is predicted from the measured T1/T2 distribution by combining Eq.(3) and Eq.(4). Therefore, the viscosity of fluids can be measured based on NMR relaxation times.
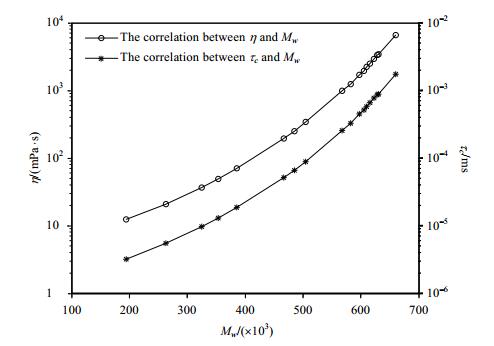
The experiment was carried out in the laboratory, using 18 crude oil samples with different viscosities (η in the range of 10~6 700 mPa·s under 30℃) using HAAKE RS600 rheometer (rotor DG41-Ti, shear rate of 9 s–1, under measuring temperature of 30 ℃) to measured η, as shown in Table 1. The DEFIR pulse sequence was used for the measurement, τDE=τFIR=0.2 ms, x=y=30, the TWFIR values were selected in the range of 0.5~15 000 ms logarithmically. We have shown here the comparison between the measured η results and the NMR predicted results of the same crude oil samples obtained in the previous work. After η of crude oils measured, Mw can be searched from American National Standard (ANSI/ASTM D2502-2004). The correlation of η, τc and Mw are shown in Fig. 6. The following formulas can be obtained by exponential fitting the experimental results:
| $ \begin{array}{l} \eta = 4.868 \times {10^{ - 3}}{{\rm{e}}^{2.136 \times {{10}^{ - 2}}{M_W}}}\\ {\tau _c} = 2.098 \times {10^{ - 9}}{{\rm{e}}^{9.224 \times {{10}^{ - 3}}{M_W}}} \end{array} $ | (5) |
| Table 1 The viscosity and estimate molecular weight of the crude oils[22] |
|
Figure 6 Mw of crude oils estimation by NMR relaxation times |
It should be noted that for any complex compound molecules, in particular alkanes, the NMR signals are mainly contributed by the interaction between adjacent 1H, as confirmed by Bloembergen theory. In fact, the distance b between 1H on the same position of molecule varies with the specific molecular structure [see Fig. 7(a)]. This is especially so for saturated hydrocarbon and unsaturated hydrocarbon molecules. As can be found from Eq.(2), the difference of b values will produce a certain impact on the relation between relaxation time and τc, as shown in Fig. 7(b). To precisely establish the relationship between relaxation time and τc, one method is to remove the influence of b in Eq.(2), and then to obtain the relationship between T1/T2 and τc. Another method is to determine the parameter b by double frequency measurement (two different ω0), which is not the focus of this article.

|
Figure 7 Effect of 1H-1H distance in the same compound molecule on NMR relaxation measurement. (a) The distance between the adjacent 1H (b) The relationship between relaxation times and τc under different b; (c) The relationship between T1/T2 and τc, which is not influenced by b |
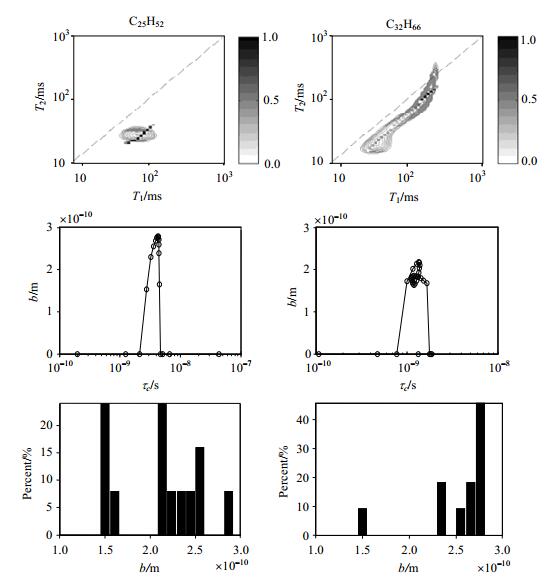
From the above analysis, combining T1/T2 distribution, measured by DEFIR pulse sequence and Eq.(3), we can obtain reorientation time τc distribution of the sample. Then substitute τc distribution into Eq.(4), we can acquire longitudinal relaxation time expression. Finally, we get b distribution of the sample, which is shown in Fig. 8.
|
Figure 8 The b distribution of C25H52 and C32H66 measured by DEFIR pulse sequence at 30 ℃, τDE=τFIR=0.2 ms, x=y=30, the TWFIR values were selected in the range of 0.5~15 000 ms logarithmically |
Low-field and on-line NMR is a rapid, non-destructive, clean and effective method, which can be used to detect fluid molecular structure after the following researches:
(1) Under the on-line fluid measurement mode, the effects of different flow mode on NMR measurement are different. Numerical simulation study found that the influence on T2 spectrum of plug flow and laminar flow with the same velocity is almost the same, which can be curbed by the velocity correction. However, this correction method can only be applied to slow flow fluid.
(2) Reorientation time τc is an important parameter to understand the molecular size and molecular weight. DEFIR pulse sequence is adopted to rapidly predict the τc based on the relaxation times of reservoir fluid. Compared with the traditional laboratory measurement, the new method is rapid and capable for flow fluid.
(3) With the relationship between NMR relaxation time and τc known, the relation between NMR relaxation and molecular weight can be obtained once the relation between τc and molecular weight is established.
(4) This paper mainly studied on crude oil samples, proposed a low-field and on-line NMR fluid molecular structure detection method. Based on this, molecule weight and 1H-1H distance could help to understand the composition structure of alkanes which are rich compounds in crude oil.
| [1] | COATS G R, XIAO L Z, PRAMMER M G. NMR logging principles and applications[M]. Houston: Gulf Professional Publishing, 1999. |
| [2] | CASANOVA F, PERLO J, BLÜMICH B. Single-sided NMR[M]. New York: Springer, 2011. |
| [3] | MATZKANIN G A. A review of nondestructive characterization of composites using NMR[M]. Holler P, Hauk V, Dobmann G, et al. Nondestructive Characterization of materials. Berlin: Springer, 1989: 655-669 |
| [4] | SURYAN J. Nuclear resonance in flowing liquids[J]. Proc Indian Acad Sci Sect A, 1951, 33: 107-111. |
| [5] | CAPRIHAN A, FUKUSHIMA E. Flow measurements by NMR[J]. Phys Rep, 1990, 198(4): 195-235. DOI: 10.1016/0370-1573(90)90046-5. |
| [6] | SINGER J R. Blood flow rates by nuclear magnetic resonance measurements[J]. Science, 1959, 130(3389): 1652-1653. DOI: 10.1126/science.130.3389.1652. |
| [7] | BLOEMBERGEN N, PURCELL E M, POUND R V. Relaxation effects in nuclear magnetic resonance absorption[J]. Phys Rev, 1948, 73(7): 679-712. DOI: 10.1103/PhysRev.73.679. |
| [8] | NICOT B, FLEURY M, LEBBOND J. A new methodology for better viscosity prediction using NMR relaxation[C]. Mexico: SPWLA 47th Annual Logging Symposium, 2006. |
| [9] | NICOT B, FLEURY M, LEBBOND J. Improvement of viscosity prediction using NMR relaxation[C]. Houston: SPWLA 48th Annual Logging Symposium, 2007. |
| [10] | SONG Y Q. Magnetic resonance at low magnetic field:Multi-dimensional experiment of relaxation and diffusion[C].杭州:第十八届全国波谱学学术年会, 2014. |
| [11] | DENG F, XIAO L Z, LIU H B, et al. Effects and correction for mobile NMR measurement[J]. Appl Magn Reson, 2013, 44(9): 1053-1065. DOI: 10.1007/s00723-013-0462-x. |
| [12] | BOUTON J, PRAMMER M G, MASAK P, et al. Assessment of sample contamination by downhole NMR fluid analysis[C]. Louisiana: SPE Annual Technical Conference and Exhibition, 2001. |
| [13] | KOCHIN N E, KIBEL I A, ROZE N V. Theoretical hydromechanics[J]. Phys Today, 2009, 19(3): 76. |
| [14] | BINGHAM E C. Fluidity and plasticity[M]. USA: McGraw-Hill Book Co., 1922. |
| [15] | CASSON N. A Flow equation for pigment oil-suspen-sions of the printing ink type[M]. Mill C C. Rheolgy of disperse systems. London and New York: Pergamon Press, 1959: 84-104. |
| [16] | HERSCHEL W H, BULKLEY R. Measurement of consistency as applied to rubber-benzene solutions[C]. Atlantic City: 29th Annual Meeting of the American Society Testing Materials, 1926: 621-633. |
| [17] | BECKER E D, FERRETTI J A, FARRAR T C. Driven equilibrium fourier transform spectroscopy:A new method for nuclear magnetic resonance signal enhancement[J]. J Am Chem Soc, 1969, 91(27): 7784-7785. DOI: 10.1021/ja50001a068. |
| [18] | MITCHELL J, HÜRLIMANN M D, FORDHAM E J. A rapid measurement of T1/T2:The DECPMG sequence[J]. J Magn Reson, 2009, 200(2): 261-268. DOI: 10.1016/j.jmr.2009.07.008. |
| [19] | KAY L E, TORCHIA D A, BAX A. Backbone dynamics of proteins as studied by 15N inverse detected heteronuclear NMR spectroscopy:application to staphylococcal nuclease[J]. Biochemistry, 1989, 28(23): 8972-8979. DOI: 10.1021/bi00449a003. |
| [20] | SADEGH BEIGI R. Appendix 5:Estimation of molecular weight of petroleum oils from viscosity measurements-fluid catalytic cracking handbook[M]. Second edition. Fluid Catalytic Cracking Handbook, 2000: 342-343. |
| [21] | EINSTEIN A. On the movement of small particles suspended in stationary liquids required by the molecular-kinetic theory of heat[J]. Annalen Der Physik, 1905, 322(8): 549-560. DOI: 10.1002/(ISSN)1521-3889. |
| [22] | DENG F, XIAO L Z, CHEN W L, et al. Rapid determination of fluid viscosity using low-field two-dimensional NMR[J]. J Magn Reson, 2014, 247: 1-8. DOI: 10.1016/j.jmr.2014.08.003. |
 2017, Vol. 34
